USD JPY Forecast Today, 2 October 2026: Pullback or Reversal?
EXECUTIVE SUMMARY
Verdict: BUY
The daily and four hour are both showing buying pressure. All three entry timeframes have turned down, so only one ticket exists today.
Open and Closed Tickets
| Timeframe | Direction | Entry | Stop | Targets | Status |
|---|---|---|---|---|---|
| H4 | BUY | 157.916 | 156.873 | 0 of 3 | Running, behind entry |
| H1 | BUY | No ticket | Waiting for alignment | ||
| M30 | BUY | No ticket | Waiting for alignment | ||
| M15 | BUY | No ticket | Waiting for alignment |
What the Panel Says
Buys only. That was decided by the daily and the four hour, and the shorter charts do not get a vote.
The H4 ticket entered at 157.916 with 1.043 of risk. No targets reached. The stop still reads STOP LOSS at 156.873, exactly where it started, so full original risk is on the table.
Price is around 157.630, which is 0.286 below the entry. On a buy, that means the trade is behind.
M15, M30 and H1 have all turned down against a BUY verdict, so none of them has produced a ticket.
This is what the indicator is showing, not a recommendation. Trading involves risk.
New to these reads? Here is how the panel works, explained step by step: How to Read the Direction Sniper Panel
The Question Everyone Is Asking This Morning
The dollar has been rising against the yen since early September, from under 153.20 up to a high around 159.13 on the twenty third.
Then it stopped and came back down. It reached roughly 156.37 last Monday, bounced, and is now trading near 157.63.
So which is it. Is this a pullback inside an uptrend that still has further to go, or is it the start of a reversal that takes the pair back toward 153?
Nobody knows. Anyone telling you they know is guessing with more confidence than the situation allows.
But there is a difference between not knowing the answer and having no way to think about it. The question has a structure, and that structure is the whole of this post.
Permission First
H4: UP. D1: UP.
Both gatekeepers agree, so permission runs in one direction. BUY.
Now read the row above.
M15: DOWN. M30: DOWN. H1: DOWN.
Every entry chart is pointing the other way.
The status line gives you the outcome in three words: Buy on H4.
One ticket, on the only timeframe that currently agrees with the direction granted above it. The other three are showing short term selling inside a larger uptrend, and because they disagree with the verdict they have produced nothing.
That split is exactly what a pullback looks like on a panel. The big charts still say up. The small charts say down. If this were a reversal, the big charts would have changed too.
H4 Trade Ticket
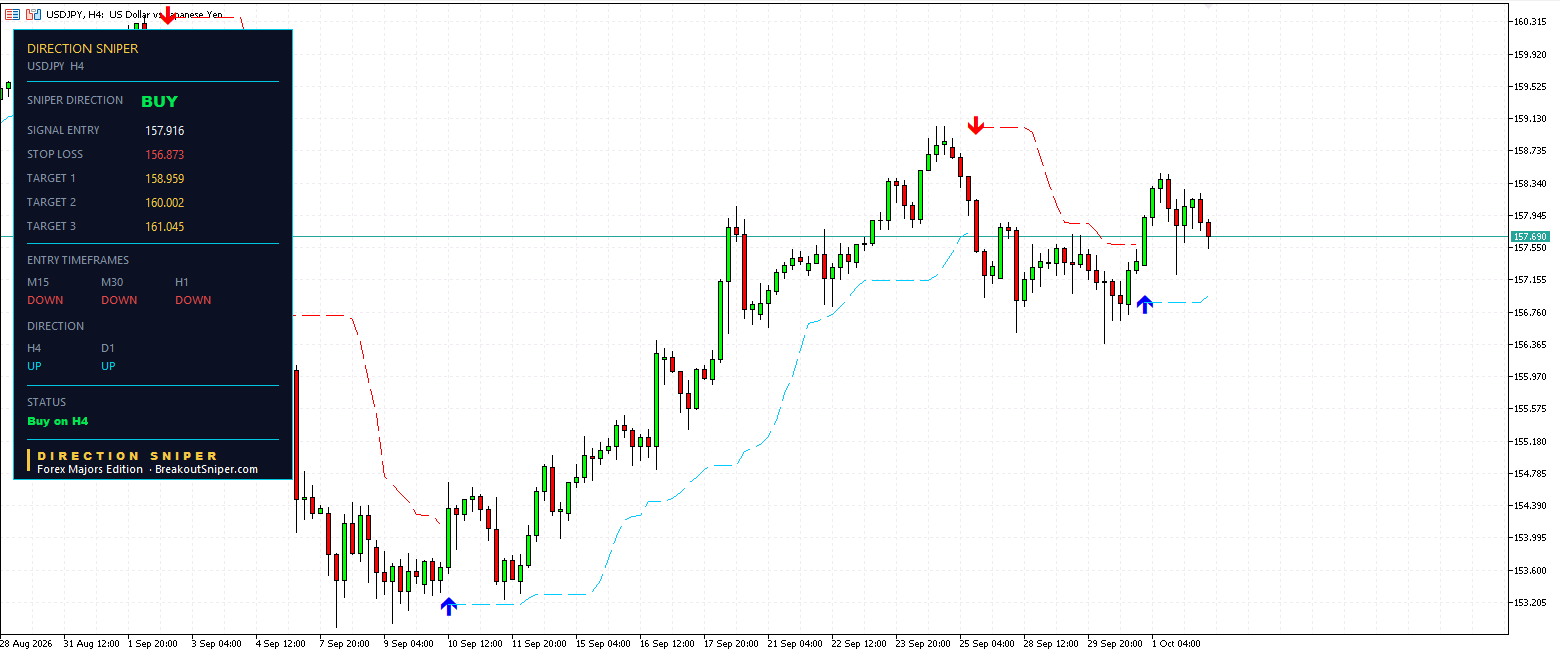
Signal entry 157.916. Stop loss 156.873.
Risk of 1.043, with every target built from that number.
Target 1 at 158.959, one times the risk.
Target 2 at 160.002, two times.
Target 3 at 161.045, three times.
No targets reached.
Read the stop label. It says STOP LOSS, not TRAILING STOP. The level sits exactly 1.043 below the entry, which is where it started. This trade has not moved far enough in its favour to earn a trail, and full original risk is still on the table.
Price is around 157.630, which is 0.286 below the entry. On a buy, that is behind.
Now notice something about where that stop sits.
The pullback low last Monday was around 156.37. The stop is at 156.873, roughly half a point above it.
That is not the tool being clever. It is a consequence of how the stop is placed relative to the channel. But the practical result is worth understanding, and it leads directly into the next section.
How to Tell a Pullback From a Reversal
This is the most useful thing on this page, and you can run it by hand on any chart without any tool at all.
An uptrend is made of higher highs and higher lows. That is not a theory, it is the definition. As long as each push up goes above the last one, and each pullback stops above the last one, the trend is intact.
A pullback is a move down that respects that structure. A reversal is a move down that breaks it.
So the test has two parts, and you check them in order.
Part one. Has price broken below the last swing low?
On USD JPY the last meaningful swing low is around 156.37, from last Monday. While price holds above that, the series of higher lows is intact and what you are looking at is a pullback, however uncomfortable it feels.
Part two. If it has broken below, does it then fail to make a new high?
A single break can be a stop hunt. What confirms a reversal is price breaking the low and then rallying into a lower high rather than a higher one. Two events, in that order.
Until both have happened, the uptrend is still an uptrend having a bad week.
Why this matters more than any indicator
Most traders try to answer this question with tools. They add an oscillator, see it oversold, and conclude the move is ending. Or they see a bearish candle on the fifteen minute and decide the trend has turned.
None of that touches the question. Structure is about where price has been, not about what a formula says about the last fourteen bars. A market making higher lows is in an uptrend whether or not your indicator likes it.
That is why the panel reads five timeframes instead of five indicators. The daily and the four hour are still reading up because the structure above has not broken. The fifteen minute reading down tells you about the last few hours, which is a different question.
What Would Change the Answer
Here is what to watch, in order.
While price holds above roughly 156.37, this is a pullback. The verdict stays BUY and the next tickets come from M15, M30 and H1 turning back up to rejoin it.
If price breaks below 156.37, the H4 ticket is already out, because its stop sits at 156.873, above that level. The trade exits before the structure question is even settled. That is not luck, that is what a stop placed under a trend is for.
If price then rallies and fails below 159.13, you have a lower high after a broken low, which is the definition of a reversal. At that point the four hour would be reading down, and once the daily follows, the verdict flips to SELL and the whole panel inverts.
Notice what is not on that list. No prediction about which happens. No target for a reversal. No opinion about the yen.
You do not need a view. You need two levels and the patience to see which one gets taken out first.
Why Three Charts Have No Ticket
M15, M30 and H1 are all showing DOWN while the verdict is BUY, so the panel has built nothing on any of them.
Think about what that protects you from this morning.
A trader watching only the fifteen minute sees the dollar falling against the yen. The thirty minute agrees. The one hour agrees. Three charts, all pointing down, all suggesting a short.
Every one of those signals is sitting inside a pullback within a three week uptrend, above a swing low that has not broken.
The panel does not need to make a judgement call. It asks in the right order. Permission first, timing second. Because the gatekeepers said buy, the sell signals underneath were never eligible.
Those three charts are not broken. They are waiting for the pullback to finish so they can join the direction that was already established.
The First BUY of the Series
One more thing, for anyone who has been reading these all week.
Every verdict published here since Monday has been SELL or NO TRADE. Gold, silver, the euro, the pound, the Australian dollar. Five days of selling and standing aside.
Today it says BUY.
A tool that only ever produces one kind of answer is not reading the market, it is expressing a bias, and eventually the market changes and the bias does not. The verdicts were sells because those markets were falling. This one is a buy because this market is rising. Same five timeframes, same rules, opposite answer.
One Thing Worth Knowing About This Pair
USD JPY carries a risk the other majors do not.
The yen is the one major currency where official intervention is a live possibility. When the yen weakens quickly, Japanese officials begin commenting on the pace of the move, and markets take those comments seriously because action has followed them before.
For a buy ticket that matters in two ways.
A comment or an intervention can move the pair further and faster than normal volatility, which means a stop may not fill where it sits.
And it can turn a trend without warning, which no indicator reads in advance. The panel reports what price has already done. It does not read headlines before they print.
That is not a reason to avoid the pair. It is a reason to size the position from the ticket’s own risk number and to accept that a stop is where the order rests, not a guarantee of the fill.
The Method in Brief
Five steps, the same every day, on every market.
One. The daily and four hour decide direction. They grant permission or they withhold it.
Two. Once a verdict exists, every shorter timeframe hunts only in that direction.
Three. When an entry timeframe agrees, the panel builds a complete ticket: entry, stop, and three targets at one, two and three times the risk.
Four. Size the position from the ticket’s own risk number, not from the timeframe.
Five. When the label changes to TRAILING STOP, the trade has passed its starting risk and the level manages itself from there.
That is the entire system. There is nothing else to learn.
Get the Same Panel on Your Charts
Everything on this page came off one screenshot, and every number on it was generated automatically.
The verdict. The permission rows. The entry price. A stop still sitting at its origin and labelled accordingly. Three targets calculated from the risk. And a status line telling you that only one of four timeframes currently has permission to act.
The structure test above is something you can run by hand, and you should learn to. The panel is what runs it for you on every pair, on every refresh, while you are doing something else.
One more thing, because today is the right day for it.
This ticket is behind its entry and carrying full original risk. It may reach 158.959. It may be stopped at 156.873. When either happens you will see it here with the same numbers and the same detail, because a record with no losses in it is not a record, it is marketing.
The reason a stop sits on every ticket is that some of them will be hit. That is the deal, and any tool that pretends otherwise is selling you something that does not exist.
Trading involves risk. Past performance does not guarantee future results. This post illustrates how the Direction Sniper indicator displays trades and is not a recommendation to trade. Nothing here is financial advice.

