Gold and Silver Price Forecast Today, 22 October 2026: Stopped Out By A Spike? Six Targets Reached On The Very Next Tickets
This gold and silver price forecast today is about the hour after a stop loss.
Late on 21 October gold spiked to around 4145. In one move it closed three gold tickets. A trader who was in those trades had a rough night.
But the 4 hour and the daily charts never turned, on gold or on silver. So the Direction Sniper panel did not change its verdict. It kept selling.
Four of the five tickets that printed after the spike have already reached at least one target. Six targets in total. Silver’s 15 minute reached all three. And the new gold ticket printed at almost exactly the same price as the ones the spike had just closed.
Here is the whole board, both metals, the good and the bad.
1. Silver: All Three Targets On The 15 Minute
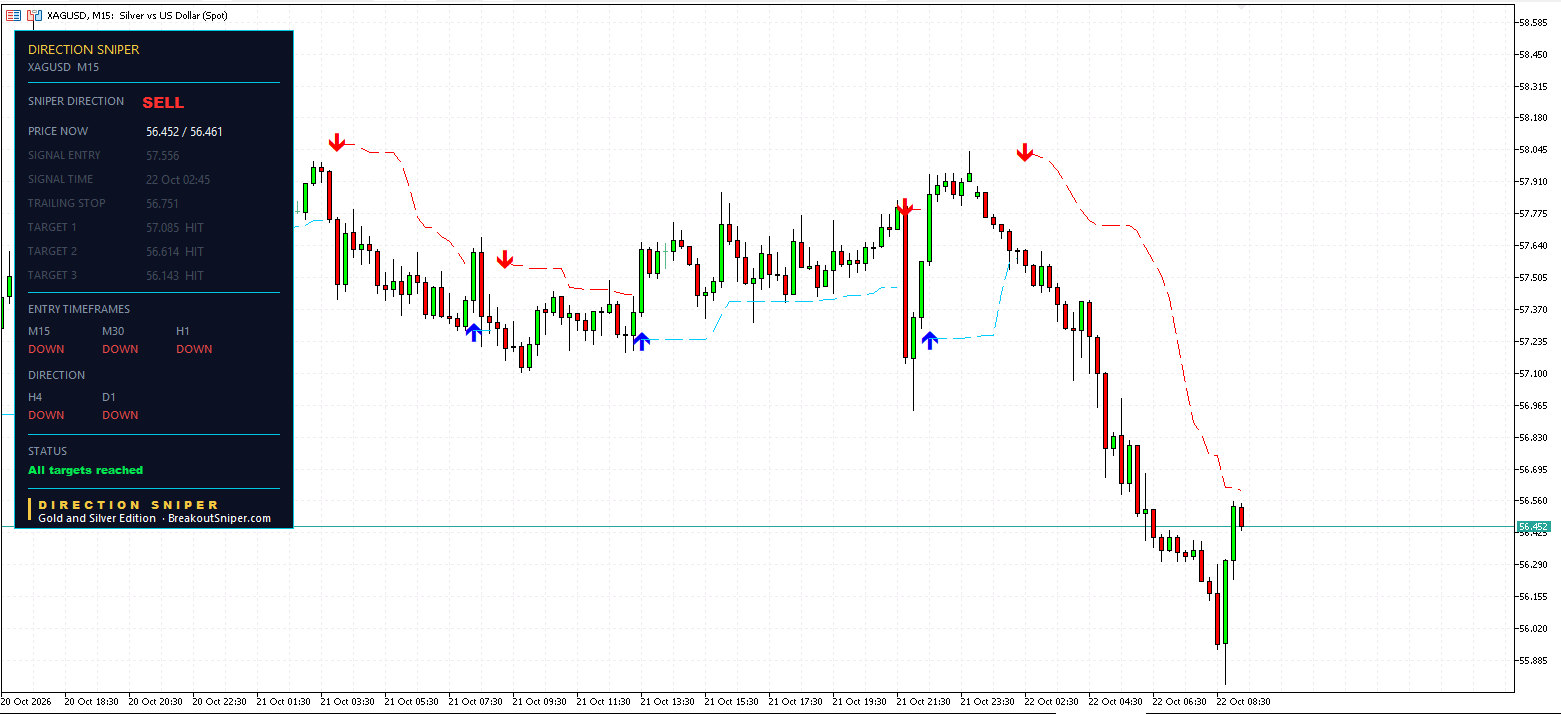
Silver ran up to around 58.0 late on 21 October. Then the panel lined up.
At 02:45 on 22 October the 15 minute printed a sell at 57.556, with the stop marked 0.471 above.
- Target 1 at 57.085: reached
- Target 2 at 56.614: reached
- Target 3 at 56.143: reached
Status: All targets reached. Its trailing level finished at 56.751, which is 0.805 in front of the entry.
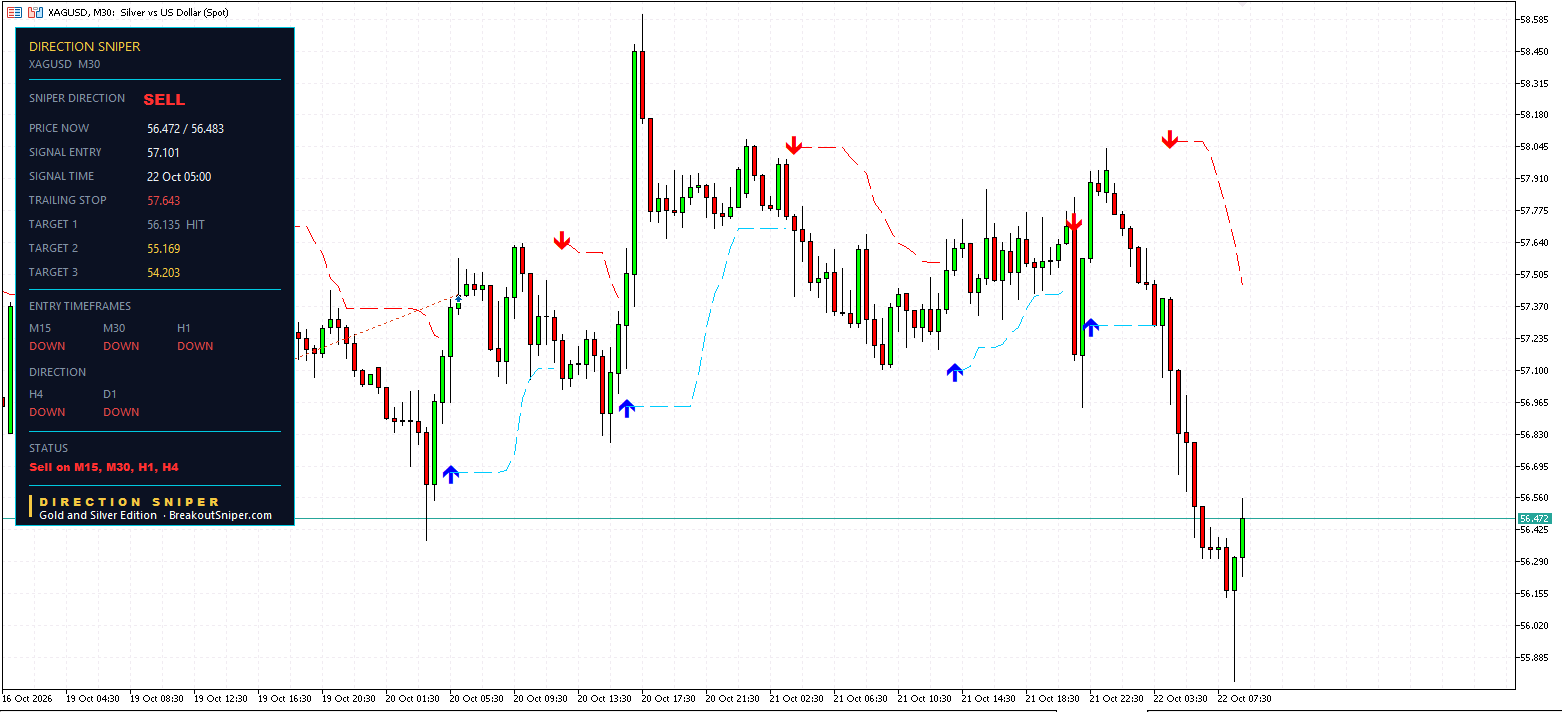
Two more silver tickets printed together at 05:00, both at 57.101:
| Chart | Entry | Stop | Risk | Targets | State |
|---|---|---|---|---|---|
| M30 | 57.101 | 58.067 | 0.966 | 56.135 reached, 55.169, 54.203 | Running, trail 57.643 |
| H1 | 57.101 | 57.981 | 0.880 | 56.221 reached, 55.341, 54.462 | Running, label still STOP LOSS |
Both reached Target 1. Silver went on to dip to around 55.85, more than two dollars below the high of the night.
2. Gold: Sold Again At The Same Price, And Target 1 Reached
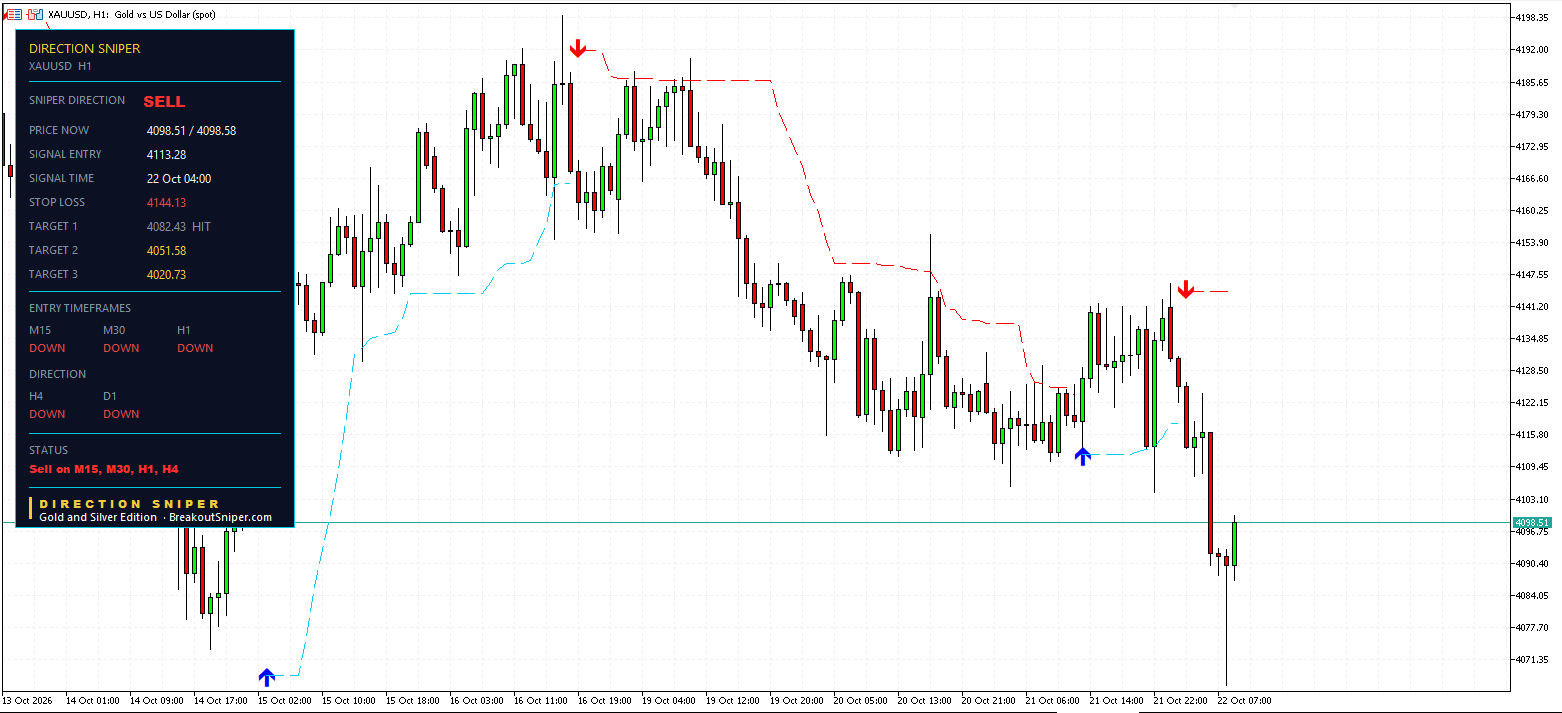
At 04:00 on 22 October the gold 1 hour printed a sell at 4113.28, with the stop marked 30.85 above at 4144.13.
- Target 1 at 4082.43: reached
- Target 2 at 4051.58
- Target 3 at 4020.73
Gold went on to dip to around 4067, about 78 below the spike high.
Now look closely at that entry price. 4113.28. The two gold tickets the spike had closed a few hours earlier both had their entry at 4113.44. The panel sold again within 16 cents of the same level.
That is the part most traders never see. After a stop out, they are either too shaken to look, or too angry to wait. The second entry came at the same price, and it was the one that reached its target.
3. The Spike That Came First
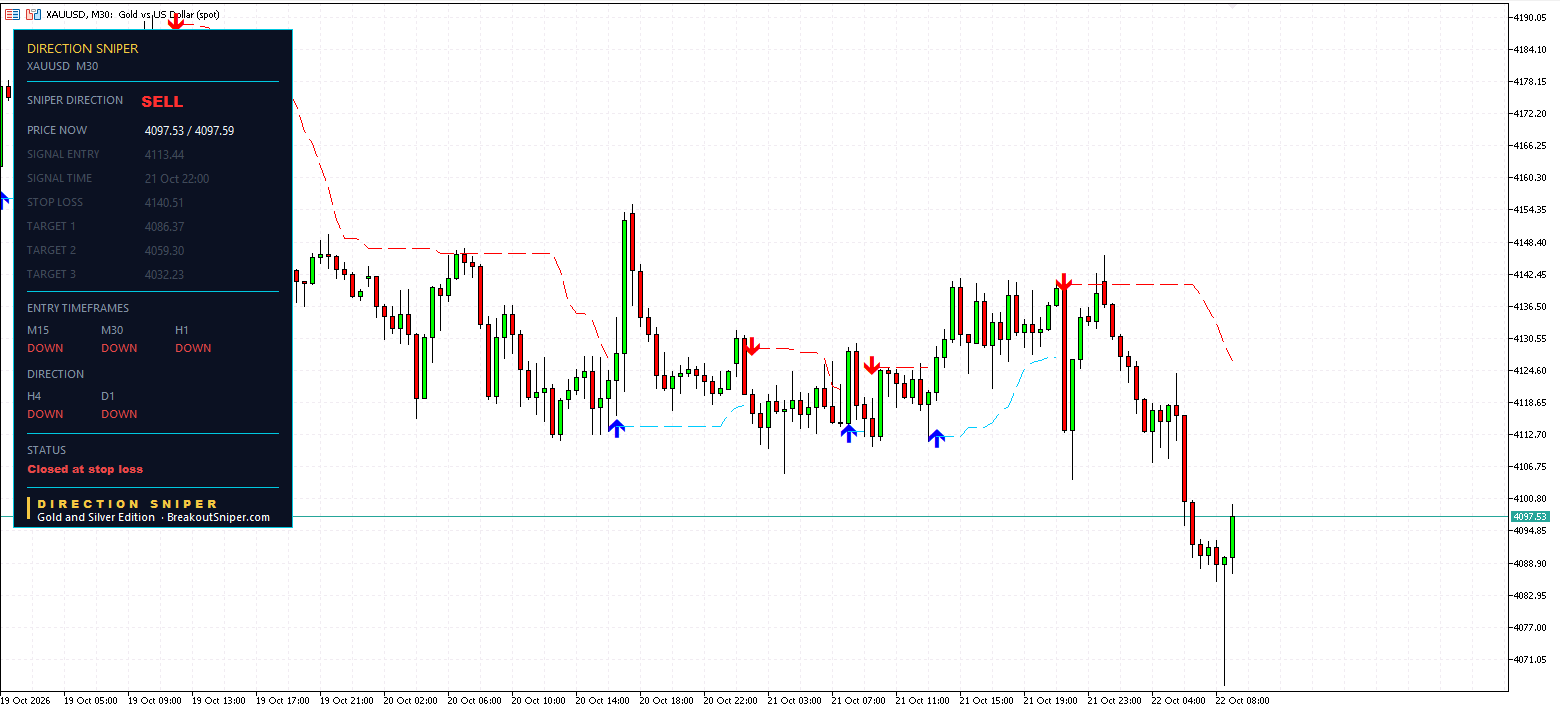
Now the tickets that did not work. We publish these too.
At 22:00 on 21 October the gold 15 minute and 30 minute both printed sells at 4113.44.
| Chart | Entry | Stop | Risk | Target 1 | State |
|---|---|---|---|---|---|
| M30 | 4113.44 | 4140.51 | 27.07 | 4086.37 | Closed at stop loss |
| M15 | 4113.44 | 4140.66 | 27.22 | 4086.22 | Closed at stop loss |
Within the hour gold spiked to around 4145 and reached both stops. Both tickets closed at their full planned risk.
Then gold fell, and traded through the levels where both of their first targets had sat. Right about the direction. The room was not enough for the spike.
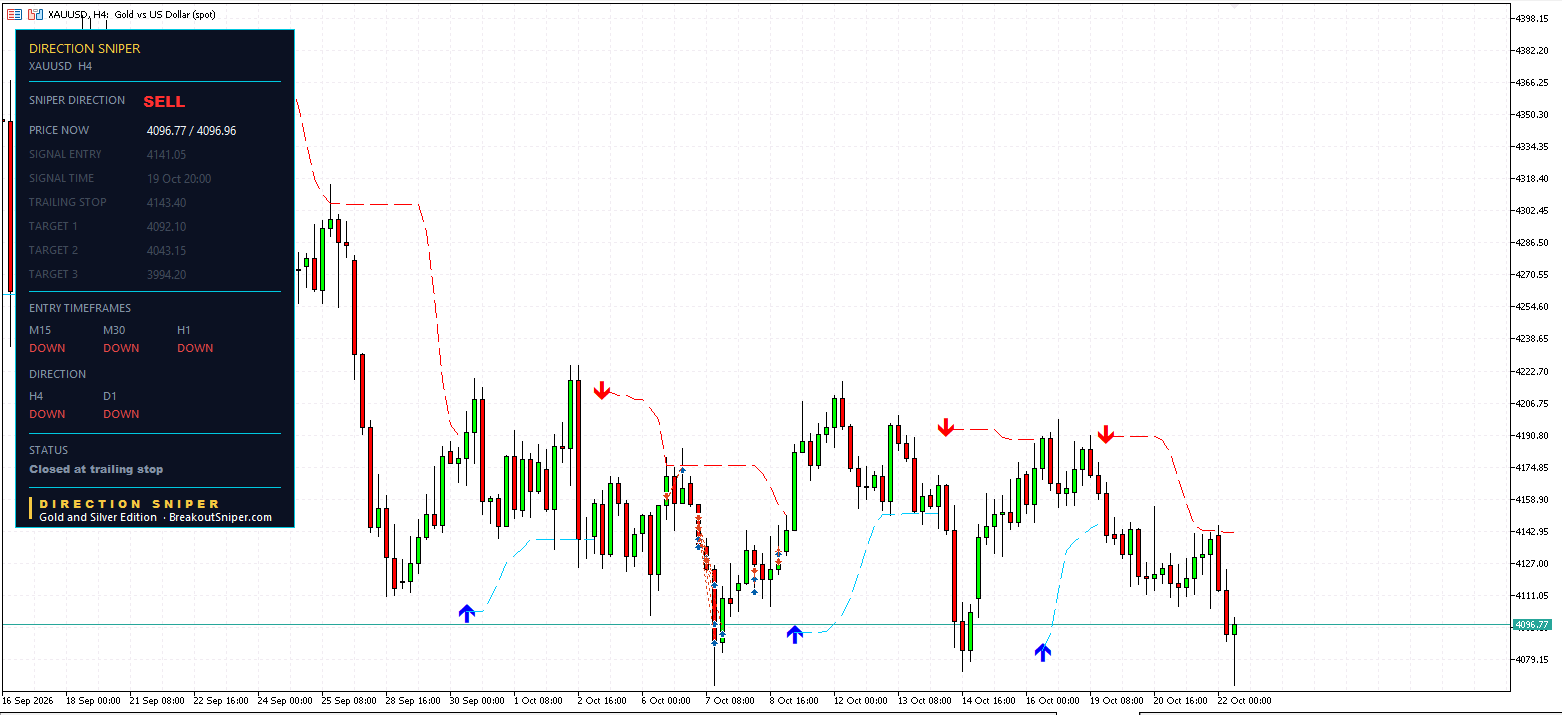
The same spike also closed the gold 4 hour sell from 19 October.
| Level | |
|---|---|
| Entry, sell | 4141.05 (19 Oct 20:00) |
| Original stop | 4190.00, so 48.95 of risk |
| Closed at trailing stop | 4143.40 |
This is where the trailing level earned its keep. By the time the spike arrived, the level had tightened from 4190.00 down to 4143.40. So the ticket closed just 2.35 behind its entry, instead of the full 48.95 it risked when it opened. About 95 percent of the planned loss never happened.
The old silver 4 hour sell from 13 October has also ended, and the panel has since printed a fresh 4 hour sell (section 5).
4. Why The Panel Kept Selling After The Spike
A spike feels like the market telling you that you were wrong. Most of the time, it is just a spike.
The question that matters after a stop out is not “how much did I lose”. It is “did the bigger picture change?”
On 22 October it did not. On both metals:
- The 4 hour read DOWN
- The daily read DOWN
- So the verdict stayed SELL
A spike that reaches a stop but leaves the 4 hour and the daily untouched has not changed the direction. So the panel did what it always does. It waited for a faster chart to line up with the verdict again, then printed the next ticket with a fresh stop.
A spike can take your stop. It cannot change the direction. When the verdict holds, the next ticket comes.
We covered the three steps for handling a stop out in detail in what to do after a stop loss.
5. What To Watch Next: The Fresh Silver 4 Hour, And The Bounce
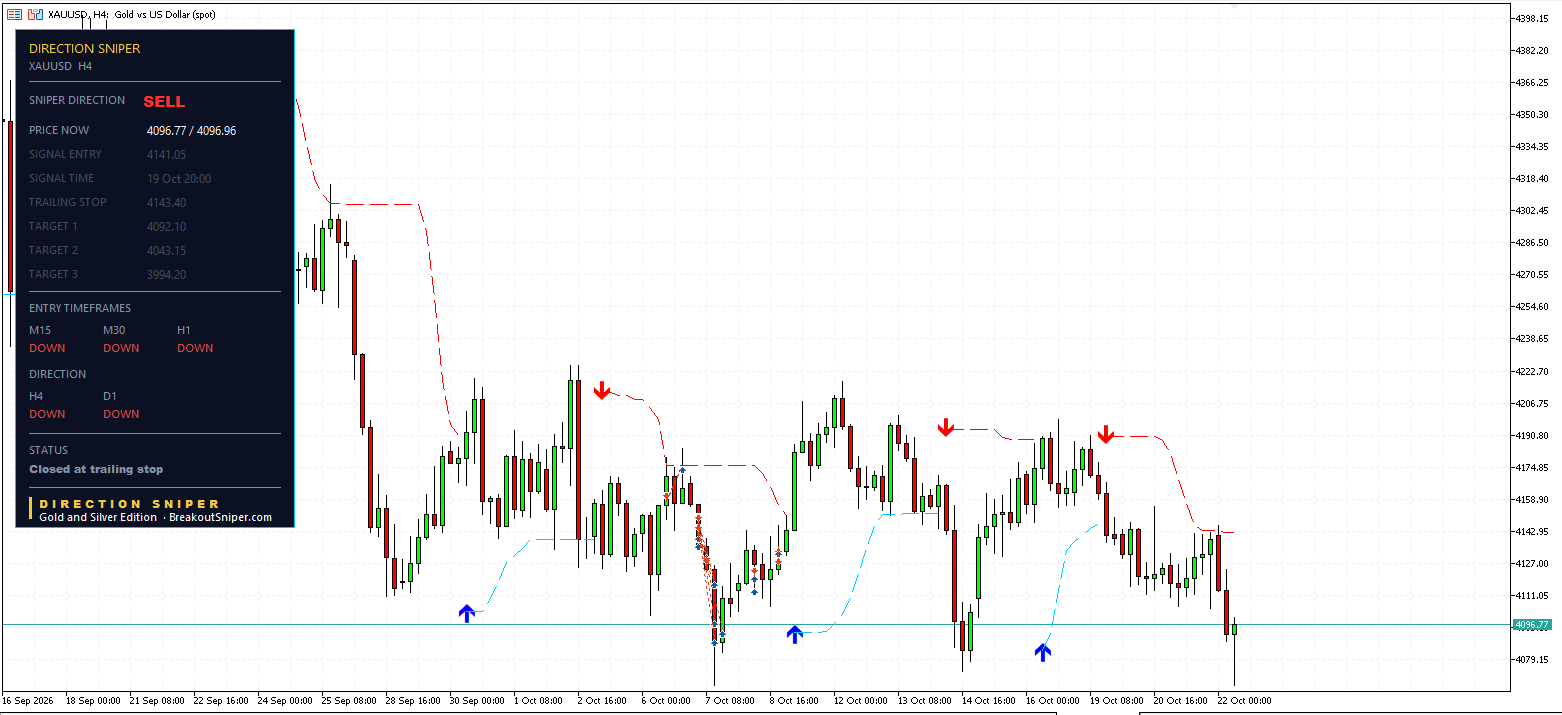
At 08:00 on 22 October silver printed a fresh 4 hour sell:
| Level | |
|---|---|
| Entry, sell | 56.349 |
| Stop | 58.056, so 1.707 of risk |
| Target 1 | 54.642 |
| Target 2 | 52.936 |
| Target 3 | 51.229 |
The status reads Sell on M15, M30, H1, H4. Every chart on silver is lined up.
Right now both metals are bouncing. Gold has rallied about 30 from its low to around 4098. Silver has come back to around 56.45, about 0.1 above the new 4 hour entry.
Here is how to read that. A bounce turns the fast charts first. A reversal turns the big ones. At the time of writing, every fast chart on both metals still reads DOWN. If the bounce grows, the 15 minute will be the first to turn. If the 4 hour turns UP while the daily stays DOWN, the verdict moves to NO TRADE and the panel stops looking for sells.
The levels that matter:
- Gold: the 1 hour stop at 4144.13, right where the spike topped out
- Silver: the 30 minute trailing stop at 57.643, and the 4 hour stop at 58.056
- Silver’s next targets: 55.341 on the 1 hour, 55.169 on the 30 minute, 54.642 on the 4 hour
Nobody knows which comes first. The panel gives you the map.
6. The Silver Ticket That Needs Less Than The Minimum Lot
Today’s board has one sizing lesson most traders never think about.
Silver trades in lots of 5,000 ounces, so a $1 move is worth about $5,000 per standard lot. Gold trades in lots of 100 ounces, so a $1 move is worth about $100 per lot.
At 0.5 percent of a $10,000 account, which is $50 of risk:
| Ticket | Stop distance | Lot size for $50 of risk |
|---|---|---|
| Gold H1 | 30.85 | about 0.016 lots |
| Silver M15 | 0.471 | about 0.021 lots |
| Silver M30 | 0.966 | about 0.010 lots |
| Silver H4 | 1.707 | about 0.006 lots |
Look at the silver 4 hour. It needs about 0.006 lots, which is below the 0.01 minimum at most brokers. A trader who takes 0.01 lots anyway is risking about $85, which is 0.85 percent of the account, not 0.5. On a $5,000 account the same 0.01 lots would be 1.7 percent.
That is how traders end up risking more than they planned without noticing. The fix is a cent account, where lots are measured in hundredths of a standard lot, so 0.006 lots becomes 0.6 cent lots and the right size is possible. For smaller balances we recommend a RoboForex Cent account or an XM Micro account. These are partner links, so we may receive a commission at no cost to you.
We risk at most 2 percent per trade, usually 0.5 percent. If you are worrying about every trade, your lot size is still too big.
After The Spike, The Next Ticket
Put the night together.
A spike closed three gold tickets. Most traders would have walked away, or jumped back in angry at the first price they saw. Direction Sniper did neither. It checked the 4 hour and the daily, found the direction unchanged, and waited for the next alignment.
Then it sold again, at almost the same price on gold, and across three charts on silver. Six targets reached on the very next tickets.
The Direction Sniper Gold and Silver Edition puts this exact panel on XAUUSD and XAGUSD:
- Direction. One verdict from the 4 hour and the daily. Through the spike it never stopped saying SELL, so you know the direction did not change even when your stop was hit.
- Rallies that have not broken structure. A spike or a bounce turns the fast charts first. The panel tells you whether the big charts have turned too, so you do not mistake a spike for a reversal.
- The stop loss. Every ticket arrives with its stop marked, and the trailing level tightens behind the trade. On the gold 4 hour it turned a 48.95 risk into a 2.35 close when the spike came.
One licence, MT4 or MT5.
See the Gold and Silver Edition
Want a read like this in your inbox? Join The Daily Sniper Read, free, every trading day.
Gold and Silver Price Forecast Today: Frequently Asked Questions
What is the gold and silver price forecast today, 22 October 2026?
The Direction Sniper panel reads SELL on both gold and silver, because the 4 hour and the daily charts point down on both metals.
Every entry chart also reads DOWN, so the status shows Sell on M15, M30, H1, H4. At the time of writing gold was around 4098 and silver around 56.45, both bouncing from lows near 4067 and 55.85.
What should you do after a spike takes your stop loss?
Ask whether the bigger picture changed. On 22 October a spike to around 4145 closed three gold tickets, but the 4 hour and daily charts stayed DOWN on both metals, so the verdict stayed SELL.
The panel then waited for a faster chart to line up again. Four of the five tickets that printed after the spike reached at least one target, six targets in total. A spike can take your stop, but it cannot change the direction.
Why did Direction Sniper sell gold again at the same price after the stop loss?
The gold 15 minute and 30 minute sells at 4113.44 closed at their stops when the spike reached about 4145. Because the 4 hour and daily never turned, the panel kept looking for sells.
At 04:00 on 22 October the 1 hour printed a new sell at 4113.28, within 16 cents of the stopped entries, with a stop at 4144.13. It reached Target 1 at 4082.43. Price reaching a published target level is not the same as a realised result.
How did the silver 15 minute ticket reach all three targets?
At 02:45 on 22 October the silver 15 minute printed a sell at 57.556 with a stop 0.471 above. Silver then fell, and Target 1 at 57.085, Target 2 at 56.614 and Target 3 at 56.143 were all reached.
Its trailing level finished at 56.751, which is 0.805 in front of its entry.
How did the trailing stop help the gold 4 hour sell?
The gold 4 hour sell from 4141.05 on 19 October started with a stop at 4190.00, which is 48.95 of risk. By the time the spike came, the trailing level had tightened to 4143.40.
So the ticket closed at its trailing stop just 2.35 behind its entry, instead of the full 48.95. Direction Sniper calculates and shows the trailing level; the trader adjusts the order on the platform.
What are the levels to watch on gold and silver now?
Silver printed a fresh 4 hour sell at 56.349 on 22 October at 08:00, with a stop at 58.056 and targets at 54.642, 52.936 and 51.229. The silver 30 minute trailing stop sits at 57.643, and the gold 1 hour stop sits at 4144.13.
A bounce turns the fast charts first. If the 4 hour turned UP while the daily stayed DOWN, the verdict would move to NO TRADE and the panel would stop looking for sells.
What if the correct silver lot size is below the 0.01 minimum?
Silver lots are 5,000 ounces, so a $1 move is about $5,000 per standard lot. To risk $50 on the silver 4 hour ticket, with a 1.707 stop, needs about 0.006 lots, which is below the 0.01 minimum at most brokers. Taking 0.01 lots would risk about $85 instead.
A cent account measures lots in hundredths of a standard lot, so the right size becomes possible. We risk at most 2 percent per trade, usually 0.5 percent. These figures are arithmetic for illustration, not a recommendation about how much anyone should trade.
Disclaimer: This post reports what the Direction Sniper panel showed on gold and silver on 22 October 2026. It is educational analysis, not financial advice and not a trade signal service. The gold 1 hour and the silver 30 minute, 1 hour and 4 hour tickets were still open at the time of writing. Price reaching a published target level is not the same as a realised result, and passing a level where a closed ticket’s target sat is not a result for that ticket. Bounce, high and low levels are approximate readings from the chart. Lot sizes are arithmetic for illustration and are not a recommendation about how much anyone should trade. Gold and silver are volatile, trading carries risk, and you should only trade money you can afford to lose.

