
The gold and silver price forecast today: Direction Sniper shows both metals in a downtrend on the 4 hour and daily charts. On the H1 chart, both are bouncing against that trend, so we are watching for the sell signal that would bring the timeframes back in line. Readings as of 11 September 2026.
Gold Technical Analysis Today (XAUUSD)
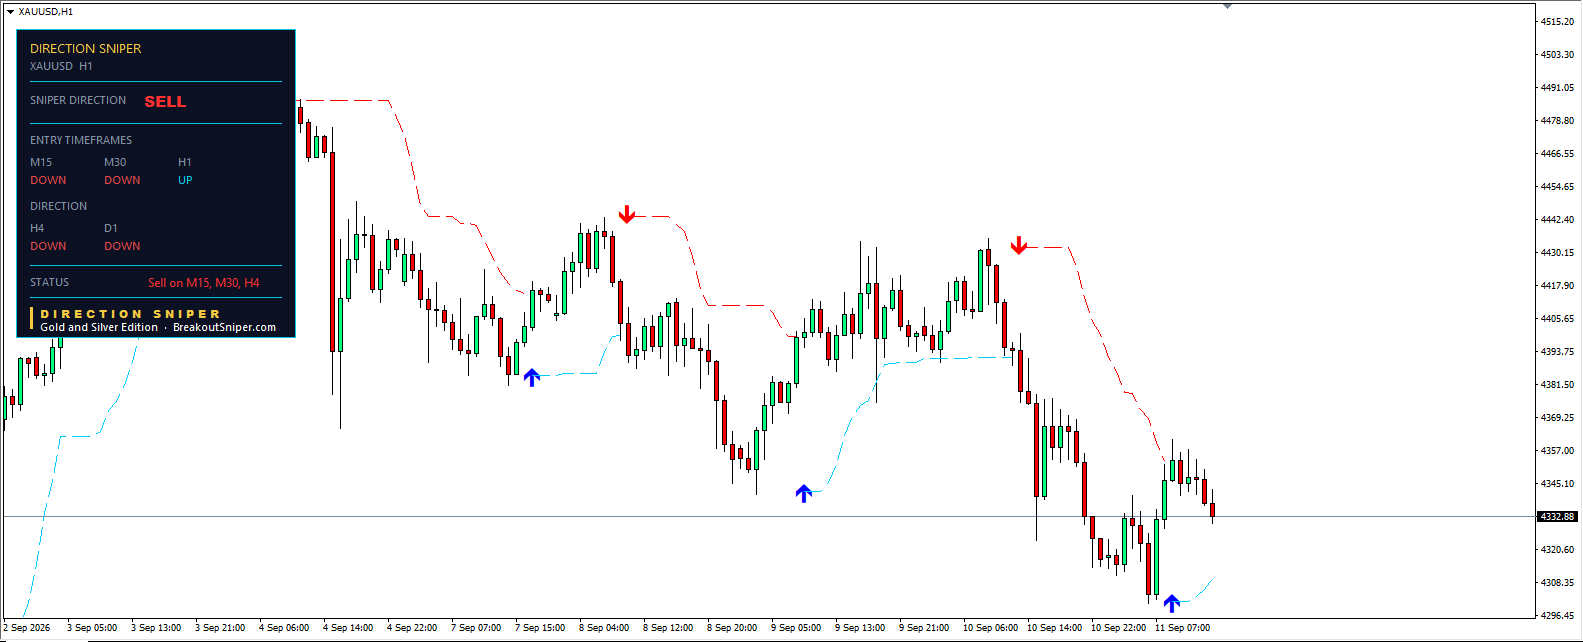
Direction Sniper shows gold in a downtrend. The H4 and daily both read DOWN, and the overall verdict is SELL.
With the direction set, we are on the H1 chart watching for Direction Sniper to print a red sell arrow in line with the trend. That signal isn’t there yet. After gold fell from around 4,430 on 10 September to near 4,300 overnight, the H1 printed a blue up arrow at the low. That arrow points against the direction, which is why the H1 reads UP while the H4 and daily read DOWN.
The bounce is already fading. Price stalled near 4,360 and is back at 4,332. The 15 minute and 30 minute have both turned DOWN, which is what the status line “Sell on M15, M30, H4” reports. The H1 is now the only timeframe still pointing up.
For context, the two earlier red arrows on this chart, on 8 September near 4,440 and 10 September near 4,430, both appeared at the top of a bounce during this move lower. Past signals do not guarantee future results.
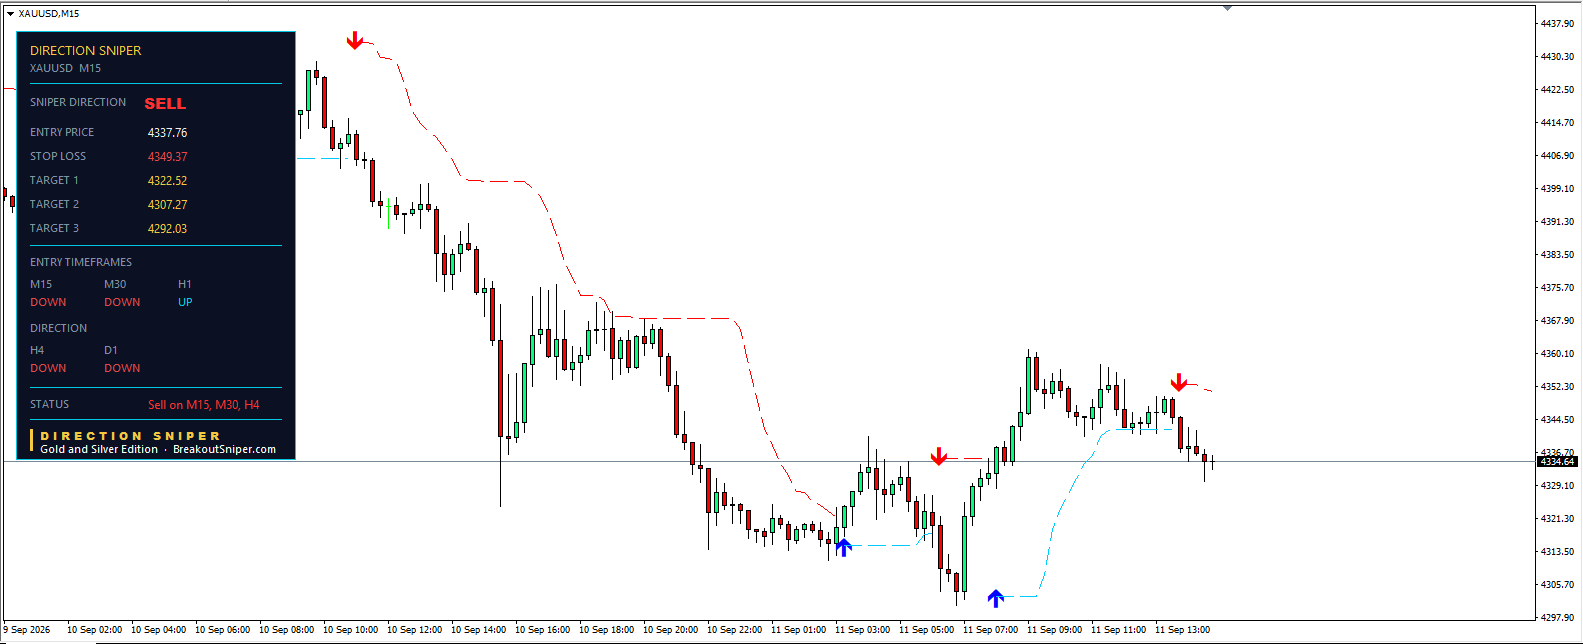
The Gold Trade Ticket on M15
On the 15 minute chart, Direction Sniper has printed a red sell arrow. The bounce toward 4,360 stalled, and the M15 turned down in line with the H4 and daily.
When an entry timeframe turns in the same direction as the H4 and daily, the panel generates a trade ticket automatically. The H4 and daily set the direction, and the entry timeframes decide the timing. The H1 hasn’t turned yet, but the M15 and M30 have, so the ticket appeared on the faster timeframe first.
This is what the panel displayed at the time of writing:
Entry price: 4,337.76
Stop loss: 4,349.37
Target 1: 4,322.52
Target 2: 4,307.27
Target 3: 4,292.03
The stop loss is not a fixed number. It is the red dashed line on the chart, and the indicator updates it every 15 minutes, with each new M15 candle. As price falls, the line steps lower and follows price from above. When price pauses, the line flattens. You can see this on the earlier part of the chart, where the red line after the 10 September arrow stepped down all the way from 4,430 as gold fell. So the stop loss figure above is a snapshot, and the panel will show a different number as the move develops.
Look at how the ticket was built when it printed. The stop sat about 11.6 above the entry, and the targets step down in equal distances of about 15.2. Target 1 is further from the entry than the stop, and Target 3 is roughly four times the stop distance, so the risk is defined before any trade is placed. At the time of writing, price is at 4,334.64, just below the entry.
Silver Price Forecast Today (XAGUSD)
Gold has already issued its M15 ticket. Silver shows the same downtrend, but its bounce is holding up better, so its timeframes are further from lining up.
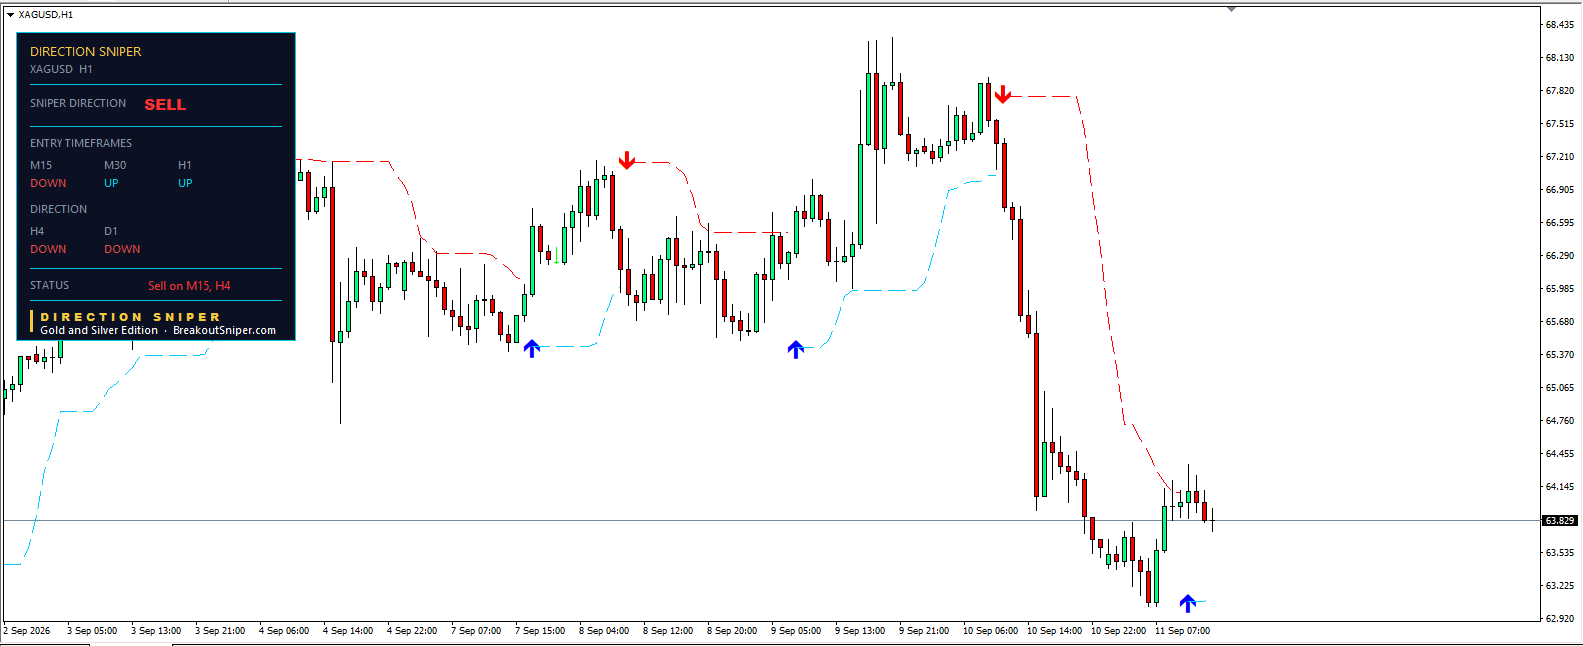
Direction Sniper shows silver in a downtrend. The H4 and daily both read DOWN, and the overall verdict is SELL.
Silver followed gold’s path on 10 September, dropping from about 67.80 to near 63.00, and the H1 printed a blue up arrow at the low. The difference shows up in the entry timeframes. On gold, only the H1 still points up. On silver, both the 30 minute and the H1 still read UP, and only the 15 minute has turned down, so the status line shows “Sell on M15, H4.” Price is at 63.83, holding above the overnight low.
So silver is a step behind gold. We are watching for the 30 minute and the H1 to turn back down before its timeframes line up the way gold’s have.
Silver Price Forecast Today (XAGUSD)
Silver has now issued an M15 ticket too, but with less agreement behind it than gold’s.
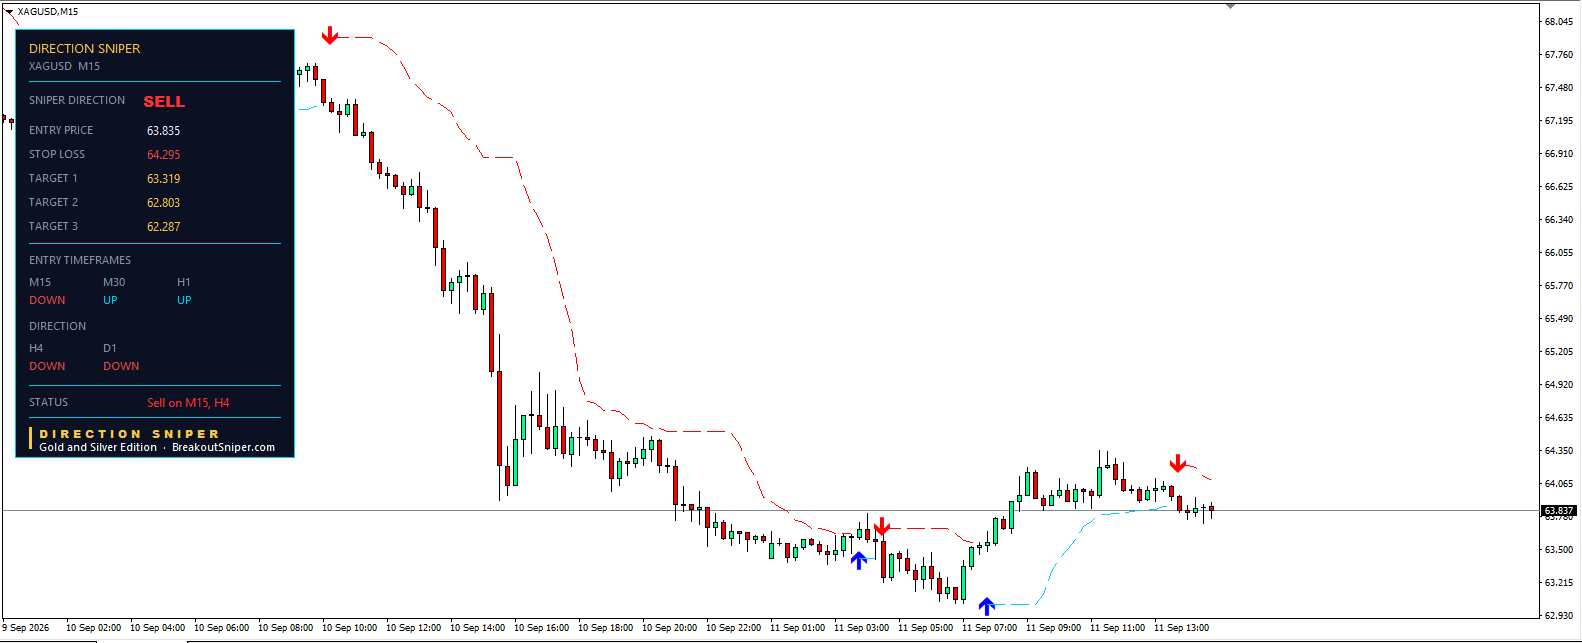
The Silver Trade Ticket on M15
On the 15 minute chart, Direction Sniper printed a red sell arrow as the bounce stalled near 64.10, and the M15 turned down in line with the H4 and daily. That’s what triggered the ticket.
This is what the panel displayed at the time of writing:
Entry price: 63.835
Stop loss: 64.295
Target 1: 63.319
Target 2: 62.803
Target 3: 62.287
As with gold, the stop loss is the red dashed line on the chart, and the indicator updates it every 15 minutes. You can see it at work on the left of this chart: after the red arrow near 68.00 on 10 September, the line stepped down all the way to around 63.70 as silver fell.
The ticket follows the same structure as gold’s. The stop sat about 0.46 above the entry, and the targets step down in equal distances of about 0.52. Target 1 is further from the entry than the stop, and Target 3 is roughly three and a half times the stop distance. At the time of writing, price is at 63.837, sitting right on the entry.
The difference from gold is what’s behind the ticket. On gold, the M15 and M30 both point down, and only the H1 points up. On silver, only the M15 has turned down, while the M30 and H1 still read UP, which is why the status line shows “Sell on M15, H4” only.
These levels are the indicator’s automatic output, shown to explain how the panel works. They are not a recommendation to buy or sell.
