Gold and Silver Price Forecast Today, 2 November 2026: Gold Fell So Far It Was Deeply Oversold. Why That Is A Reason To Wait, Not To Buy
This gold and silver price forecast today is about the most tempting moment on any chart: right after a big fall.
On Friday, gold dropped so hard that it ran far below the panel’s trailing line, the level that tracks the trend as it develops. The gold 1 hour sell reached all three of its targets. Silver’s 30 minute did the same. By any measure, both metals were deeply oversold.
And this morning, both are bouncing.
So is this the moment to buy the bounce? Or to sell more? The Direction Sniper panel says neither. Here is why, and what the next move needs to look like.
For the full board, including the US dollar picture and today’s three currency pairs, see today’s Currency Strength Today read.
1. The Board: Both Metals, Still SELL
| Market | Chart | Entry | Targets reached | Status |
|---|---|---|---|---|
| Gold | H4 | 4007.13 | 1 of 3 | Running |
| Gold | H1 | 4024.79 | 3 of 3 | All targets reached |
| Silver | H4 | 52.799 | 2 of 3 | Running |
| Chart | Gold | Silver |
|---|---|---|
| M15 | UP | UP |
| M30 | UP | UP |
| H1 | DOWN | UP |
| H4 | DOWN | DOWN |
| Daily | DOWN | DOWN |
The 4 hour and the daily read DOWN on both metals, so the direction is still SELL. But the faster charts have turned UP on the bounce. On gold, the status reads Sell on H1, H4. On silver, all three entry charts are UP, so it reads Sell on H4 only.
2. The Gold 1 Hour: A Ticket That Finished Its Job
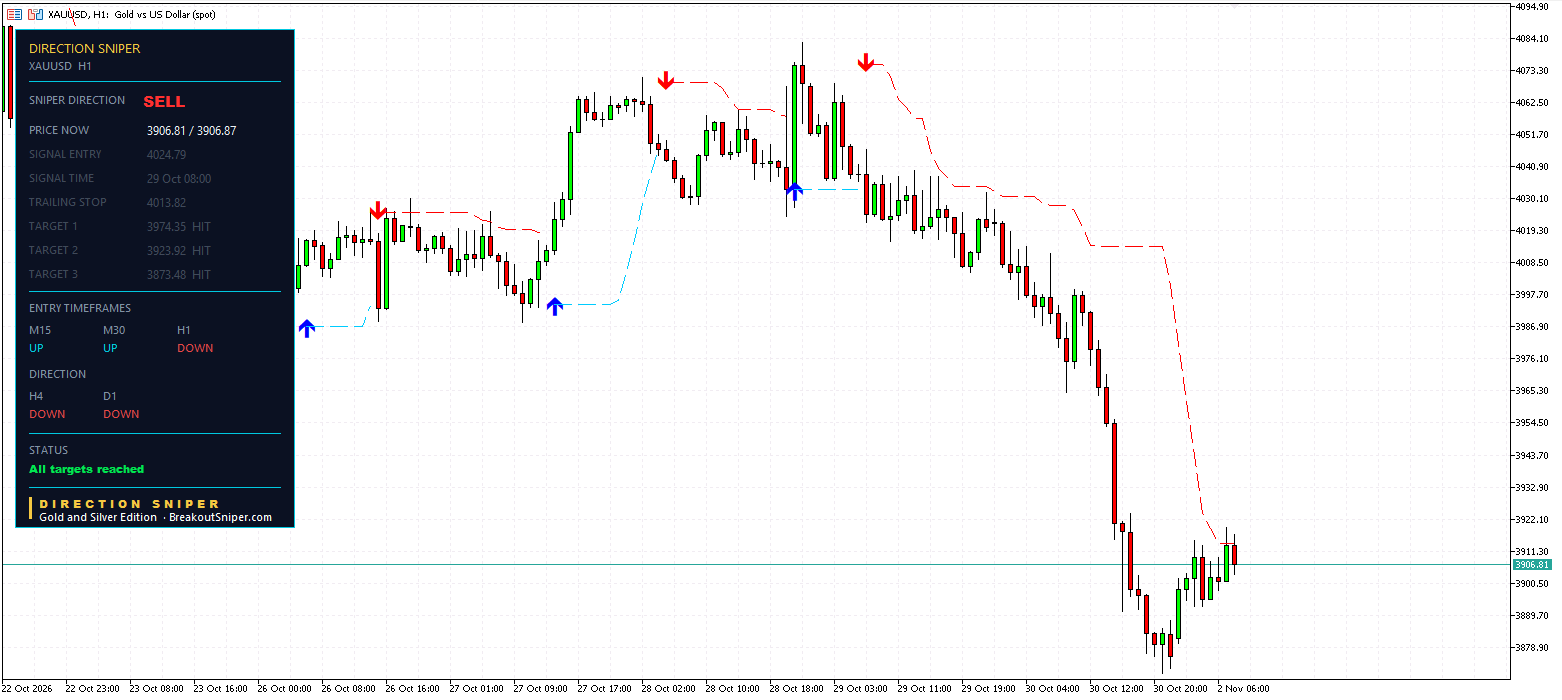
The 1 hour sell printed on 29 October at 08:00 at 4024.79. Over Thursday and Friday, gold fell through every target:
- Target 1: 3974.35, reached
- Target 2: 3923.92, reached
- Target 3: 3873.48, reached
That is a move of 151.31 points from the entry to the last target. Gold bottomed around 3,875 on Friday, right next to Target 3.
Now look at where price was against the panel’s trailing line at that moment. The line was still up around 4,013. Price was down near 3,875, close to 140 points below it.
That gap is what oversold looks like. Price had run so far, so fast, that it left the trend line far behind.
3. The Rubber Band Snapped Back
Picture a rubber band. Stretch it far enough and it does not stay stretched. It snaps back part of the way.
That is exactly what happened this morning. Gold bounced from around 3,875 to 3906.81, and the trailing line came down to meet it. The gap that was close to 140 points on Friday has shrunk to roughly 10 points, read from the chart, with the line now sitting just above price.
This is the part most traders get wrong, in one of two ways.
Mistake 1: Buying Because It Is Oversold
“It has fallen 150 points, it must be due a bounce.” Maybe. But the 4 hour and the daily still read DOWN. A deeply oversold market in a downtrend can stay oversold and keep falling. Fallen a lot is not the same as turned.
Mistake 2: Selling At The Bottom
“Gold is falling, I need to get in.” But selling right at the low means your stop has to sit far above, at the trailing line, for a target that has mostly been reached already. That is chasing an old ticket, the most expensive mistake in our guide on how to trade currency strength.
What The Panel Does Instead: It Waits
Think of a sprinter who has just run flat out. They are still in the race, still heading the same way. But they need to catch their breath before the next sprint.
The panel waits for that breath. The next gold sell ticket only prints when the bounce runs out and the faster charts turn back DOWN, much closer to the trailing line than Friday’s low. That is selling into strength: letting the market come back to you instead of chasing it.
4. Gold Technical Analysis Today: The 4 Hour
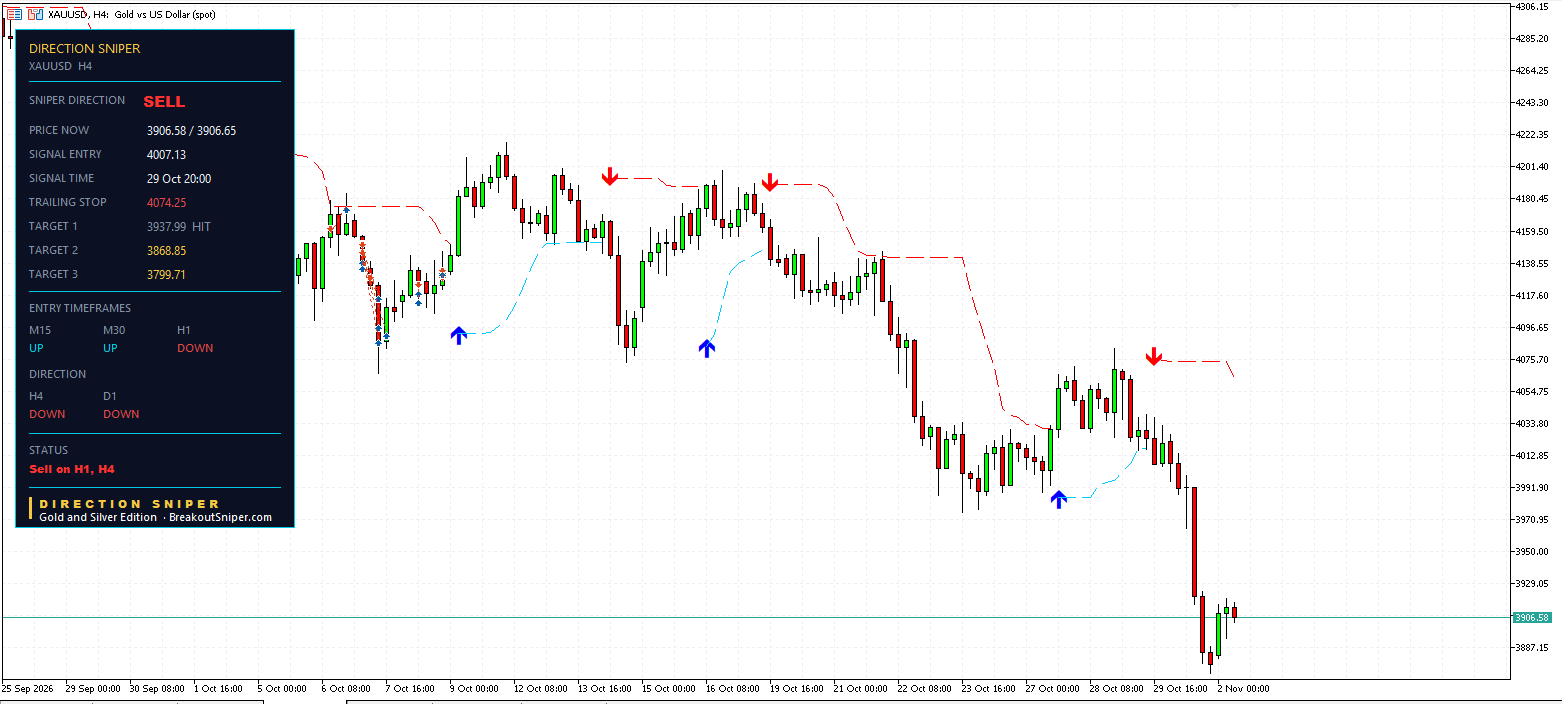
The bigger picture has not changed. On the 4 hour chart, gold spent early October between roughly 4100 and 4215, broke lower on 21 and 22 October, bounced to around 4080 on 28 October, then fell hard into Friday.
The 4 hour sell printed on 29 October at 20:00 at 4007.13. Gold is now 3906.58, about 100 points below the entry.
- Trailing stop: 4074.25
- Target 1: 3937.99, reached
- Target 2: 3868.85
- Target 3: 3799.71
The 1 hour still reads DOWN alongside the 4 hour and the daily. Only the 15 and 30 minute have turned up on the bounce. We explain how the 4 hour and the daily decide gold’s direction in our guide to multi timeframe analysis for gold.
5. Silver Price Forecast Today
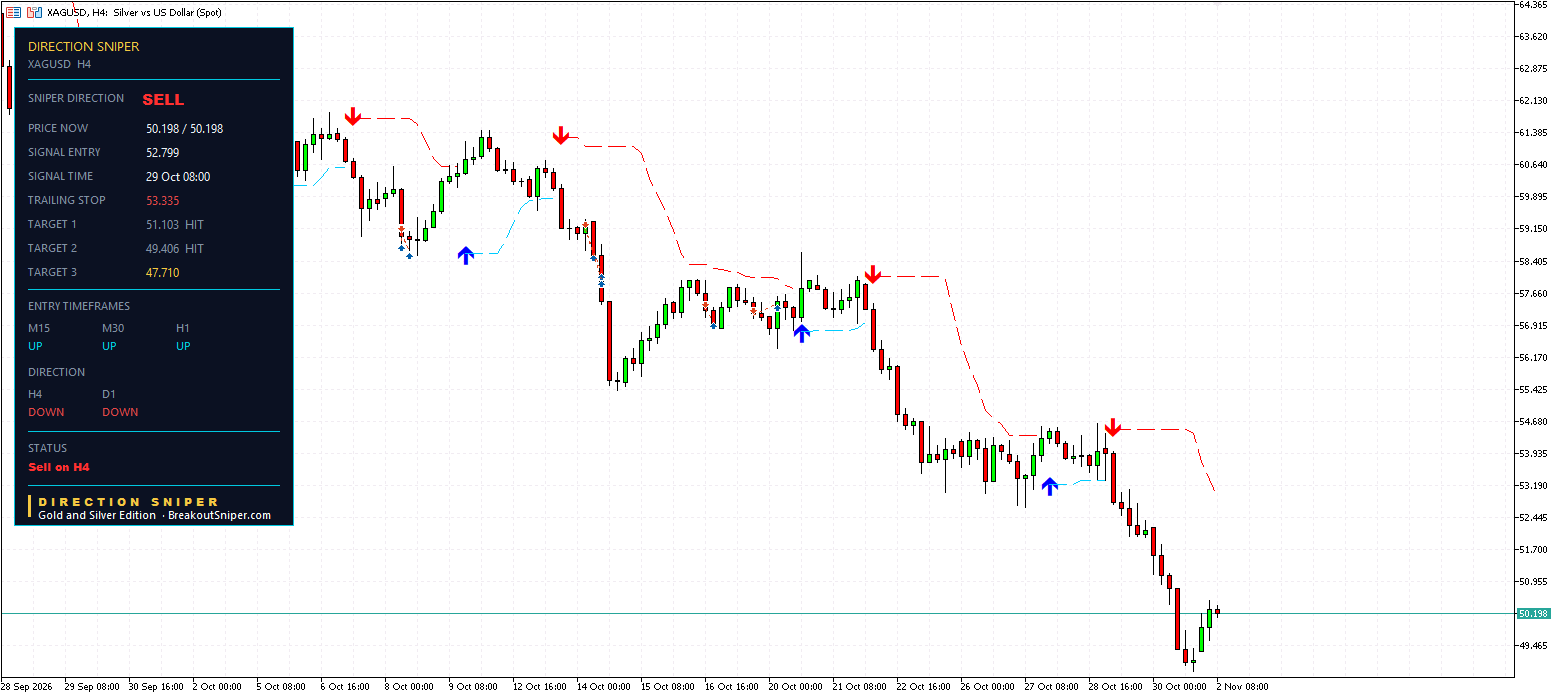
Silver tells the same story, a little further along.
The 4 hour sell from 52.799 has reached Target 1 at 51.103 and Target 2 at 49.406. Silver bottomed near 49.30 on Friday and has bounced to 50.198.
And the stop keeps moving. On Friday it was still at its original level of 54.495. This morning it had trailed to 53.734. Now it sits at 53.335, just 53.6 cents behind the entry.
- Trailing stop: 53.335
- Target 3: 47.710, still open
All three of silver’s entry charts have turned UP on the bounce, so the status reads Sell on H4 only. Like gold, the direction is SELL, and the panel is waiting for the fast charts to turn back DOWN before the next entry.
6. What This Means For The US Dollar
In today’s Currency Strength Today read, the US dollar is the weakest currency on the board for the second trading day in a row, weaker than six of the seven currencies it trades against.
Normally, a weak dollar lifts gold. It has not. Gold fell anyway, and even after this morning’s bounce, its bigger charts still read SELL. That is why our US Dollar Today verdict stays MIXED.
The lesson from last week still holds: trade gold on its own trend, not on a rule of thumb about the dollar.
7. Which Ticket Still Makes Sense Today?
| Ticket | Distance to its stop | Distance to its next target |
|---|---|---|
| Gold H4 | 167.67 points | 37.73 points to Target 2 |
| Silver H4 | $3.137 | $2.488 to Target 3 |
Distances are from gold at 3906.58 and silver at 50.198.
Neither of these is a ticket to start today. The gold 4 hour would need a stop more than 160 points away to reach a target under 40 points away. Silver’s stop is further from price than its last target.
Both are tickets to manage. For a fresh entry, the panel is waiting for the next sell ticket on the faster charts.
These are the markets we are watching, not trade recommendations.
8. Same Risk, Smaller Lot
We risk at most 2 percent per trade, usually 0.5 percent, so on a $10,000 account that is $50.
On most platforms, one standard lot of gold is 100 ounces, so a 1 point move is $100 per lot. From today’s price, the gold 4 hour stop is 167.67 points away. $50 of risk on that stop is about 0.003 lots, far smaller than most standard accounts allow.
That is not a reason to round up. It is a reason the next ticket, with a stop much closer to price, will be the better trade. Here is how to calculate lot size for gold from any stop, or work it out in seconds with our free Gold and Silver Lot Size Calculator.
On a small account, a cent account makes the right sizes possible. For small balances we recommend a RoboForex Cent account or an XM Micro account. These are partner links, so we may receive a commission at no cost to you.
Lot size is the seatbelt. It does not stop the crash. It decides how badly you get hurt. If you are worrying about every trade, your lot size is still too big.
9. What Would Change The Picture
What would bring the next sell: the bounce running out, and the 15 and 30 minute turning back DOWN to join the bigger charts.
What would change the verdict: the 4 hour turning UP. If it did while the daily stayed DOWN, the panel would move to NO TRADE and stand aside.
Levels to watch, read from the chart:
- Gold: Friday’s low around 3,875, and the 4 hour Target 2 at 3868.85
- Gold: the 28 October high around 4,080
- Silver: Friday’s low near 49.30, and the 4 hour trailing stop at 53.335
Right Direction, Right Moment
Put the board together.
Gold fell so far on Friday that it was deeply oversold, and this morning’s bounce snapped it back toward the trailing line. The gold 1 hour reached all three targets. Silver’s 4 hour has reached two, with its stop trailing closer every day. And the 4 hour and the daily still read DOWN on both metals.
That is Direction Sniper:
- Direction. One verdict from the 4 hour and the daily. On both metals today, it still reads SELL.
- Rallies and bounces that have not broken structure. This morning’s bounce turned the fast charts UP. It did not turn the verdict.
- The stop loss. Every ticket arrives with its stop and three targets marked, and silver’s trailing stop has moved closer to the entry twice since Friday.
The Direction Sniper Gold and Silver Edition puts this panel on XAUUSD and XAGUSD, on MT4 or MT5.
See the Gold and Silver Edition
Today’s other reads: the full board in Currency Strength Today, and our Pick of the Day in the NZD CHF forecast, where every timeframe reads DOWN.
Want a read like this in your inbox? Join The Daily Sniper Read, free, every trading day.
Gold and Silver Price Forecast Today: Frequently Asked Questions
Updated 2 November 2026. Levels are as shown on the Direction Sniper panel at the time of writing.
1What is the gold and silver price forecast today, 2 November 2026?+
The Direction Sniper panel still reads SELL on both gold and silver, because the 4 hour and the daily both read DOWN.
Both metals are bouncing this morning, so the faster charts have turned UP. Gold was around 3906.58 and silver around 50.198 at the time of writing.
2Is gold oversold?+
On Friday it was. Gold fell to around 3,875, close to 140 points below the panel’s trailing line, after the 1 hour sell reached all three targets.
This morning’s bounce has brought price back close to that line. Oversold is a reason to wait for the next entry, not a reason to buy.
3Should I buy gold because it is oversold?+
Not on the panel. The 4 hour and the daily still read DOWN, and a deeply oversold market in a downtrend can stay oversold and keep falling.
Fallen a lot is not the same as turned. The verdict would only change if the 4 hour turned UP.
4Which gold targets have been reached?+
The gold 1 hour sell from 4024.79 reached all three targets, down to 3873.48. The gold 4 hour sell from 4007.13 has reached Target 1 at 3937.99.
Price reaching a published target level is not the same as a realised result. It does not describe anyone’s trade.
5Where is the silver stop now?+
The silver 4 hour sell from 52.799 has reached Targets 1 and 2, and its trailing stop level has moved down to 53.335, about 53.6 cents behind the entry.
Direction Sniper shows the trailing stop level. The trader moves their own stop order to match it.
6When will the next gold sell ticket print?+
The panel prints a new sell ticket when the bounce runs out and the faster charts turn back DOWN to join the 4 hour and the daily.
That usually happens much closer to the trailing line than the low of the fall, which is what selling into strength means.
7Why is gold falling when the US dollar is weak?+
On 2 November 2026 the US dollar is the weakest currency on our board, yet gold still reads SELL on its bigger charts. That is why our US Dollar Today verdict is MIXED.
Direction Sniper does not read news or rules of thumb. It reads the trend on the 4 hour and the daily, and on gold both read DOWN.
8What lot size should I use on gold?+
We risk at most 2 percent per trade, usually 0.5 percent, which is $50 on a $10,000 account. With gold at $100 per point per standard lot, a 167.67 point stop is about 0.003 lots.
Use the Gold and Silver Lot Size Calculator and check your contract size. These figures are arithmetic for illustration, not a recommendation about how much anyone should trade.
DIRECTION SNIPER GOLD AND SILVER EDITION
See gold and silver the moment a ticket prints.
Direction, entry, stop and three targets on XAUUSD and XAGUSD. MT4 or MT5.
Disclaimer: This post reports what the Direction Sniper panel showed on XAUUSD and XAGUSD on 2 November 2026. The tickets were running at the time of writing, and prices will have moved by the time you read this. It is educational analysis, not financial advice and not a trade signal service, and nothing here is a recommendation to buy or sell. Price reaching a published target level is not the same as a realised result. A target shown as reached means price touched that level on the chart, and does not describe anyone’s trade. High and low levels are approximate readings from the chart. Contract sizes and lot sizes are arithmetic for illustration, vary by broker, and are not a recommendation about how much anyone should trade. Trading gold and silver carries risk, and you should only trade money you can afford to lose.

