NZD CHF Forecast Today, 2 November 2026: Four Sell Tickets And Every Chart Pointing Down. Which One Still Has Room?
This NZD CHF forecast today is about a quiet pair having a very clear day.
NZDCHF does not make headlines. It is not EURUSD or gold. But this morning it is the only one of our candidates that passes every check we run, and in today’s currency strength today read it is our Pick of the Day.
On one side is the Swiss franc, one of the three strongest currencies on the board. On the other is the New Zealand dollar, one of the three weakest. Think of a tug of war where one team has been pulling steadily for a week and the other keeps losing its footing.
The Direction Sniper panel agrees. Every timeframe reads DOWN, from the 15 minute to the daily, and all four entry charts have a sell ticket on the board. Two of them have already reached Target 1.
So which one still makes sense from where price is now? Here is what each chart shows.
1. The Board: Four Tickets, One Direction
| Chart | Entry | Signal time | Risk | Targets reached | Status |
|---|---|---|---|---|---|
| H4 | 0.46590 | 28 Oct 04:00 | 65.7 pips | 0 of 3 | Running |
| H1 | 0.46317 | 2 Nov 01:00 | 14.3 pips | 0 of 3 | Running |
| M30 | 0.46354 | 30 Oct 23:00 | 12.9 pips | 1 of 3 | Running |
| M15 | 0.46354 | 30 Oct 23:00 | 9.0 pips | 1 of 3 | Running |
The status line on every chart reads Sell on M15, M30, H1, H4. The 4 hour and the daily both read DOWN, so the direction is settled. The only question left is the entry.
2. The 4 Hour: Two Months Of Lower Highs
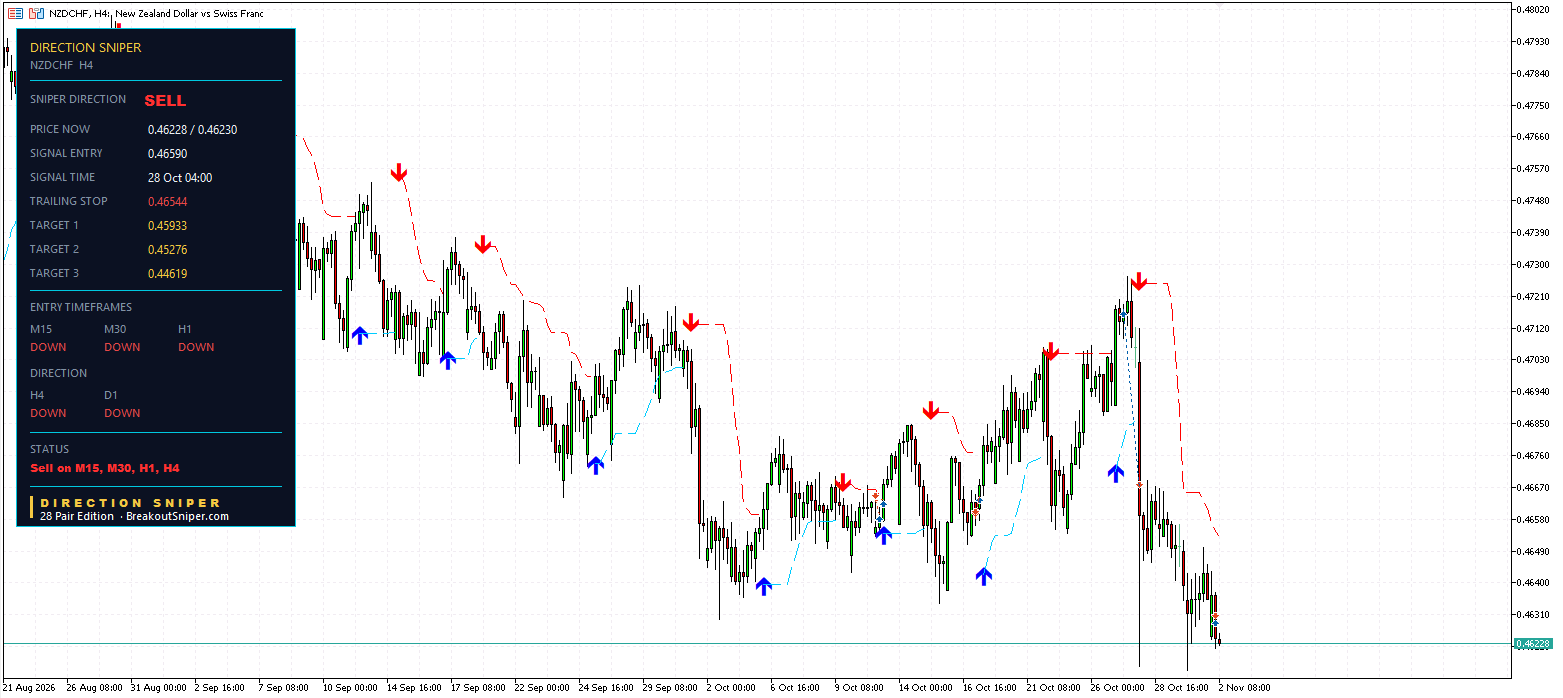
Zoom out to the 4 hour chart and the story is a slow, steady slide.
In September, NZDCHF topped out near 0.4750. Every rally since has stopped lower than the one before: around 0.4730, then 0.4720, then a sideways stretch through October between roughly 0.4640 and 0.4690.
Then came the moment that would have fooled a lot of traders. On 27 October, NZDCHF rallied to around 0.4725, its best level in weeks. On a fast chart, it looked like the New Zealand dollar was finally fighting back.
It lasted about a day. On 28 October, the pair dropped sharply, and the 4 hour sell printed that day at 04:00 at 0.46590. NZDCHF is now 0.46228, about 36 pips below the entry and back at the lows of the move.
- Trailing stop: 0.46544, already 4.6 pips in front of the entry
- Target 1: 0.45933
- Target 2: 0.45276
- Target 3: 0.44619
That trailing stop is the quiet headline. If the stop is moved to the panel’s level, this ticket can no longer close at a loss, even though it has not reached a target yet.
The late October rally is exactly the kind of move Direction Sniper is built to see through. A rally that does not turn the bigger charts is a rally inside the trend, not a new one.
3. The Faster Charts: Two Targets Reached Already
The 30 Minute And 15 Minute
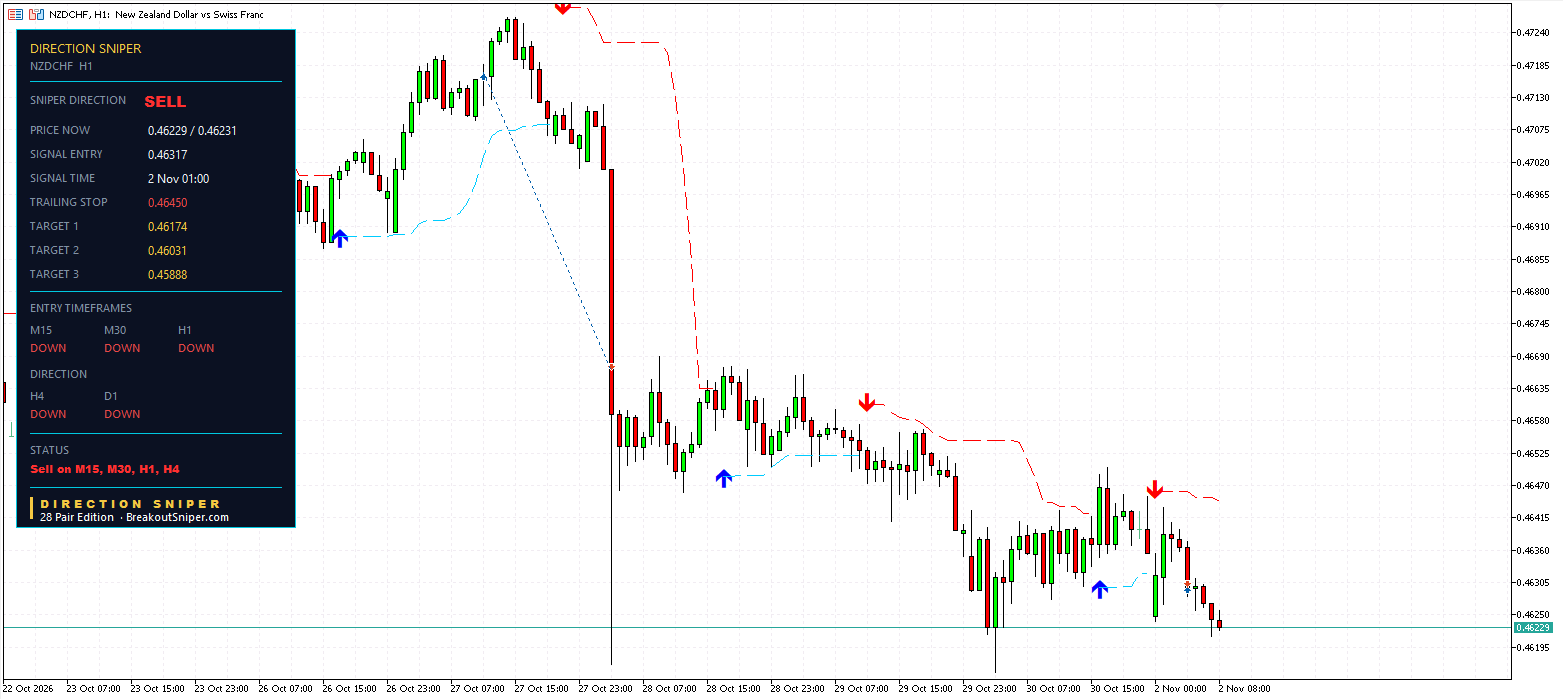
The 30 minute and 15 minute both printed a sell at the same moment, 30 October at 23:00, at the same price, 0.46354. Two charts firing together is a sign the bounce ran out on more than one timeframe at once.
Both have already reached Target 1:
| Chart | Target 1 | Trailing stop now | Next target |
|---|---|---|---|
| M30 | 0.46225, reached | 0.46401 | Target 2 at 0.46095 |
| M15 | 0.46264, reached | 0.46306, 4.8 pips in front of the entry | Target 2 at 0.46174 |
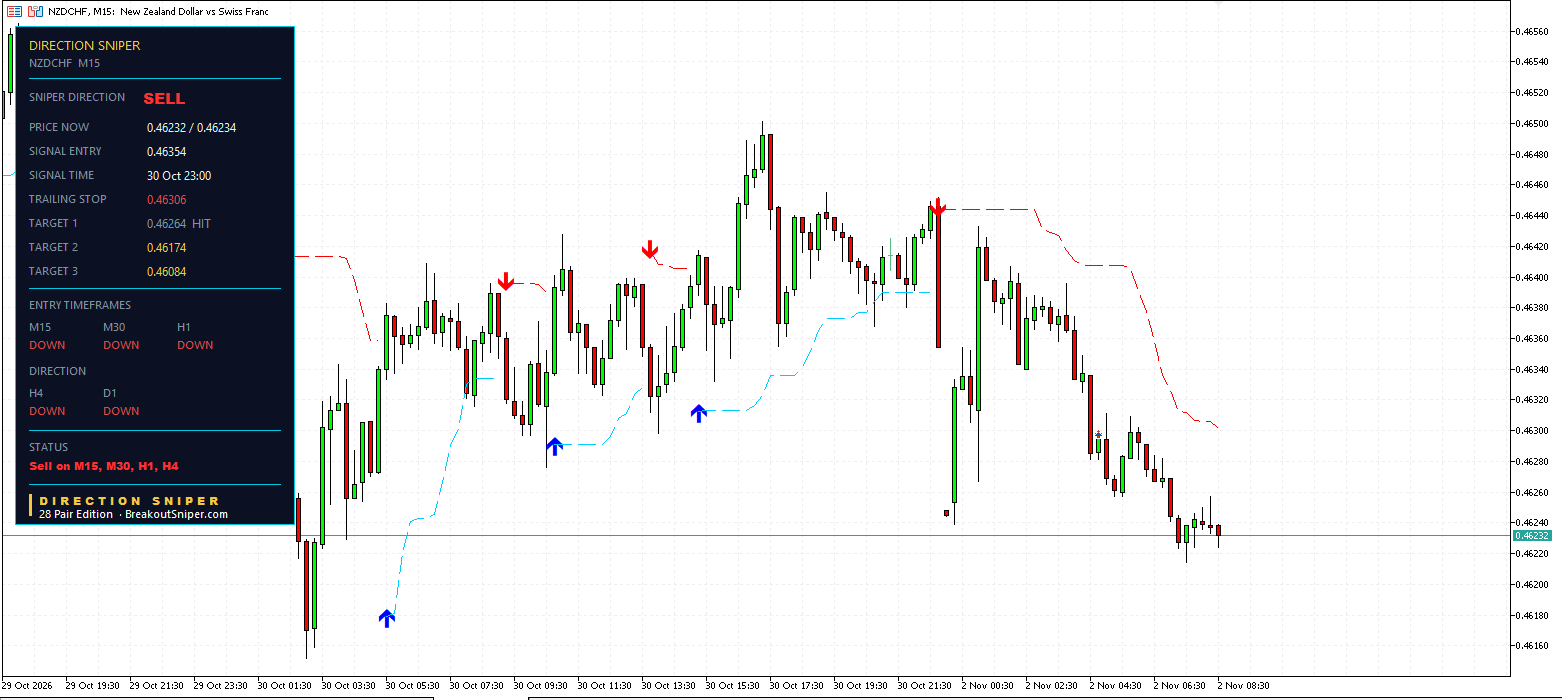
The 15 minute is in the same position as the 4 hour: its trailing stop has moved in front of the entry, so it can no longer close at a loss if the stop is moved to match.
The 1 Hour: The Freshest Ticket
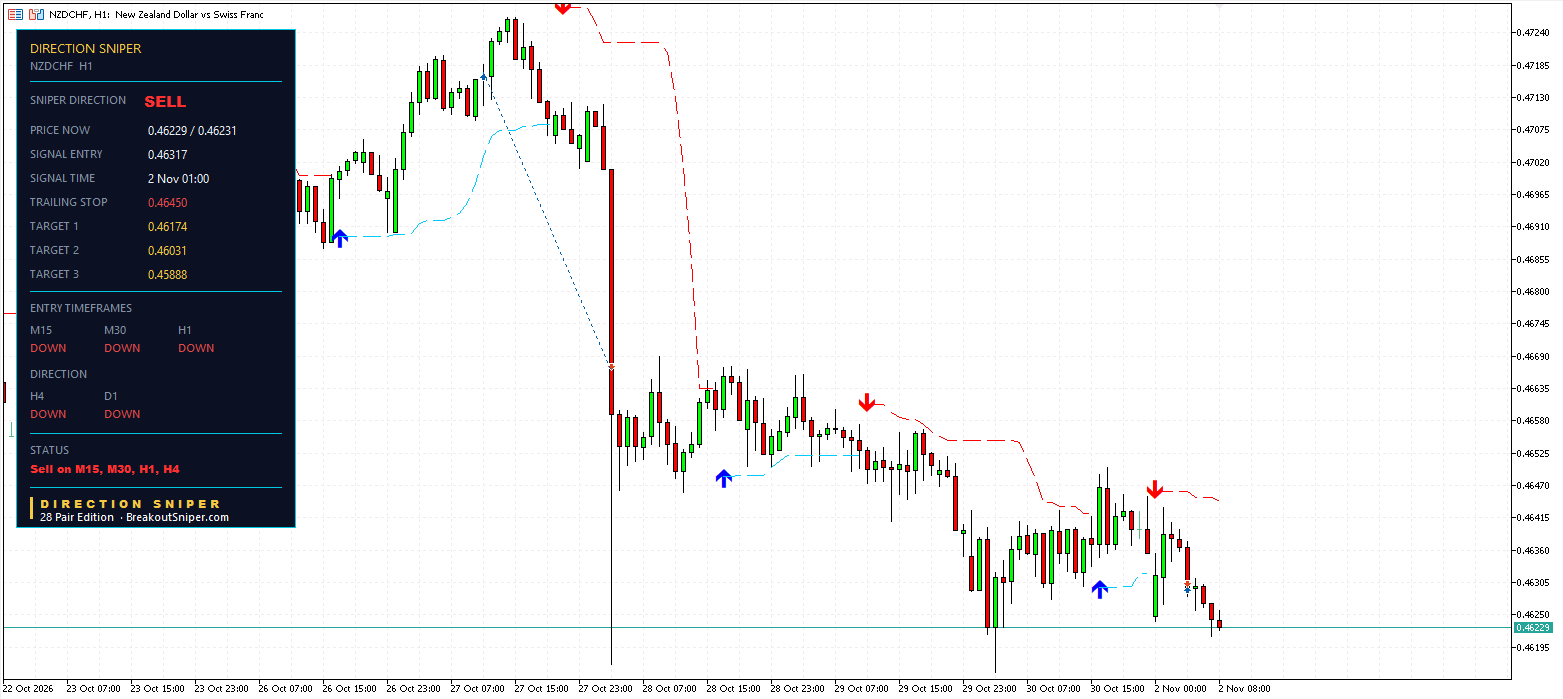
The newest ticket is on the 1 hour chart, printed this morning at 01:00 at 0.46317, after a small bounce on Friday afternoon ran out of steam below 0.4650.
- Trailing stop: 0.46450
- Target 1: 0.46174
- Target 2: 0.46031
- Target 3: 0.45888
NZDCHF is at 0.46229, about 8.8 pips below the entry. Target 1 is only about 5.5 pips away.
4. Which NZDCHF Ticket Still Has Room?
Here is the question that matters for anyone arriving today. Picture parking a car: a big space is no use if there is a wall right behind your bumper.
| Ticket | Distance to its stop from 0.46230 | Distance to its next target |
|---|---|---|
| H4 | 31.4 pips | 29.7 pips to Target 1 |
| H1 | 22.0 pips | 5.6 pips to Target 1, 19.9 pips to Target 2 |
| M30 | 17.1 pips | 13.5 pips to Target 2 |
| M15 | 7.6 pips | 5.6 pips to Target 2 |
Read it line by line.
The 4 hour has its stop and Target 1 about the same distance away, roughly 30 pips each, with two more targets beyond. From today’s price, that is the closest thing on this board to the plan as printed.
The 1 hour is almost at Target 1, but from today’s price its stop is 22 pips away and Target 1 is under 6. It is roughly even only to Target 2.
The 30 minute and 15 minute have already done their first job. They suit someone already in the trade, managing it, more than someone starting it now.
So the honest answer is: the direction is clear, and the 4 hour has the most room. The faster tickets are mostly tickets to manage.
This is the pair we are watching most closely today, not a trade recommendation.
5. Why NZDCHF, And Not NZDCAD Too?
NZDCAD also has a fresh sell on the board this morning, and the Canadian dollar is even stronger than the franc. So why not both?
Because both pairs depend on the same thing: a weak New Zealand dollar. Holding both is like building two houses on the same patch of sand. If the New Zealand dollar bounces, both trades suffer together, and two trades at 0.5 percent risk are really one position at 1 percent risk.
Our rule is one currency, one position. NZDCHF scored better on our checks today, so it gets the slot. We explain the full method in our guide to the best trending forex pairs.
6. Same Risk, Very Different Lot Sizes
Every ticket gets the same risk. We risk at most 2 percent per trade, usually 0.5 percent, so on a $10,000 account that is $50, whichever chart the ticket is on.
NZDCHF is quoted in Swiss francs, so one pip on a standard lot is 10 francs, roughly $12.14 with the franc where it is today. Check the exact figure on your platform.
- The 15 minute ticket from today’s price: a 7.6 pip stop, so $50 of risk is about 0.54 lots.
- The 1 hour ticket from today’s price: a 22.0 pip stop, so $50 of risk is about 0.18 lots.
- The 4 hour ticket from today’s price: a 31.4 pip stop, so $50 of risk is about 0.13 lots.
Same pair, same direction, same $50 at risk, and the biggest lot is four times the smallest. A wider stop does not mean more risk. It means a smaller lot. Always round down, never up. To work out your own size in seconds, use our free NZDCHF Lot Size Calculator.
On a small account, a cent account makes sizes like these possible. For small balances we recommend a RoboForex Cent account or an XM Micro account. These are partner links, so we may receive a commission at no cost to you.
Lot size is the seatbelt. It does not stop the crash. It decides how badly you get hurt. If you are worrying about every trade, your lot size is still too big.
7. What Would Change The Picture
The verdict stays SELL while the 4 hour and the daily both read DOWN.
What would keep the tickets moving: NZDCHF breaking below the late October lows around 0.4615 to 0.4617. That would put the 1 hour on its way past Target 1 and bring the 4 hour Target 1 at 0.45933 into view.
What would change the verdict: the 4 hour turning UP. If the 4 hour turned UP while the daily stayed DOWN, the panel would move to NO TRADE and stand aside.
Levels to watch, read from the chart:
- The late October lows around 0.4615 to 0.4617
- The 1 hour trailing stop at 0.46450
- The 27 October high around 0.4725
Right Direction, Right Size
Put the board together.
The Swiss franc is one of the strongest currencies on the board, the New Zealand dollar one of the weakest. Every NZDCHF timeframe reads DOWN. Four sell tickets are running, two have reached Target 1, and two already have their trailing stops in front of the entry.
That is Direction Sniper:
- Direction. One verdict from the 4 hour and the daily. On NZDCHF it reads SELL.
- Rallies and bounces that have not broken structure. The 27 October rally to around 0.4725 looked like a turn. The daily never turned, and the sells followed.
- The stop loss. Every ticket arrives with its stop and three targets marked, and the trailing stop level shows you when a ticket can no longer close at a loss.
See the full board, the other two pairs we picked and what the US dollar is doing in today’s Currency Strength Today read. Gold and silver are bouncing this morning while their bigger charts still read SELL, and our gold and silver price forecast covers both metals in full.
New to currency strength? Start with our step by step guide on how to trade currency strength.
The 28 Pair Edition puts this panel on NZDCHF and 27 other pairs, MT4 or MT5, on one licence.
Want the strongest and weakest currencies in your inbox every trading morning? Join The Daily Sniper Read, free.
NZD CHF Forecast Today: Frequently Asked Questions
Updated 2 November 2026. Levels are as shown on the Direction Sniper panel at the time of writing.
1What is the NZD CHF forecast today, 2 November 2026?+
The Direction Sniper panel reads SELL on NZDCHF on every timeframe, from the 15 minute to the daily, so the status shows Sell on M15, M30, H1, H4.
NZDCHF was around 0.46230 at the time of writing, about 36 pips below the 4 hour sell from 28 October.
2Why is NZDCHF falling?+
On the currency strength board for 2 November 2026, the Swiss franc is one of the three strongest currencies and the New Zealand dollar one of the three weakest.
A strong currency against a weak one is the kind of pair most likely to keep trending, which is why NZDCHF is today’s Pick of the Day.
3Which NZDCHF ticket still has room?+
From 0.46230, the 4 hour ticket has its stop and Target 1 about the same distance away, roughly 30 pips each, with two more targets beyond.
The 1 hour, 30 minute and 15 minute tickets are close to their next targets, so they suit someone already managing the trade more than someone starting it. This is the pair we are watching, not a trade recommendation.
4Which NZDCHF targets have been reached?+
Two. The 30 minute sell from 0.46354 reached Target 1 at 0.46225, and the 15 minute sell from the same price reached Target 1 at 0.46264.
Price reaching a published target level is not the same as a realised result. It does not describe anyone’s trade.
5Can the NZDCHF 4 hour ticket still close at a loss?+
Not if the stop is moved to the panel’s level. The 4 hour sell entered at 0.46590, and its trailing stop level is now 0.46544, about 4.6 pips in front of the entry.
Direction Sniper shows the trailing stop level. The trader moves their own stop order to match it.
6Why not trade NZDCAD as well?+
NZDCAD and NZDCHF both depend on a weak New Zealand dollar, so holding both repeats the same exposure. Two trades at 0.5 percent risk become one position at 1 percent risk.
Our rule is one currency, one position, and NZDCHF scored better on our checks today.
7What would change the NZDCHF verdict?+
The verdict only changes if the 4 hour turns UP. If the 4 hour turned UP while the daily stayed DOWN, the panel would move to NO TRADE and stand aside.
Levels to watch are the late October lows around 0.4615, the 1 hour trailing stop at 0.46450 and the 27 October high around 0.4725.
8What lot size should I use on NZDCHF?+
We risk at most 2 percent per trade, usually 0.5 percent, which is $50 on a $10,000 account. With one NZDCHF pip worth about $12.14 per standard lot, a 31.4 pip stop is about 0.13 lots and a 7.6 pip stop is about 0.54 lots.
Use the NZDCHF Lot Size Calculator to work out your own size. These figures are arithmetic for illustration, not a recommendation about how much anyone should trade.
DIRECTION SNIPER 28 PAIR EDITION
See NZDCHF and 27 more pairs the moment a ticket prints.
Direction, entry, stop and three targets on all 28 pairs. MT4 or MT5, one licence.
Disclaimer: This post reports what the Direction Sniper panel showed on NZDCHF on 2 November 2026. The tickets were running at the time of writing, and prices will have moved by the time you read this. It is educational analysis, not financial advice and not a trade signal service, and nothing here is a recommendation to buy or sell. Price reaching a published target level is not the same as a realised result. A target shown as reached means price touched that level on the chart, and does not describe anyone’s trade. High and low levels are approximate readings from the chart. Pip values and lot sizes are arithmetic for illustration, depend on the exchange rate, and are not a recommendation about how much anyone should trade. Forex trading carries risk, and you should only trade money you can afford to lose.

