USD CAD Forecast Today, 16 October 2026:
Two Targets Reached, And All Five Timeframes Pointing Down
This USD CAD forecast today starts with the cleanest board a trader can ask for. Every timeframe on the Direction Sniper panel reads DOWN: the 15 minute, the 30 minute, the 1 hour, the 4 hour and the daily.
The 15 minute ticket has already reached two of its three targets. Its trailing stop sits in front of the entry. And a fresh 30 minute ticket printed this morning, lined up with the same verdict.
USDCAD now trades about 67 pips below where the 4 hour first called the sell on 13 October. The direction has been right all week. Here is the full board, every number, and the lesson that makes it worth reading.
The Board At A Glance
| Chart | Entry | Stop or trailing level | Targets | State |
|---|---|---|---|---|
| M15 | 1.41899 | 1.41868 (trailing) | 1.41808, 1.41717, 1.41626 | Targets 1 and 2 reached, running |
| M30 | 1.41738 | 1.41995 (stop loss) | 1.41481, 1.41224, 1.40967 | Fresh ticket, running |
| H1 | 1.42045 | 1.42173 (trailing) | 1.41317, 1.40590, 1.39862 | Closed at trailing stop |
| H4 | 1.42408 | 1.42887 (stop loss) | 1.41929, 1.41450, 1.40971 | Closed at stop loss |
Two targets reached. Four positions still running, counting each ticket as three positions under the three target split.
1. The 15 Minute: Two Targets Reached, Stop Already In Front
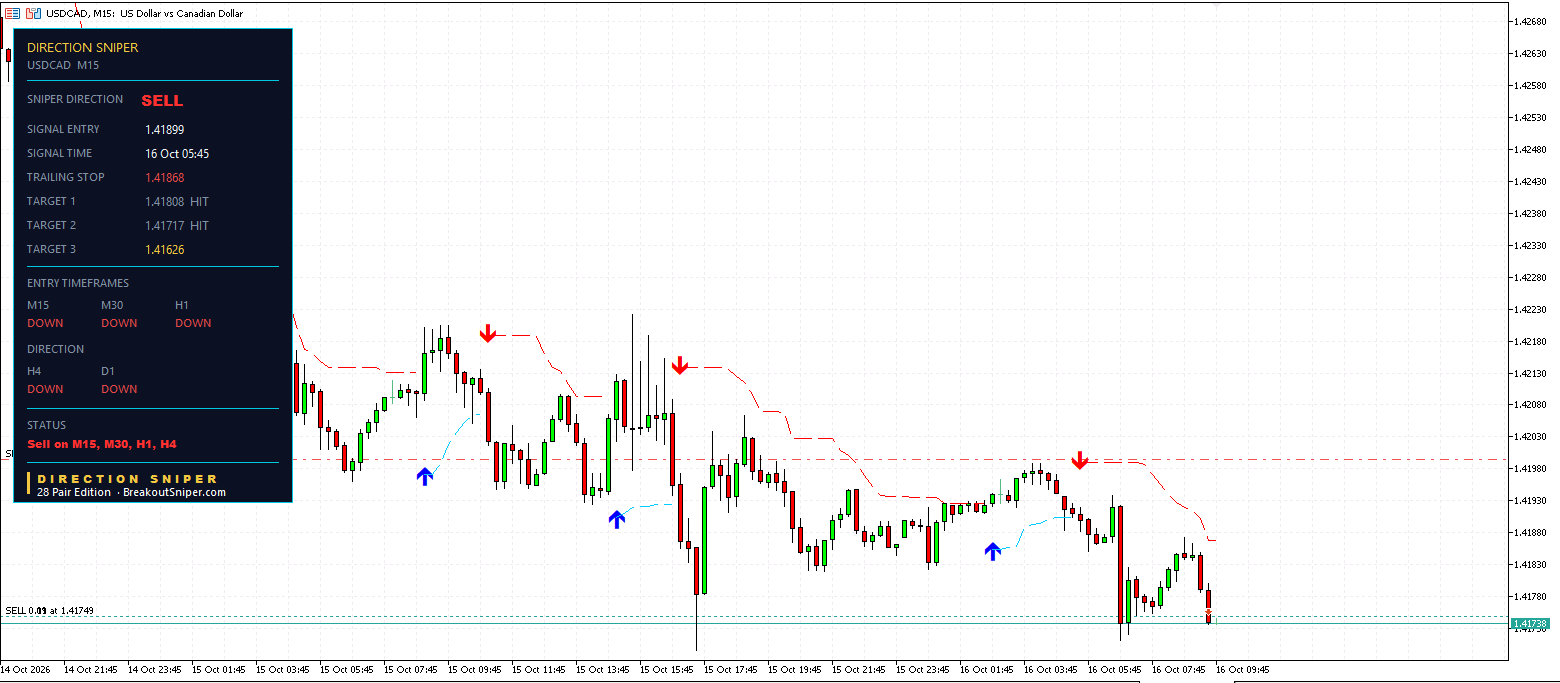
The 15 minute ticket printed this morning at 05:45:
- Entry 1.41899
- Original stop 1.41990, so 9.1 pips of risk
- Target 1 at 1.41808, reached
- Target 2 at 1.41717, reached
- Target 3 at 1.41626, still ahead
The label now reads TRAILING STOP, and the level sits at 1.41868. That is 3.1 pips in front of the entry. The stop has crossed break even, so this ticket is in its second phase: a trigger here closes in front of the entry, not behind it.
Price is at about 1.41738, which is 16.1 pips below the entry, or 1.77 times the original risk. Target 3 is 11.2 pips away.
That crossing point is the moment most traders guess at. On Direction Sniper you read it straight off the panel. If you want to see exactly how it works, our guide on when to move stop loss to break even walks through five real panels.
2. The 30 Minute: New Targets Today
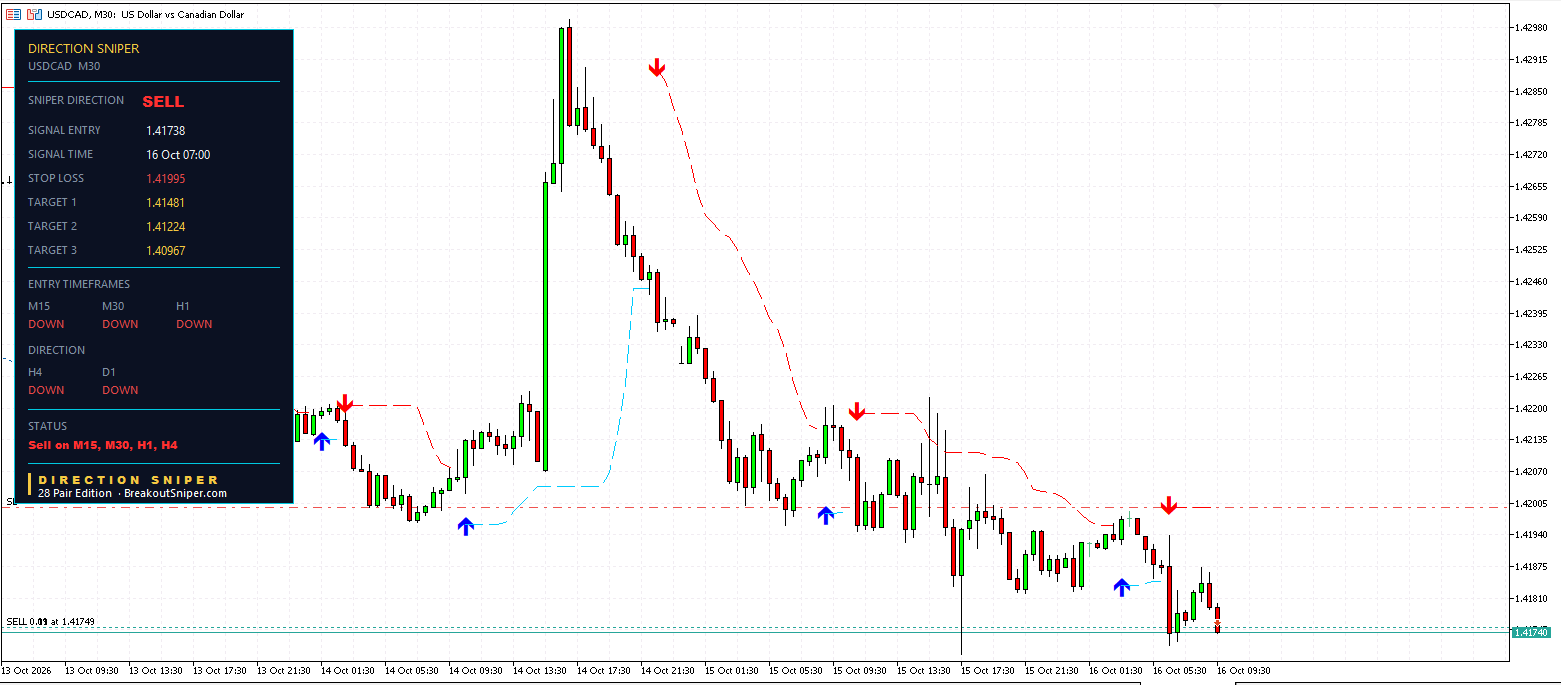
A fresh 30 minute ticket printed at 07:00 this morning:
- Entry 1.41738
- Stop loss 1.41995, so 25.7 pips of risk
- Target 1 at 1.41481
- Target 2 at 1.41224
- Target 3 at 1.40967
Every target sits exactly 25.7 pips apart, one, two and three times the risk. Price is right at the entry. The status reads Sell on M15, M30, H1, H4. Four entry charts lined up with the verdict at once.
When every chart points the same way, the panel says so in one line. You do not have to open five charts and work it out for yourself.
3. How The Bigger Charts Set This Up
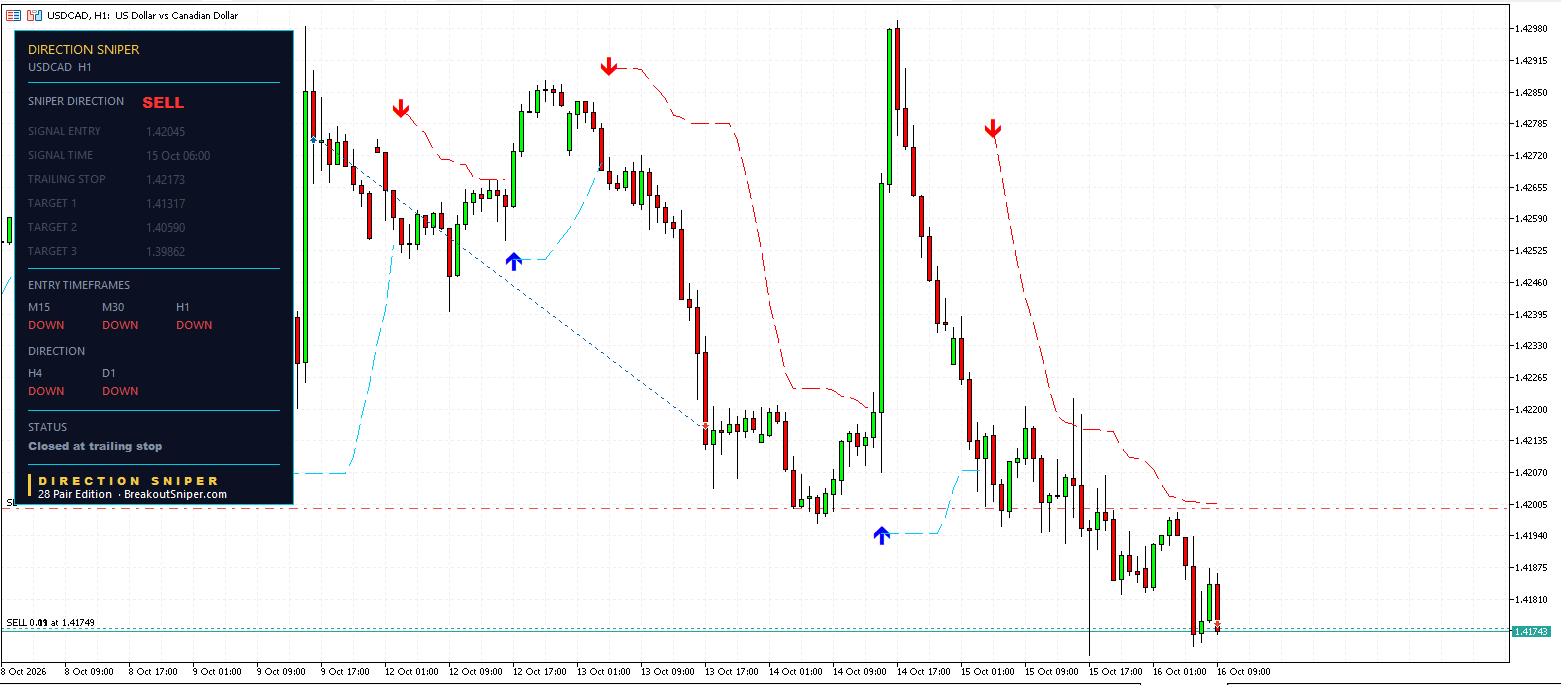
The fast charts did not find this move on their own. The 4 hour and the 1 hour called it first.
The 4 hour printed a sell at 1.42408 on 13 October, with a stop at 1.42887, 47.9 pips of risk. On 14 October USDCAD ran a sharp rally to around 1.4298 and reached that stop. The ticket closed at its stop loss.
But look at what happened next. The rally did not change the 4 hour or daily direction. Both kept reading DOWN. Price turned and fell, and today it sits about 67 pips below that 4 hour entry. That is 1.40 times the original risk, and below where the first target would have been.
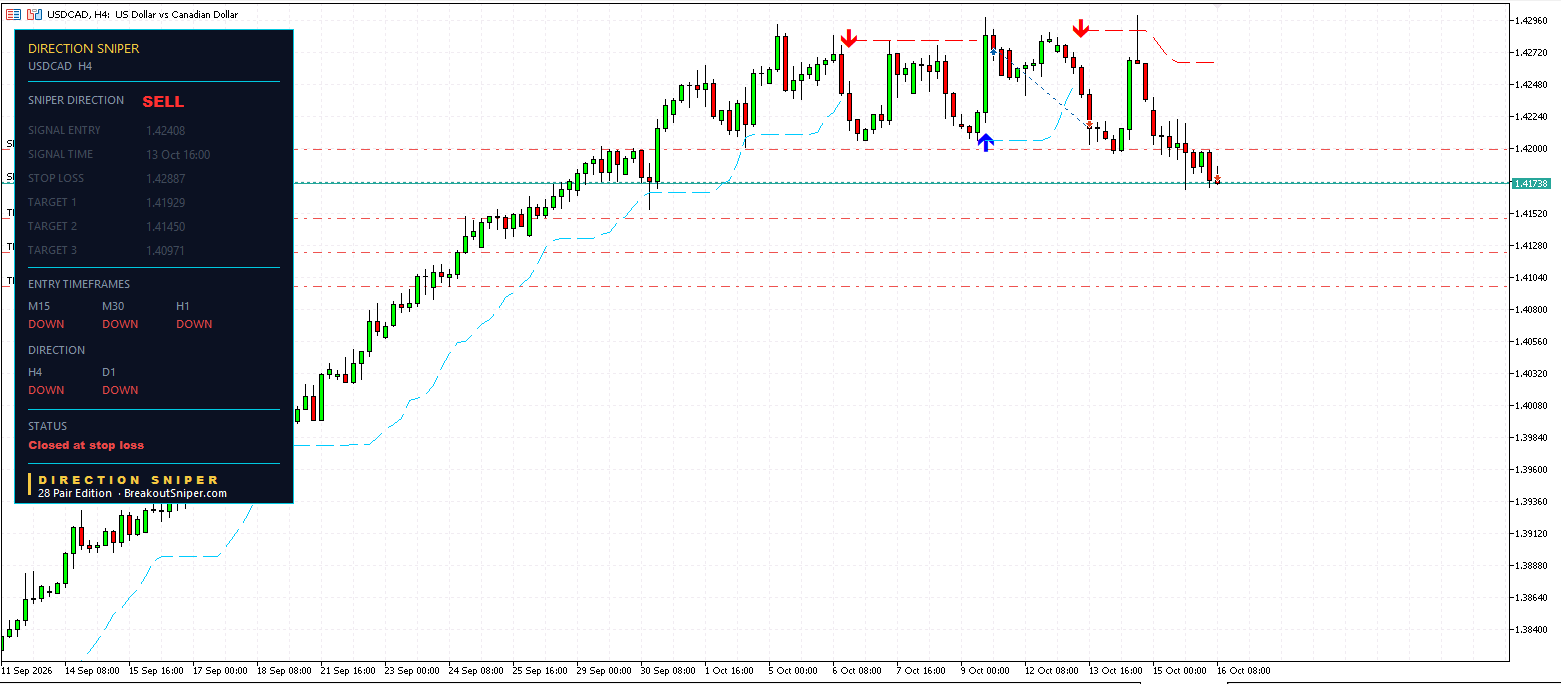
The direction was right. The stop simply did not have enough room for that one rally.
The 1 hour printed a sell at 1.42045 on 15 October, after that rally. Its original stop was 1.42773, a wide 72.8 pips. Then the trailing level tightened all the way to 1.42173. When a smaller rally on 15 October reached it, the ticket closed just 12.8 pips behind the entry.
That is the trailing stop doing its job. The plan allowed for 72.8 pips of risk. The trail cut it to 12.8, about one sixth of the plan. And again, price is now 30 pips below that entry.
This is the part of Direction Sniper that matters most when a market shakes. The verdict tells you which way to lean. The trailing level tells you how much of the plan is still at risk. Both sit on one panel.
4. The Lesson: A Stop Out Is Not The End Of The Move
Here is what this board teaches.
When a bigger chart is stopped out but the verdict holds, the move is not over. The panel keeps looking for the next entry on the faster charts.
Watch the order this week:
- The 4 hour called the sell first, on 13 October
- A rally on 14 October reached its stop
- The 1 hour came in after that rally, on 15 October, and the trail kept its loss small
- The 15 minute and 30 minute came in on 16 October, after both rallies were already on the chart
Each new ticket entered lower, with the earlier highs already behind it. The 15 minute has two targets reached. The 30 minute has new targets on the board.
The bigger timeframes see a turn first, so they enter first. That also means they sit through every rally on the way. The faster timeframes enter later, but by then the shakeout has often already happened.
A trader who quits after the first stop out never sees the next entry. A trader who keeps reading the panel does.
5. Lot Size: Four Tickets, Four Very Different Sizes
The stop distance decides the lot size. Never the other way around.
There is one detail on USDCAD that catches a lot of traders out. The price is quoted in Canadian dollars, so one pip on a standard lot is worth 10 Canadian dollars, not 10 US dollars. At today’s price that is about 7.06 US dollars a pip.
So at 50 US dollars of risk:
- M15: 9.1 pips of risk, about 0.78 lots
- M30: 25.7 pips of risk, about 0.28 lots
- H4: 47.9 pips of risk, about 0.15 lots
- H1: 72.8 pips of risk, about 0.10 lots
The 15 minute takes about eight times the size of the 1 hour for the same dollar risk. Use the same lot size on both and you are taking two completely different risks.
Every Direction Sniper ticket prints the stop before you enter. That is what makes this calculation possible before the trade, not after it. Contract specifications vary between brokers, so check your own.
6. Where The Levels Sit Now
USDCAD (price about 1.41738)
- M15: Target 3 at 1.41626, trailing level 1.41868
- M30: Target 1 at 1.41481, stop loss 1.41995
- H1 and H4: closed, waiting for the next ticket
Every timeframe reads DOWN. The verdict is SELL.
Why We Publish This
Every read on this site comes straight from the Direction Sniper panel. We publish the entry, the stop and the targets as the panel shows them, including the tickets that close at their stops. You can check every number against the chart yourself. Our own SELL 0.01 order at 1.41749 is visible on three of the panels, and we have left it in rather than crop it out.
One Panel, 28 Pairs
USDCAD is one of 28 pairs on the Direction Sniper 28 Pair Edition. Every major, every minor, every cross, in one file.
That matters on a week like this one. When one chart shakes you out, the panel is already lining up the next entry, on this pair or on another. With 28 pairs, there is almost always a chart somewhere lined up with its verdict.
- Direction. Every timeframe on USDCAD reads DOWN, and price is 67 pips below the first sell.
- Rallies that do not change the bigger picture. Two rallies this week reached stops. Neither changed the 4 hour or daily direction.
- The stop loss. The 1 hour trail cut a 72.8 pip plan down to 12.8 pips, and the 15 minute trail already sits in front of its entry.
Want a read like this in your inbox? Join The Daily Sniper Read, free, every trading day.
Frequently Asked Questions
What is the USD CAD forecast today, 16 October 2026?
Every timeframe on the Direction Sniper panel reads DOWN on USDCAD, so the verdict is SELL.
The 15 minute ticket from 1.41899 has reached two of its three targets, and a fresh 30 minute ticket printed at 1.41738 this morning.
Price sits about 67 pips below where the 4 hour first called the sell on 13 October.
Why did the 15 minute ticket reach two targets on USDCAD today?
The ticket entered at 1.41899 with 9.1 pips of risk, so its first two targets sat at 1.41808 and 1.41717.
Price fell to both levels this morning, and the trailing level moved to 1.41868, which is 3.1 pips in front of the entry.
Target 3 sits at 1.41626.
If the 4 hour ticket closed at its stop loss, why does Direction Sniper still read SELL on USDCAD?
The verdict comes from the 4 hour and the daily direction, and both still read DOWN.
The rally on 14 October reached the 4 hour stop at 1.42887 but did not change either direction.
Price then fell to about 1.41738, which is 67 pips below that 4 hour entry.
Why do the faster timeframes often get a better entry after a bigger timeframe is stopped out?
Bigger timeframes see a turn first, so they enter first and sit through every rally on the way.
Faster timeframes line up with the verdict later, often after the rally has already happened, so they enter lower with the earlier high behind them.
While the 4 hour and daily hold the verdict, the panel keeps looking for the next entry on the faster charts.
How much is one pip worth on USDCAD?
USDCAD is quoted in Canadian dollars, so one pip on a standard lot is worth 10 Canadian dollars, not 10 US dollars.
At a price of about 1.4174 that is roughly 7.06 US dollars a pip.
At 50 US dollars of risk, the 30 minute ticket with 25.7 pips of risk works out to about 0.28 lots, and the 15 minute ticket with 9.1 pips works out to about 0.78 lots.
Does a reached target mean a trader made money?
No. Price reaching a published target level is not the same as a realised result.
Fills, spreads, lot size and when each trader closed the position all change the outcome.
These posts report what the Direction Sniper panel showed, for education, and they are not a trade signal service.
Disclaimer: This post reports what the Direction Sniper panel showed on 16 October 2026. It is educational analysis, not financial advice and not a trade signal service. The 15 minute and 30 minute tickets were still open at the time of writing. Price reaching a published target level is not the same as a realised result. Lot sizes are arithmetic for illustration and are not a recommendation about how much anyone should trade. Trading carries risk, and you should only trade money you can afford to lose.