EUR USD Forecast Today, 14 October 2026: Every Chart Agreed, And The Fastest Ticket Still Closed At A Loss
Executive Summary
EUR USD forecast today: every row on every panel reads the same way, and one of the tickets on this board still closed at a loss.
That is not a contradiction and it is not a fault. It is the most useful thing the board has shown us in a fortnight, so we are going to take it apart properly.
Here is the state of the five timeframes.
| Chart | Reading | Role |
|---|---|---|
| D1 | DOWN | sets the verdict |
| H4 | DOWN | sets the verdict, and carries a ticket |
| H1 | DOWN | carries a ticket |
| M30 | DOWN | carries a ticket |
| M15 | DOWN | carried a ticket, now closed |
The verdict is SELL. The status line on the live tickets reads Sell on M15, M30, H1, H4. Every entry chart agrees with the two charts that decide. There is no pullback anywhere on the board, no timeframe sitting out, nothing waiting for alignment.
This is as much agreement as the system can produce.
And here is what those four aligned charts actually did.
| Chart | Entry | Signal time | Risk | Where it ended up |
|---|---|---|---|---|
| H4 | 1.13662 | 29 Sep 04:00 | 36.6 pips | All three targets reached |
| H1 | 1.11936 | 14 Oct 13:00 | 19.9 pips | Live, 2.0 pips in front |
| M30 | 1.11995 | 14 Oct 11:00 | 11.6 pips | Live, 8.7 pips in front |
| M15 | 1.12053 | 14 Oct 09:00 | 6.0 pips | Closed at trailing stop |
A completed plan, two live trades at opposite ends of their journey, and a closed loser. Same pair, same verdict, same direction, three of them inside the same four hours.
EUR USD is trading at 1.1191.
Why we publish this. Every entry, stop and target below is a level the indicator printed on a live chart, at the moment it printed, before price did anything about it. Nothing is back tested. Nothing is chosen after the fact. We publish the tickets that did not work alongside the ones that did, because a page that only shows you winners teaches you nothing you can use. The point is to show how the panel is read and how position size follows from a stop. These are not trade recommendations and nothing here is financial advice.
And the line that matters most on any page quoting reached targets. Price reaching a published target level is not the same as a realised result. Whether anyone was in any of these trades, at what size, and what they did at each level, is theirs and not ours. What follows is arithmetic on published levels, nothing more. Two of the positions described below were still open when this was written.
1. Start With The One That Lost
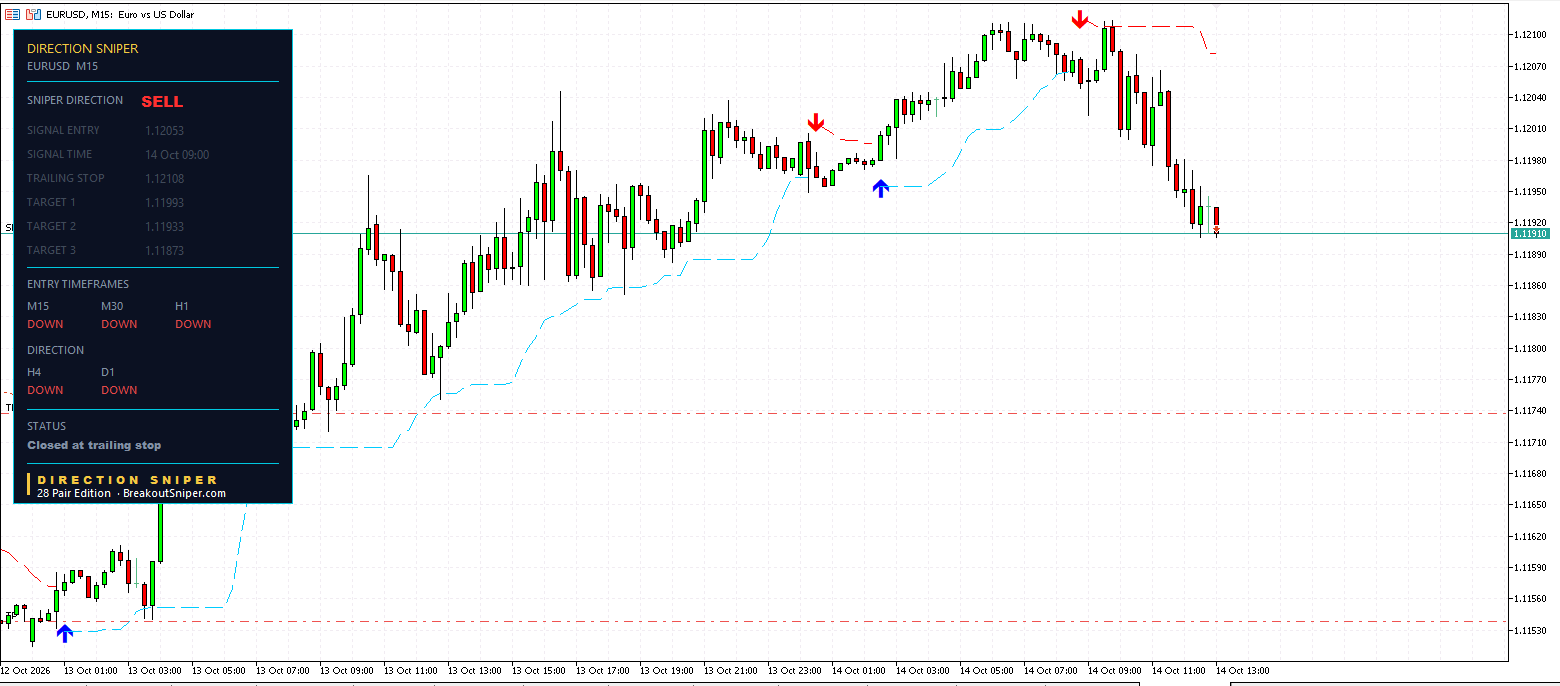
Most forecast pages would bury this. We are opening with it, because it is where the lesson lives.
| Level | |
|---|---|
| Entry, sell | 1.12053 on 14 October at 09:00 |
| Original stop | 1.12113, so 6.0 pips of risk |
| Target 1 | 1.11993, not reached |
| Target 2 | 1.11933, not reached |
| Target 3 | 1.11873, not reached |
| Trailing stop, frozen | 1.12108 |
| Status | Closed at trailing stop |
The ticket is dimmed. Every target is grey and unmarked. The status line says the level was passed and the plan is over.
Now look at where the trailing stop finished. It sits at 1.12108, and the entry was 1.12053. On a sell, that is 5.5 pips above the entry. The level never crossed. It never came close to crossing. This ticket lived and died entirely in phase one.
So what did the trail actually achieve here? The original stop was 1.12113. The trail closed the ticket at 1.12108. It saved half a pip.
That is worth being honest about, because it is the opposite of what most people expect a trailing stop to do. A trailing level is not a profit machine. On a trade that never develops, it does almost nothing, and it was never designed to. It tightens when the structure behind the trade tightens, and on this ticket the structure never tightened, because the trade never got going.
And here is the part that stings.
EUR USD is now at 1.1191.
Look at that fifteen minute ticket again. Target 1 was 1.11993. Target 2 was 1.11933. Price is below both of them.
The direction was right. The ticket was right. Price went on to pass what would have been target one and target two, 14.3 pips below the entry, two and a third times the original risk, and that ticket was already closed and dimmed before it got there.
It was not wrong about where EUR USD was going. It had six pips of room to be right in.
2. Now The One That Finished
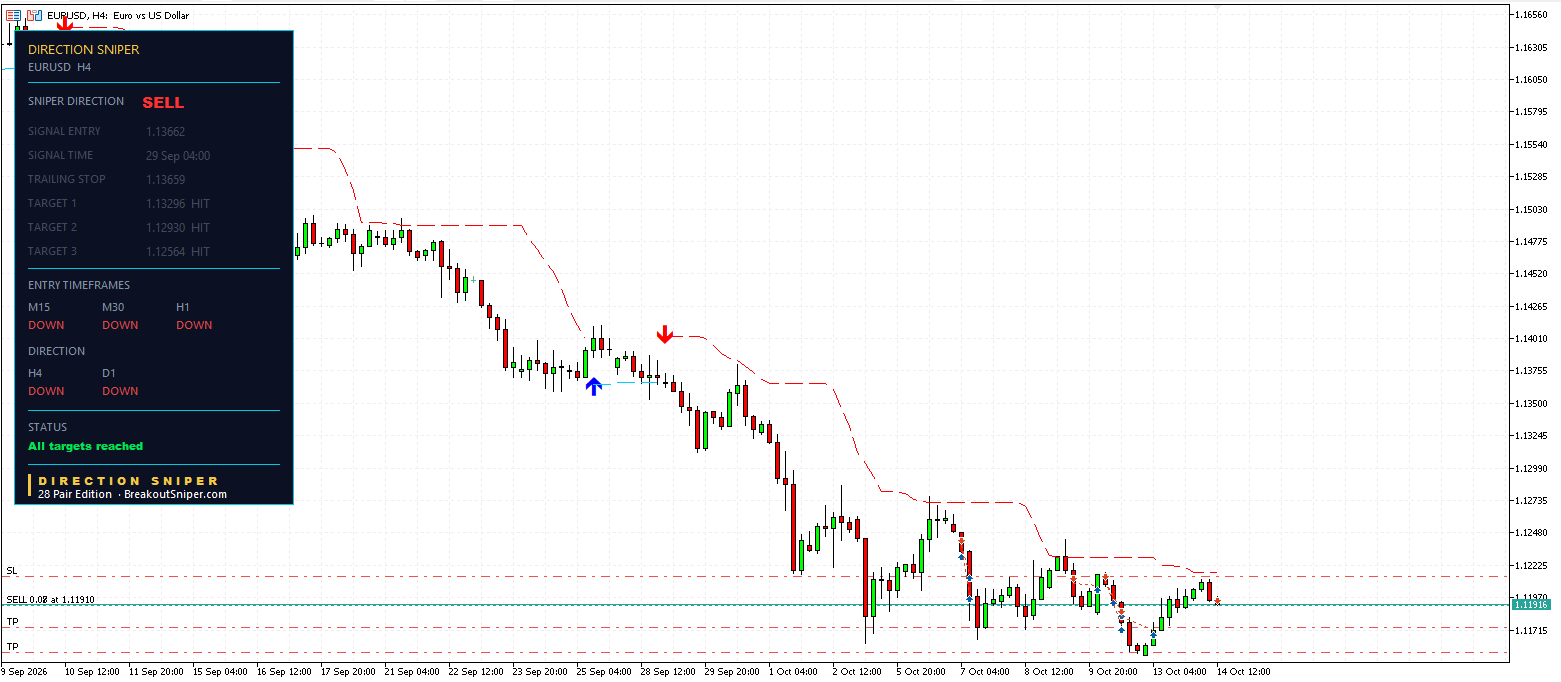
The panel at the top of this page is the four hour ticket. It is dimmed too, but for the opposite reason.
| Level | |
|---|---|
| Entry, sell | 1.13662 on 29 September at 04:00 |
| Original stop | 1.14028, so 36.6 pips of risk |
| Target 1 at 1.13296 | reached |
| Target 2 at 1.12930 | reached |
| Target 3 at 1.12564 | reached |
| Trailing stop, frozen | 1.13659 |
| Status | All targets reached |
Same verdict. Same direction. Same pair. Six times the stop distance, and a completely different ending.
The arithmetic reconstructs exactly, as it always does. One unit of risk is 36.6 pips. Target one sits one unit from the entry, target two sits two, target three sits three. Put 36.6 into the entry and every published level comes back to the point.
One number on this ticket is worth noticing before we move on. The trailing stop froze at 1.13659 against an entry of 1.13662. It had crossed break even by three tenths of a pip at the moment target three was touched. We wrote about that at length in the 12 October EUR USD read, and it is the clearest example we have ever published of why targets and the trailing level are not measuring the same thing.
And one more. That ticket completed on a 36.6 pip stop. Price is now 174.6 pips below its entry, which is 64.8 pips past target three and 4.77 times the original risk.
Target three ends the plan. It does not end the move. Those are two different statements and this ticket proves both of them on one chart.
3. The Two That Are Still Running
Between the loser and the finisher sit two live tickets, both printed this afternoon, both in front, both at completely different stages.
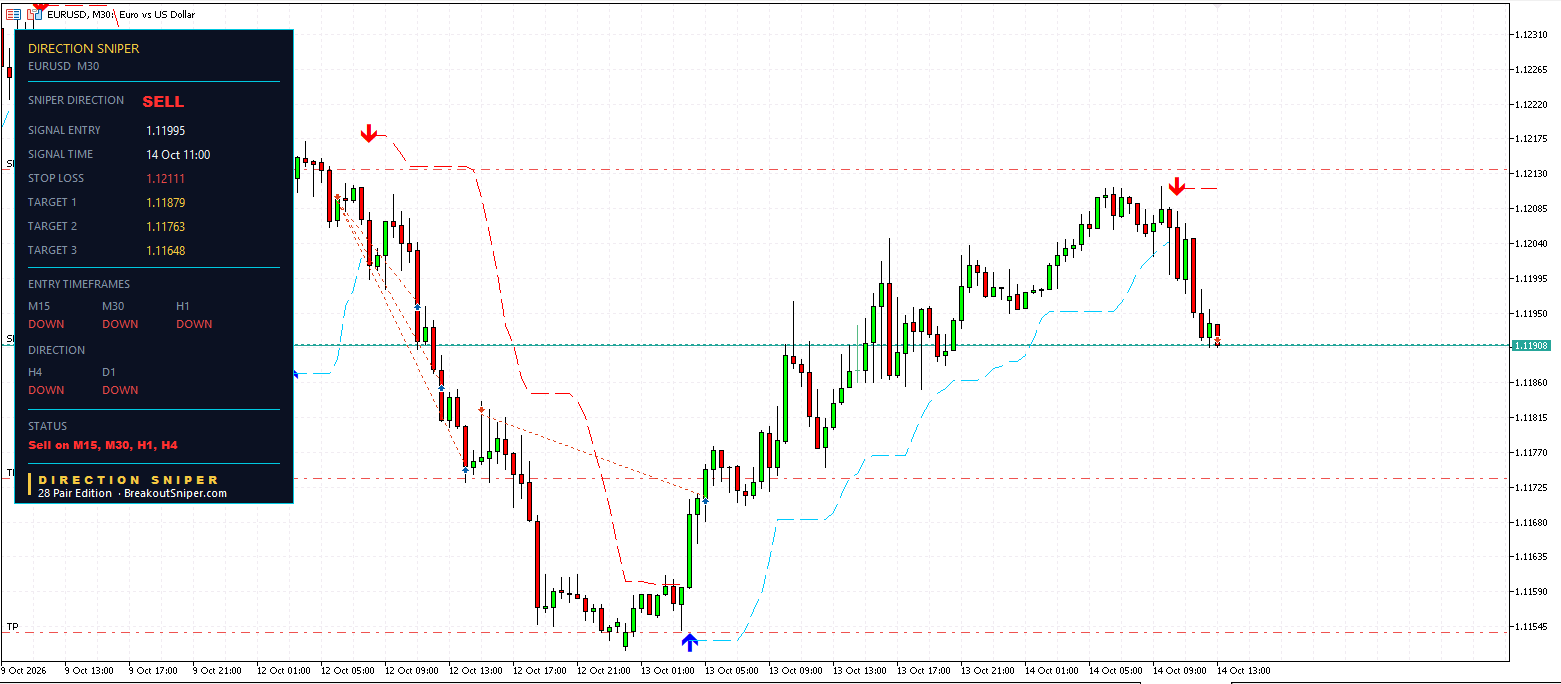 The thirty minute
| Level | |
|---|---|
| Entry, sell | 1.11995 on 14 October at 11:00 |
| Stop | 1.12111, so 11.6 pips of risk |
| Target 1 | 1.11879 |
| Target 2 | 1.11763 |
| Target 3 | 1.11648 |
| Label | still reads STOP LOSS |
Price on that chart is 1.11908. The entry was 1.11995, so this ticket is 8.7 pips in front, which is 75 per cent of the way to target one. Target one is 2.9 pips away.
The label still reads STOP LOSS rather than TRAILING STOP. That single word tells you at a glance that nothing has tightened yet and nothing is protected. Three quarters of the way to the first target and the plan is still carrying its full original risk.
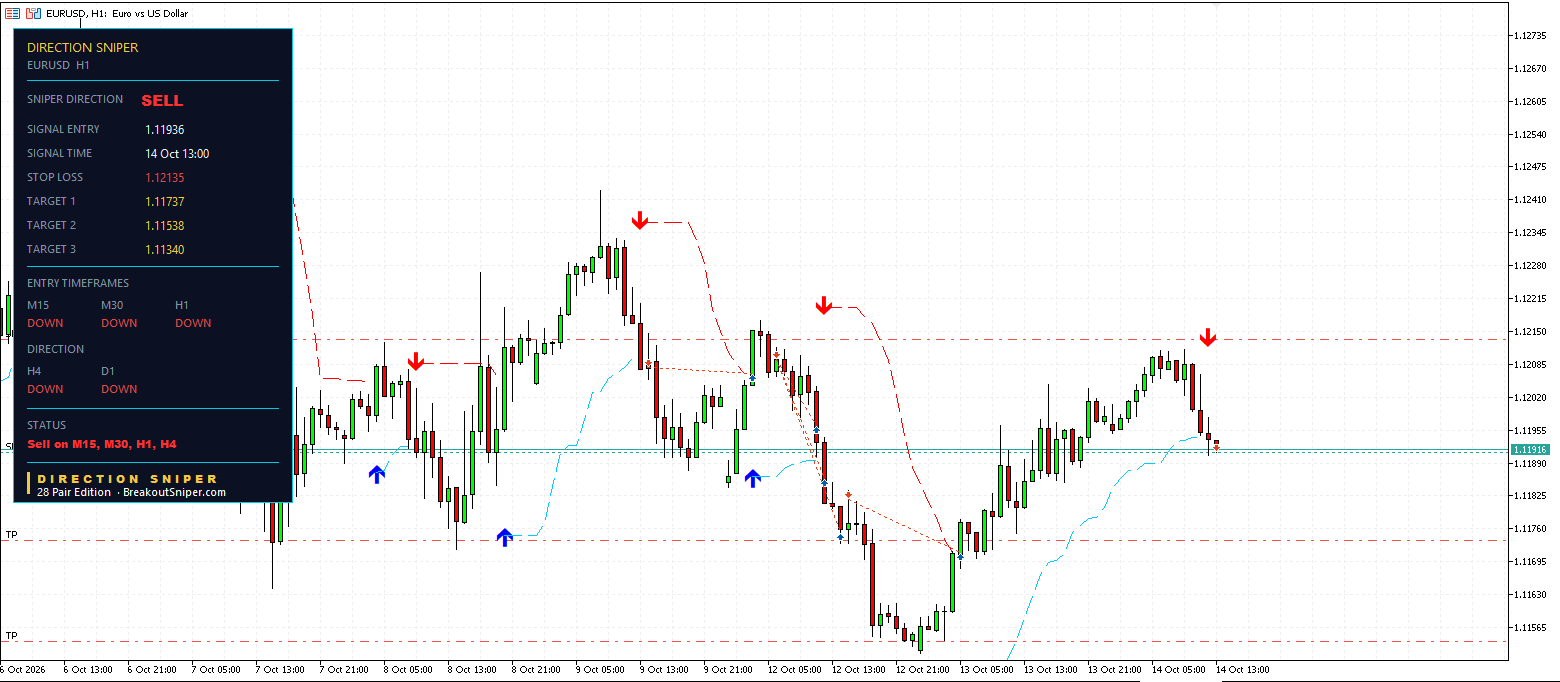
The one hour
| Level | |
|---|---|
| Entry, sell | 1.11936 on 14 October at 13:00 |
| Stop | 1.12135, so 19.9 pips of risk |
| Target 1 | 1.11737 |
| Target 2 | 1.11538 |
| Target 3 | 1.11340 |
| Label | still reads STOP LOSS |
Price is 1.11916. That is 2.0 pips in front of the entry, just over 10 per cent of the way to target one. This ticket printed minutes ago. It has barely started.
Two live tickets, on the same pair, in the same direction, within two hours of each other. One is three quarters of the way to its first target. The other has gone two pips. Neither has trailed.
And a warning that belongs here. Those two tickets plus the fifteen minute are not three opportunities. They are one view of EUR USD, written down three times. Take all three at your normal size and you are carrying roughly three times your usual risk on a single idea, and when that idea is wrong, all three are wrong together on the same afternoon. The fifteen minute already demonstrated what that looks like.
4. Four Identical Directions, Four Different Endings
Put the four stop distances next to each other and the whole page explains itself.
M15      6.0 pips
M30     11.6 pips
H1      19.9 pips
H4      36.6 pips
Each one is close to double the one above it. That is not a coincidence or a setting. It is what the market structure on each timeframe actually looks like. A fifteen minute chart builds small structures, so the stop sits close. A four hour chart builds large ones, so the stop sits far away.
The direction was not the variable today. The direction was identical on all four charts. The stop distance was the variable, and it decided everything.
The fifteen minute had six pips of room. EUR USD moved more than six pips against that entry before it moved a hundred and seventy five in its favour, and six pips was not enough room to survive the path.
The four hour had thirty six pips of room, and it absorbed every one of those same wobbles without noticing them.
This is the question nobody asks before they take a trade. Everyone asks which way. Almost nobody asks how much room does this plan need, and does the market usually give that much room before it goes anywhere.
The answer is printed on the ticket, every time, before you click.
5. The Chart That Lost Is The Chart That Carries The Biggest Position
Here is where this becomes money rather than theory.
Lot size comes from the stop distance, not from the chart, not from confidence, and not from habit. The formula is the same on every symbol you will ever trade.
lot size = risk in money / ( stop distance in pips x value of a pip per lot )On EUR USD, one standard lot is roughly ten dollars a pip. Put fifty dollars of risk through the four stop distances on today’s board.
| Chart | Stop | Lot size for $50 of risk |
|---|---|---|
| M15 | 6.0 pips | 0.83 |
| M30 | 11.6 pips | 0.43 |
| H1 | 19.9 pips | 0.25 |
| H4 | 36.6 pips | 0.14 |
Read that column again.
The fifteen minute ticket needs six times the size of the four hour ticket to put the same fifty dollars at risk. Six times.
Now remember which ticket closed at a loss today.
A trader who sizes correctly loses fifty dollars on the fifteen minute, the same fifty he would have risked anywhere else, and shrugs. A trader who sizes by habit, who uses the same lot on every chart because that is what feels normal, has just taken his largest position on his most fragile ticket. And he will do it again next week, and the week after, and he will never work out why his losses feel so much heavier than his wins.
That is not a strategy problem. It is an arithmetic problem, and it is the single most expensive one in retail trading.
The stop does not only tell you where you are wrong. It tells you how big you are allowed to be.
6. What The Board Is Actually Saying Right Now
Strip away the four tickets and the message is simple.
The verdict is SELL and nothing on the board disagrees with it. The daily and the four hour both point down. All three entry charts point down. There is no pullback anywhere, which means there is also no timeframe currently sitting out waiting to rejoin.
Two tickets are live. The thirty minute at 1.11995 with 11.6 pips of risk, close to its first target. The one hour at 1.11936 with 19.9 pips of risk, barely started. Neither has trailed, so both are carrying their full original risk right now.
The levels worth watching. The thirty minute’s target one at 1.11879 is the nearest published level below the market. Below that sit 1.11763 and 1.11648. Above the market, the two live stops sit at 1.12111 and 1.12135, which is the band where both plans say they are wrong.
And the honest caveat. A board with every timeframe aligned feels like the safest moment to trade. Today is a reminder that it is not a different kind of certainty, it is the same uncertainty with better odds. One ticket inside that perfect alignment has already gone.
If you take one thing from this page, take this.
Every chart agreed on where EUR USD was going. All four were right about the direction. One of them still closed at a loss, because it had six pips of room and the market needed more than six pips of room.
You do not get to choose how much room a plan needs. The chart decides that, and the panel prints it. What you choose is the size you take on it.
The same five timeframe panel you have just read runs on your own EUR USD chart in MetaTrader. It is in the EURUSD Edition at seven dollars, which is the cheapest way to put it on a chart and watch it work for yourself, and in the Forex Majors Edition if you want the other six majors with it. If the mechanism behind the trailing level is the part you want to understand properly, start with our guide to moving a stop to break even.
Questions About Today’s EUR USD Board
Eight questions this particular board answers, with the numbers from the panels above.
Why did a EUR USD trade lose today when every timeframe agreed on the direction?
Because agreement tells you the direction and the stop distance tells you how much room the plan has. Both are on the ticket, and they are separate questions.
On 14 October 2026 the daily, four hour, one hour, thirty minute and fifteen minute charts on EUR USD all read DOWN at the same time. Inside that agreement, the fifteen minute ticket entered a sell at 1.12053 with an original stop at 1.12113, which is only 6.0 pips of room. It closed at its trailing level of 1.12108 with no targets reached.
The direction was correct. Price went on to trade at 1.1191, which is 14.3 pips below that entry and past what would have been its first and second targets. The ticket was closed and dimmed before price got there. Six pips was not enough room to survive the path to a move that was going the right way.
What does Closed at trailing stop mean on the Direction Sniper panel?
It means price closed through the trailing level and the plan is over. The ticket dims, the levels freeze where they stood, and the status line says so.
It does not tell you whether the exit was a gain or a loss. For that you compare the trailing level with the signal entry. On the EUR USD fifteen minute ticket on 14 October 2026 the level froze at 1.12108 against an entry of 1.12053. On a sell, a level above the entry means the exit sat behind the entry, so that was a losing exit.
The original stop on that ticket was 1.12113. The trailing level closed it at 1.12108, half a pip tighter. On a trade that never develops, a trailing level does very little, because it tightens with the structure behind the trade and that structure never tightened.
Which timeframe should I trade on EUR USD?
The one whose stop distance your account can carry at a sensible size. That is a different question from which one is best, and it has a number attached to it.
The four EUR USD tickets on 14 October 2026 carried stops of 6.0 pips on the fifteen minute, 11.6 on the thirty minute, 19.9 on the one hour and 36.6 on the four hour. Each one is close to double the one above it, because each chart builds larger structure than the one below it.
Faster charts give you tighter stops and more signals, and they are stopped out by movement that a slower chart does not even register. Slower charts give you far more room and far fewer signals, and they need a much smaller position for the same money at risk. Pick the one you can size correctly and then stay on it long enough to judge it.
Why is the stop distance different on every timeframe?
Because the stop is placed where that particular chart says the trade is wrong, and every timeframe measures structure at a different scale.
A fifteen minute chart builds small swings, so the level that invalidates a fifteen minute signal sits close to the entry. A four hour chart builds large ones, so its level sits far away. On EUR USD on 14 October 2026 that produced 6.0 pips of risk on the fifteen minute and 36.6 on the four hour, on the same pair, in the same direction, on the same afternoon.
The targets follow from whatever that distance is. They are placed at one, two and three times the risk the moment the ticket prints, so a wide stop also produces far distant targets.
How do I work out my lot size from the stop on the ticket?
Divide the money you are willing to risk by the stop distance multiplied by the value of a pip per lot. Lot size equals risk in money divided by stop distance times pip value per lot.
On EUR USD one standard lot is roughly ten dollars a pip. Putting fifty dollars of risk through the four stop distances published on 14 October 2026 gives about 0.83 lots on the fifteen minute, 0.43 on the thirty minute, 0.25 on the one hour and 0.14 on the four hour.
The fifteen minute ticket needs about six times the size of the four hour ticket to risk the same fifty dollars. That is why sizing by habit is expensive: the tightest stop produces the largest position, and the tightest stop is also the one most likely to be reached. Pip and contract values vary between brokers, so check your own.
What does All targets reached mean on the EUR USD four hour ticket?
It means price touched all three published target levels, so the plan is complete. The ticket dims, the trailing level freezes where it stood, and nothing on it should be acted on afterwards.
The EUR USD four hour ticket entered a sell at 1.13662 on 29 September 2026 with an original stop at 1.14028, which is 36.6 pips of risk. Targets at 1.13296, 1.12930 and 1.12564 were all reached, and the trailing level froze at 1.13659.
Price reaching a published target level is not the same as a realised result. It means price touched that level on the chart. It says nothing about whether a position existed, at what size, or what was done at each level.
Does Direction Sniper move my stop loss for me?
No. It is an indicator, not a trade manager. It calculates the trailing level, prints it on the ticket, and changes the row label from STOP LOSS to TRAILING STOP once that level has moved.
Adjusting the stop on your actual order is your job. Nothing changes on your account until you change it.
On the live EUR USD tickets on 14 October 2026 both labels still read STOP LOSS, on the thirty minute at 1.12111 and the one hour at 1.12135. That word tells you at a glance that nothing has tightened and both plans are still carrying their full original risk.
Where is EUR USD trading today and what are the published levels?
EUR USD is trading at about 1.1191 on 14 October 2026, with the verdict reading SELL and every timeframe on the panel pointing down.
Below the market, the nearest published level is the thirty minute first target at 1.11879, followed by 1.11763 and 1.11648. The one hour targets sit further out at 1.11737, 1.11538 and 1.11340.
Above the market, the two live stops sit at 1.12111 on the thirty minute and 1.12135 on the one hour. That band is where both of those plans say they are wrong. These are levels the indicator published, not forecasts, targets or recommendations.
Trading foreign exchange carries a high level of risk and is not suitable for everyone. You can lose some or all of your invested capital. Nothing on this page is financial advice or a recommendation to trade. Direction Sniper is a software tool and an educational product. It is an indicator: it calculates and displays a trailing level and renames the ticket label, and it does not place, modify or close trades or move stop orders on any account. Every level quoted here was printed by the indicator on a live chart before price moved, and is reproduced as published. Price reaching a published target level is not the same as a realised result. A target shown as reached means price touched that level on the chart, and does not describe anyone’s trade, which depends on whether a position existed, at what size, and what was done at each level. The thirty minute and one hour positions described above were still open at the time of writing. Distances between levels, and all lot sizing figures, are arithmetic on published levels for illustration and are not a recommendation about how much anyone should trade. Contract and pip values vary between brokers, so check your own. Past performance does not guarantee future results.

