When To Move Stop Loss To Break Even
When to move stop loss to break even is one of the most searched questions in trading, and almost every answer you will find gives you a number.
Opening
When to move your stop loss to break even is one of the most searched questions in trading, and almost every answer you will find gives you a number.
Move it at one times risk. Move it after the first target. Move it once you are twenty pips up. Move it when you are comfortable.
Every one of those answers has the same flaw. They all measure profit, and break even is not a profit question. It is a structure question.
This page answers it with five real trading panels, captured on live charts across two different markets within hours of each other. Between them they show every state a stop can be in, including two that look identical on a profit and loss screen and are completely different trades.
By the end you will not need a rule of thumb, because you will be able to read the answer off the chart.
Why we publish this. Every level on this page was printed by our indicator on a live chart, at the moment it printed, before price did anything about it. Nothing is back tested and nothing is chosen after the fact. We show the plans that completed and the ones that did not. Nothing here is financial advice. Price reaching a published target level is not the same as a realised result.
1. What Break Even Actually Means
Break even is one price. It is the price you entered at.
A stop sitting exactly there would close the position for nothing. That is the whole definition, and everything else on this page follows from where your stop sits relative to that one number.
On a sell, your entry is above the market you want. So:
- A stop above your entry means a trigger closes you behind where you started. That is a loss.
- A stop below your entry means a trigger closes you in front of where you started. That is a gain.
On a buy, flip it.
This sounds obvious written down. It stops being obvious the moment a trade is running, because the number most traders are watching is the floating profit on the screen, and floating profit tells you nothing about where the stop is.
So a trailing stop has exactly two phases, and the difference between them decides what a trade is actually worth.
| Where the level sits | What a trigger does | |
|---|---|---|
| Phase one | Behind the entry | Closes at a loss, smaller than the original |
| Phase two | In front of the entry | Closes at a gain |
The crossing point between those two phases is break even.
A trade can be deep in floating profit and still be in phase one. A trade can be barely in profit and already be in phase two. The five panels below show both, with real numbers.
2. State One: Nothing Has Moved Yet
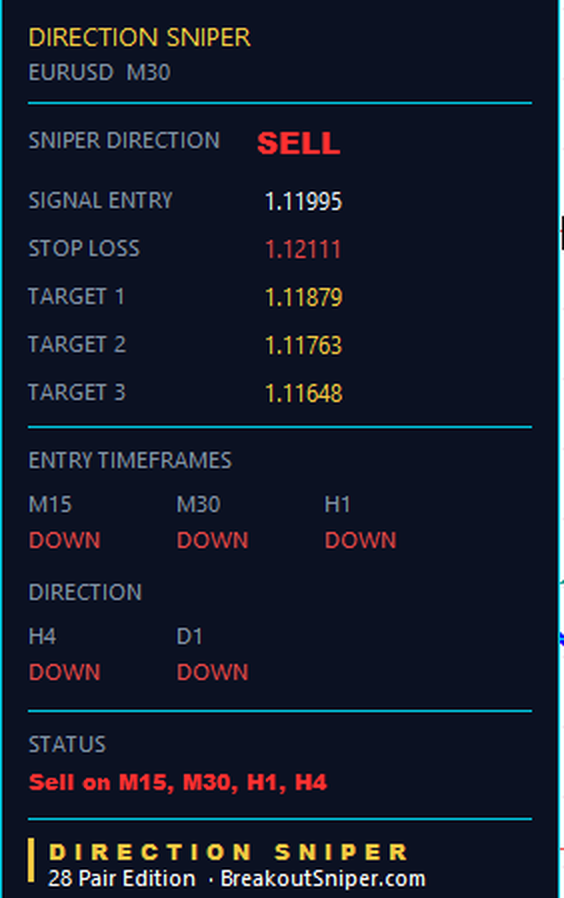
| Level | |
|---|---|
| Entry, sell | 1.11995 |
| Stop | 1.12111, so 11.6 pips of risk |
| Target 1 | 1.11879 |
| Target 2 | 1.11763 |
| Target 3 | 1.11648 |
| Label | STOP LOSS |
This is where every trade begins and most trades stay.
The row still reads STOP LOSS, not TRAILING STOP. That one word is the most useful thing on this panel, because it tells you at a glance that nothing has tightened and the plan is carrying its full original risk.
When this was captured, price had moved 8.7 pips in favour, which is three quarters of the way to the first target. The trade was comfortably in profit on a screen, and the stop had not moved one point.
This is the single most common moment for a trader to make the mistake this page exists to prevent. Three quarters of the way to target one feels like a trade that has proved itself. It has not. The chart behind it has not built anything new yet, so there is nothing for a level to tighten against.
3. State Two: It Moved, And It Is Still A Losing Level
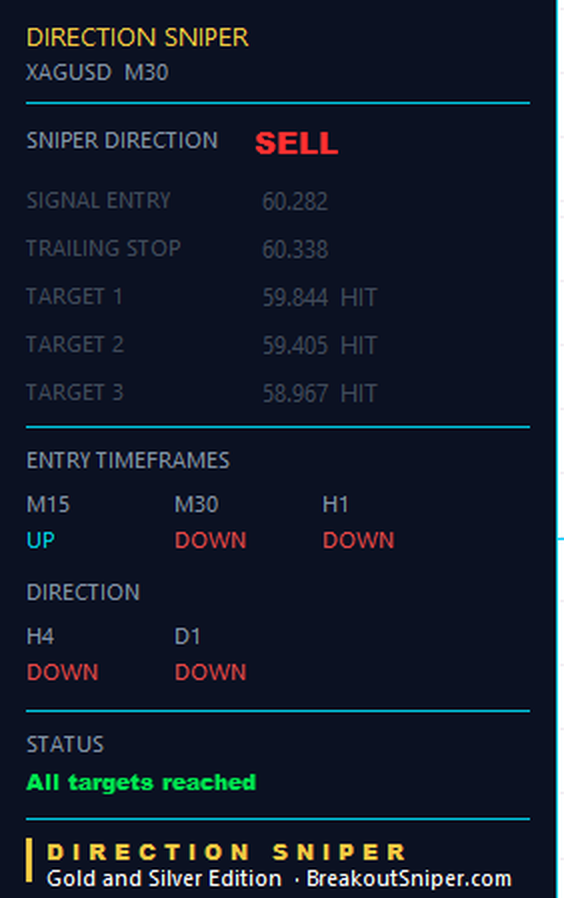
| Level | |
|---|---|
| Entry, sell | 60.282 |
| Original stop | 60.720, so 0.438 of risk |
| Target 1 at 59.844 | reached |
| Target 2 at 59.405 | reached |
| Target 3 at 58.967 | reached |
| Trailing stop, frozen | 60.338 |
| Status | All targets reached |
Read the trailing stop against the entry.
60.338 against 60.282. On a sell, that level is 0.056 above the entry. It is still a losing level. It never crossed break even.
And yet every target on this ticket was reached. The entire plan completed, all three levels, start to finish, and the trailing stop spent the whole trade in phase one.
It did tighten. It travelled 0.382 of the original 0.438, which is 87 per cent of the distance. It just ran out of trade before it ran out of distance.
If you were waiting for the stop to reach break even before relaxing, you would have waited through a completed plan and never got there.
4. State Three: It Moved, Stayed Behind, And Triggered
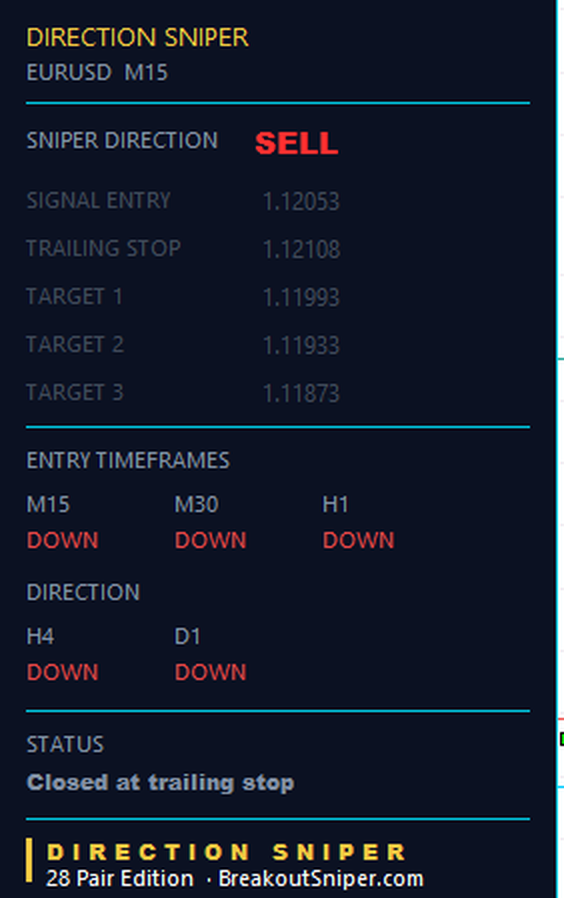
| Level | |
|---|---|
| Entry, sell | 1.12053 |
| Original stop | 1.12113, so 6.0 pips of risk |
| Target 1 | 1.11993, not reached |
| Target 2 | 1.11933, not reached |
| Target 3 | 1.11873, not reached |
| Trailing stop, frozen | 1.12108 |
| Status | Closed at trailing stop |
Same phase as the panel above. Completely different ending.
The level froze at 1.12108 against an entry of 1.12053, which is 5.5 pips above the entry on a sell. Phase one, start to finish. And this time it triggered.
Here is the honest arithmetic. The original stop was 1.12113. The trailing level closed the trade at 1.12108. It saved half a pip.
That is not a failure of the trailing level. It is what a trailing level does on a trade that never develops. It tightens with the structure behind the trade, and on this ticket the structure never tightened, because the trade never got going.
This is the panel that kills the phrase “my stop is at break even so I cannot lose”. The status line says closed. The level was 5.5 pips behind the entry when it closed. Both are true at once.
And the part worth sitting with. The direction on this ticket was right. Price went on to trade well past where target one and target two had been, more than twice the original risk, with this ticket already closed and dimmed. It was not wrong about where the market was going. It had six pips of room to be right in.
5. State Four: It Crossed, With Nothing To Show For It
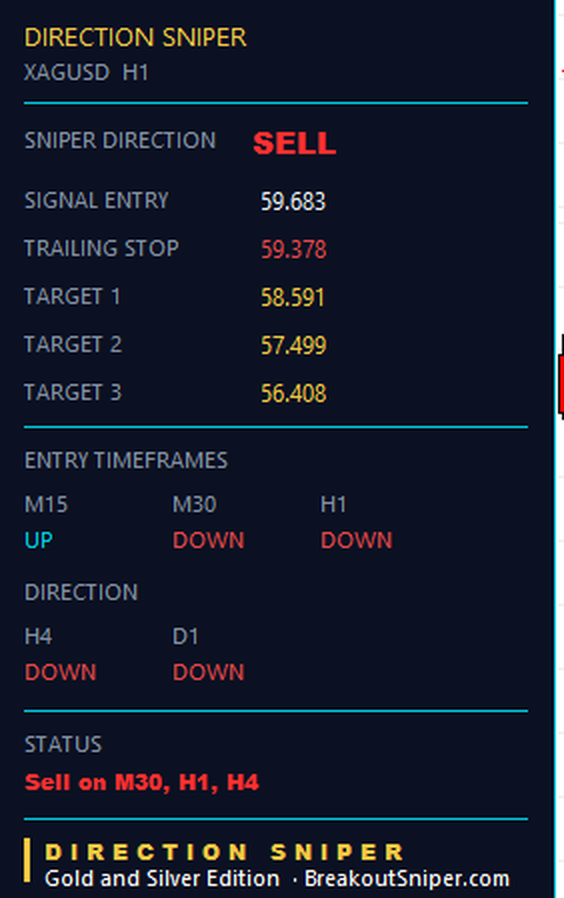
| Level | |
|---|---|
| Entry, sell | 59.683 |
| Original stop | 60.775, so 1.092 of risk |
| Target 1 | 58.591, not reached |
| Target 2 | 57.499, not reached |
| Target 3 | 56.408, not reached |
| Trailing stop | 59.378 |
| Status | Live |
Now the exact inverse of state two.
59.378 against an entry of 59.683. On a sell, that level sits 0.305 in front of the entry. It is past break even. A trigger from there closes the position in front of where it began.
And not one target has been touched.
The level travelled 1.397 to get there, which is 128 per cent of the original risk. It crossed, and it kept going, on a ticket that has not reached a single one of its three published levels.
Now put this panel next to the one in section three. Same metal, same morning, two charts on the same instrument.
| Silver M30 | Silver H1 | |
|---|---|---|
| Targets reached | All three | None |
| Trailing stop against entry | 0.056 behind | 0.305 in front |
| Past break even? | No | Yes |
Exact inversion. The ticket that reached everything never crossed. The ticket that reached nothing crossed early.
If targets and the trailing level were measuring the same thing, that table would be impossible.
6. State Five: The Crossing Point Itself
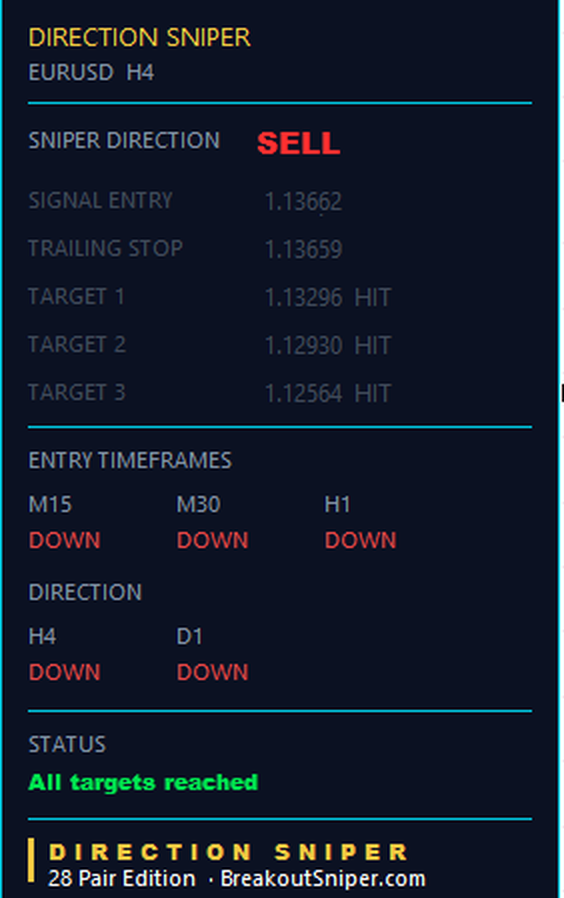
The panel at the top of this page is a completed four hour ticket.
| Level | |
|---|---|
| Entry, sell | 1.13662 |
| Original stop | 1.14028, so 36.6 pips of risk |
| Target 1 at 1.13296 | reached |
| Target 2 at 1.12930 | reached |
| Target 3 at 1.12564 | reached |
| Trailing stop, frozen | 1.13659 |
1.13659 against an entry of 1.13662.
Three tenths of a pip past break even. That is the crossing point, caught almost exactly, at the moment the third target was reached.
By then price had travelled 109.8 pips from the entry. The trailing level had travelled 36.9. One number moved three hundred times further than the other, and they were both correct, because they were answering different questions the whole time.
7. When To Move Stop Loss To Break Even: The Actual Answer
Put the five panels together and the answer falls out.
Targets measure distance. They are fixed at one, two and three times the risk the moment the plan is made, and they never move again. Price either travels that far or it does not.
The trailing level measures structure. It tightens when the chart behind the trade tightens. How far price has travelled is not what it is watching.
That is why a tight stop can reach every target while its level never crosses, and a wide stop can cross early while its targets sit untouched. You have now seen both, on the same metal, within hours of each other.
Which gives you the actual answer to the question in the title.
You do not decide when to move your stop to break even. The structure of the chart decides, and your job is to read where it currently is.
Not when you are up twenty pips. Not after the first target. Not when you feel comfortable. The level crosses when the chart behind the trade has built enough new structure to justify it, and on some trades that happens before the first target and on others it never happens at all.
8. The Three Mistakes This Prevents
Moving to break even because you are in profit. This is the big one. Floating profit and stop position are unrelated numbers. Moving the stop to your entry the moment a trade shows green takes a plan with room in it and converts it into a plan with no room, which turns working trades into scratches. The Silver M30 ticket in section three would almost certainly have been scratched out of a plan that reached all three of its targets.
Believing that “my stop is at break even” means you cannot lose. Section four is the counter example and it has a status line to prove it. Phase one is phase one no matter how good the trade looks.
Moving a stop further away. Nothing on this page suggests widening a stop, ever. A trailing level only ever tightens. If a trade needs more room than the plan gave it, that is information about the trade, not an invitation to renegotiate.
9. The Thing That Actually Protects You
Every example above is about where a level sits. None of it matters if the position is the wrong size.
Look at the four stop distances on this page.
6.0 pips     the fifteen minute in section four
11.6 pips    the thirty minute in section two
36.6 pips    the four hour in section six
0.438        the silver thirty minute
1.092        the silver one hour
At fifty dollars of risk on a pair worth roughly ten dollars a pip, the six pip stop needs about 0.83 lots and the 36.6 pip stop needs about 0.14. The tightest stop needs six times the size. And the tightest stop is also the one most likely to be reached.
Which means a trader who uses the same lot size on every chart takes his largest position on his most fragile trade, every single time.
The formula never changes, on any instrument:
lot size = risk in money / ( stop distance x value of one point per lot )Read the stop distance off the plan. Divide. Take that number. Contract and point values differ between brokers, so check your own specification before you trade.
A stop tells you where you are wrong. The lot size tells you what being wrong costs. Only one of those is yours to choose.
10. How The Panels On This Page Work
Every panel above comes from Direction Sniper, our MetaTrader indicator. It reads five timeframes on one chart, gives a single verdict, and when a signal agrees with that verdict it prints a complete plan: an entry, a stop, and three targets measured from that trade’s own risk.
As the chart develops it recalculates the trailing level, prints it on the plan, and changes the row label from STOP LOSS to TRAILING STOP once that level has moved. That label change is what lets you answer this page’s question at a glance instead of working it out.
One thing to be clear about. It is an indicator. It calculates and displays the level. It does not place, modify or close trades, and it does not move stop orders on your account. You adjust your own order to match. Nothing moves until you move it.
We publish a read like this most trading days, across gold and silver, the major currency pairs, and Bitcoin and Ethereum, with the panels included. They are free and you can check every number on them yourself.
- Gold and Silver Edition
- Forex Majors Edition
- Bitcoin and Ethereum Edition
- EURUSD Edition, the cheapest way to put the panel on a chart and watch it work for yourself
The Short Version
Break even is one price: your entry. A stop behind it closes at a loss. A stop in front of it closes at a gain. The crossing point between those two is the only break even there is.
Your trailing level crosses that point when the chart behind the trade tightens enough to justify it. Not when you are in profit. Not after a target. Not when you feel ready.
Read the number, compare it to your entry, and you will know exactly what your trade is worth right now. That is the whole answer.
Break Even Stops, Answered
Nine questions traders ask about moving a stop to break even, answered with the levels from the panels above.
When should you move your stop loss to break even?
You do not choose the moment. The structure of the chart behind the trade decides it, and your job is to read where the level currently sits.
Most advice gives you a profit rule: move it at one times risk, move it after the first target, move it once you are twenty pips up. All of those measure how far price has travelled, and break even is not a distance question. A trailing level tightens when the chart builds new structure behind the trade, which can happen before the first target on one plan and never happen at all on another.
The practical rule is to compare the current stop level with your entry price. If it sits behind the entry, a trigger is a loss. If it sits in front, a trigger is a gain. That one comparison is the answer, and it is available at any moment.
What does break even actually mean on a trade?
Break even is a single price: the price you entered at. A stop sitting exactly there would close the position for nothing.
On a sell, a stop above your entry means a trigger closes you behind where you started, which is a loss. A stop below your entry means a trigger closes you in front, which is a gain. On a buy it is the other way round.
This is why floating profit on your screen tells you nothing about whether you are protected. The two numbers are unrelated. Only the stop level against the entry price answers the question.
Can a trade reach all its targets and still have a stop that never reached break even?
Yes, and it is more common than most traders expect. A completed plan and a stop that never crossed are not a contradiction.
One silver plan on this page entered a sell at 60.282 with an original stop at 60.720, which is 0.438 of risk. All three targets at 59.844, 59.405 and 58.967 were reached. The trailing level finished at 60.338, which on a sell is 0.056 above the entry and therefore still a losing level.
The level did tighten. It travelled 0.382 of the 0.438, which is 87 per cent of the distance. It simply ran out of trade before it ran out of distance. Anyone waiting for that stop to reach break even would have waited through a completed plan and never got there.
Can a stop cross break even on a trade that has reached no targets at all?
Yes. A plan with a wide stop can have its level cross the entry long before price travels far enough to reach the first target.
A silver one hour plan on this page entered a sell at 59.683 with an original stop at 60.775, which is 1.092 of risk. Not one of its targets at 58.591, 57.499 and 56.408 had been reached, and the trailing level already sat at 59.378, which is 0.305 in front of the entry.
That level travelled 1.397 to get there, which is 128 per cent of the original risk, on a plan with nothing reached. It is the exact inverse of the thirty minute plan on the same metal, captured within hours of it.
Why do targets and the trailing stop move independently?
Because they are measuring two different things, and neither one is a measure of the other.
Targets measure distance. They are fixed at one, two and three times the risk the moment the plan is made, and they never move again. Price either travels that far or it does not, and nothing about the chart changes where they sit.
The trailing level measures structure. It tightens when the chart behind the trade tightens. How far price has travelled is not what it is watching. That is why a tight stop can reach every target while its level never crosses, and a wide stop can cross early while its targets sit untouched.
Is it safe to say I cannot lose once my stop is at break even?
No, and the phrase causes real damage because traders use it before the level has actually crossed.
A plan on this page closed at its trailing level of 1.12108 against an entry of 1.12053. On a sell, that level sat 5.5 pips behind the entry, so the exit was behind the entry. The original stop was 1.12113, which means the trailing level saved half a pip and nothing more.
A trailing level only protects a gain once it has crossed the entry price. Before that it reduces a loss, which is worth having and is not the same thing. Check the number against your entry rather than trusting the feeling that a trade has proved itself.
What is the most common mistake with break even stops?
Moving the stop to the entry price simply because the trade is showing a profit.
Floating profit and stop position are unrelated numbers. Moving a stop to the entry the moment a trade turns green takes a plan that had room in it and converts it into a plan with no room, which turns working trades into scratches.
The silver thirty minute plan described on this page reached all three of its targets while its trailing level was still above the entry the entire time. A trader who had moved that stop to the entry early would very likely have been scratched out of a plan that completed in full.
Does the indicator move my stop loss for me?
No. Direction Sniper is an indicator, not a trade manager. It calculates the trailing level, prints it on the plan, and changes the row label from STOP LOSS to TRAILING STOP once that level has moved.
Adjusting the stop on your actual order is your job. It does not place, modify or close trades, and nothing changes on your account until you change it.
The label itself is useful on its own. A row still reading STOP LOSS tells you at a glance that nothing has tightened and the plan is carrying its full original risk, however good the trade looks on screen.
How does the stop distance affect my position size?
Directly, and it is where most of the money is won or lost. Lot size equals risk in money divided by the stop distance multiplied by the value of one point per lot.
The plans on this page carry stops of 6.0, 11.6 and 36.6 pips. At fifty dollars of risk on a pair worth roughly ten dollars a pip, that is about 0.83 lots, 0.43 lots and 0.14 lots. The tightest stop needs about six times the size of the widest one.
The tightest stop is also the one most likely to be reached, so a trader using the same lot size on every chart takes the largest position on the most fragile plan every time. Contract and point values vary between brokers, so check your own specification.
DISCLAIMER
Trading foreign exchange, metals, cryptocurrencies and other leveraged products carries a high level of risk and is not suitable for everyone. You can lose some or all of your invested capital. Nothing on this page is financial advice or a recommendation to trade. Direction Sniper is a software tool and an educational product. It is an indicator: it calculates and displays a trailing level and renames the panel label, and it does not place, modify or close trades or move stop orders on any account. Every level shown here was printed by the indicator on a live chart before price moved, and is reproduced as published. Price reaching a published target level is not the same as a realised result. A target shown as reached means price touched that level on the chart, and does not describe anyone’s trade, which depends on whether a position existed, at what size, and what was done at each level. Some of the positions described above were still open at the time of writing. Distances between levels, and all lot sizing figures, are arithmetic on published levels for illustration and are not a recommendation about how much anyone should trade. Contract and point values vary between brokers, so check your own. Past performance does not guarantee future results.

