EUR USD Forecast Today, 12 October 2026: All Three Targets Reached, And The Trailing Stop Was Still At Break Even
Executive Summary
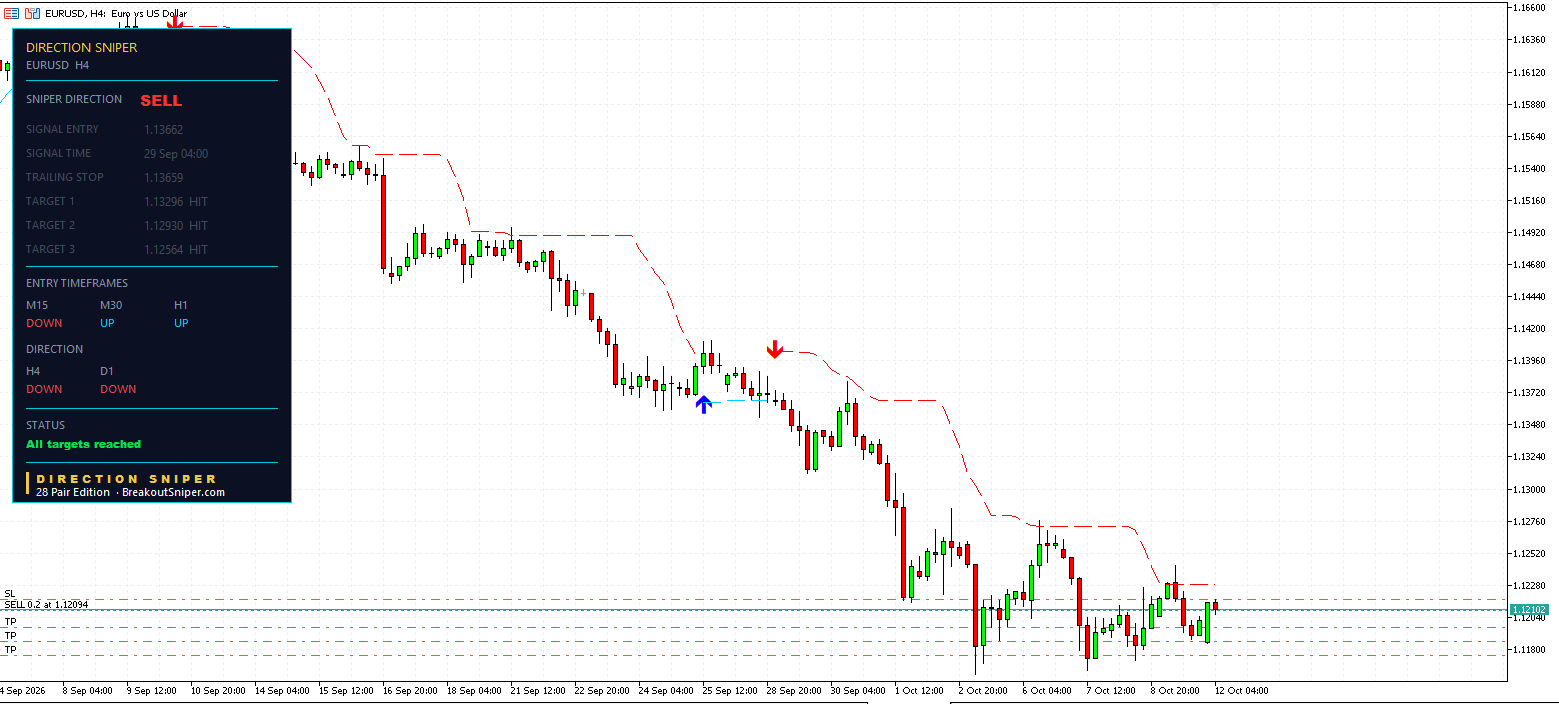
The four hour EUR USD ticket that entered on 29 September has finished. All three targets reached. The panel dims the ticket, freezes the stop and says so.
And here is the number that makes this worth reading rather than just looking at. At the moment target three was touched, the trailing stop stood at 1.13659. The entry was 1.13662.
The trail had crossed break even by three tenths of a pip. That is all. Price had travelled 109.8 pips by then. The trailing level had travelled 36.9.
EUR USD is trading at 1.12100.
| Chart | Direction | Ticket |
|---|---|---|
| D1 | DOWN | sets the verdict, unchanged since 29 September |
| H4 | DOWN | sets the verdict. All three targets reached |
| H1 | UP | none |
| M30 | UP | none |
| M15 | DOWN | live sell at 1.12070 |
One live ticket out of three entry charts, and one completed plan above them.
Why we publish this. Every entry, stop and target below is a level the indicator printed on a live chart, at the moment it printed, before price did anything about it. Nothing is back tested. Nothing is chosen after the fact. We publish the tickets that worked and the ones that did not, because a page that only shows you the winners teaches you nothing you can use. The point is to show how the panel is read and how position size follows from a stop. These are not trade recommendations and nothing here is financial advice.
And the line that matters most on a page like this one. Price reaching a published target level is not the same as a realised result. Whether anyone was in this trade, at what size, and what they did at each of those three levels, is theirs and not ours. What follows is arithmetic on levels, nothing more.
1. The Completed Ticket
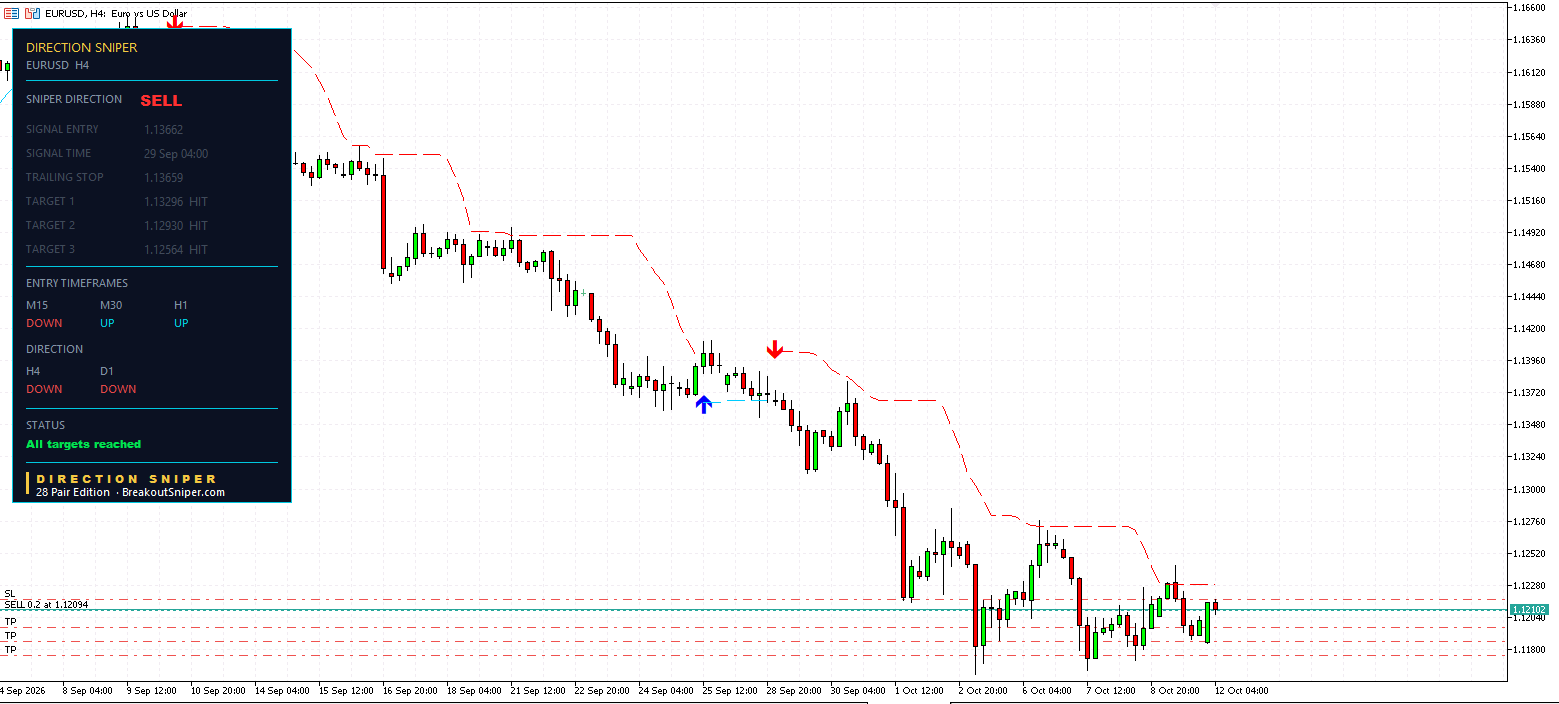
| Level | |
|---|---|
| Entry, sell | 1.13662 on 29 September at 04:00 |
| Original stop | 1.14028, so 36.6 pips of risk |
| Target 1 at 1.13296 | reached |
| Target 2 at 1.12930 | reached |
| Target 3 at 1.12564 | reached |
| Trailing stop, frozen | 1.13659 |
| Status | All targets reached |
The arithmetic reconstructs exactly. One unit of risk is 36.6 pips, measured from the entry to the original stop. Target one sits one unit away, target two sits two, target three sits three. Put 36.6 into that and every published level comes back to the point.
Why the ticket is dimmed. The plan only ever promised three targets. Taking the third completes it, so the indicator ends the ticket there rather than leaving a stop running with nothing left to protect. Every number greys out, the stop freezes where it stood, and the status changes. A finished trade can never be mistaken for a live one.
2. The Trailing Stop Was At Break Even. That Is Not A Failure.
This is the part worth slowing down for, because it answers a question thousands of traders type into Google every month and almost nobody answers with a real chart.
Should you use a trailing stop or take profit targets?
Look at what actually happened here.
The trailing level started at 1.14028 and finished at 1.13659. It travelled 36.9 pips across the whole life of the ticket. In that same time, price travelled 109.8 pips to target three.
The trail was nowhere near the money. It was never trying to be.
They are two different jobs.
The targets bank. They sit at fixed distances, one, two and three units away, decided the moment the ticket printed. They are how the plan converts a move into something finished.
The trail protects. It walks the worst case down. At entry, the worst case on this ticket was a 36.6 pip loss. By the time target three arrived, the worst case was roughly flat. That is the entire contribution, and it is a large one.
A trader who expects a trailing stop to collect the profit will be disappointed every time, and will usually respond by tightening it until it is a hair trigger that gets taken out on the first pullback. A trader who understands the trail is a shrinking worst case leaves it alone and lets the targets do the collecting.
What the tool does for you here: both numbers are on the same panel at the same time. The three fixed targets, and the trailing level recalculated as structure tightens. You can watch the worst case shrink while the targets sit still. What the indicator does not do is move the order on your platform. That click is yours.
We have written the mechanism up in full, with worked examples, in our guide to when to move your stop loss to break even.
3. The Honest Half
Price is 1.12100 this morning. The entry was 1.13662.
That is 156.2 pips in front of the entry, or 4.27 units of risk.
The plan promised three. The move gave four and a quarter. Target three at 1.12564 is now 46.4 pips behind price.
So the ticket ended before the move did, and we are going to say that plainly rather than leave it out of a post that otherwise looks very good.
That is the cost of having a plan. It is the same trade off as the trailing stop, pointing the other way. A plan with fixed targets will sometimes finish early on the moves that keep running. In exchange, it finishes at all, on a schedule decided before you were emotionally involved, instead of leaving you holding a position with no rule for getting out of it.
Nobody can tell you in advance which trades will keep going. Anyone who can does not need targets or a stop.
4. What Is Actually Live Right Now
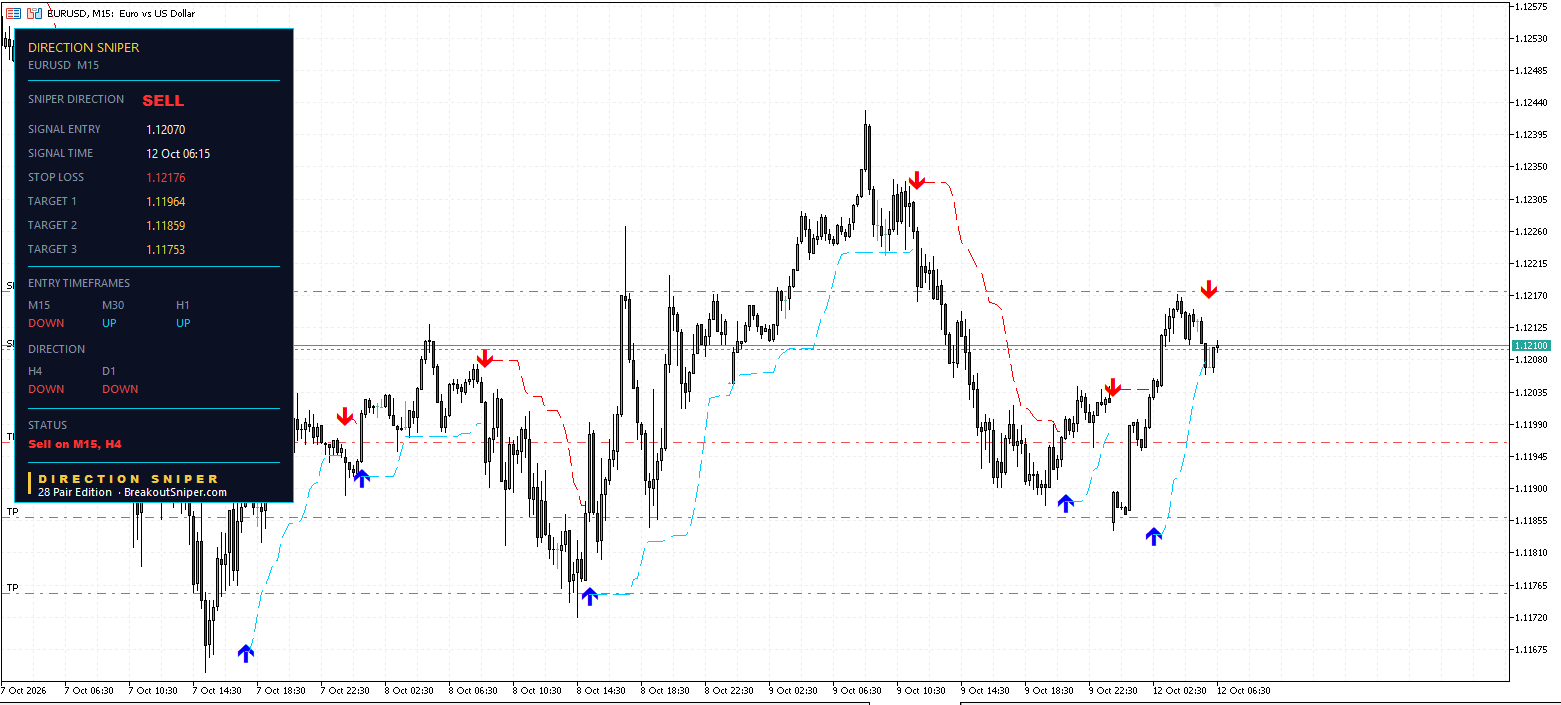
One ticket. The fifteen minute.
| Level | |
|---|---|
| Entry, sell | 1.12070 on 12 October at 06:15 |
| Stop loss | 1.12176, so 10.6 pips of risk |
| Target 1 | 1.11964 |
| Target 2 | 1.11859 |
| Target 3 | 1.11753 |
Price at 1.12100 is 3.0 pips behind that entry, with 7.6 pips left to the stop.
Measured properly, that is 28% of its risk spent. Divide the distance from your entry to the current price by the distance from your entry to your stop, and you have the fraction of your own risk that has gone. It is the only number that compares two different trades fairly, and it is available to you only because the stop arrives measured.
The label still reads STOP LOSS rather than TRAILING STOP, which tells you the level has not moved from where the signal placed it. Nothing has trailed yet.
5. Two Charts Have Nothing, And The Verdict Has Not Moved In Two Weeks
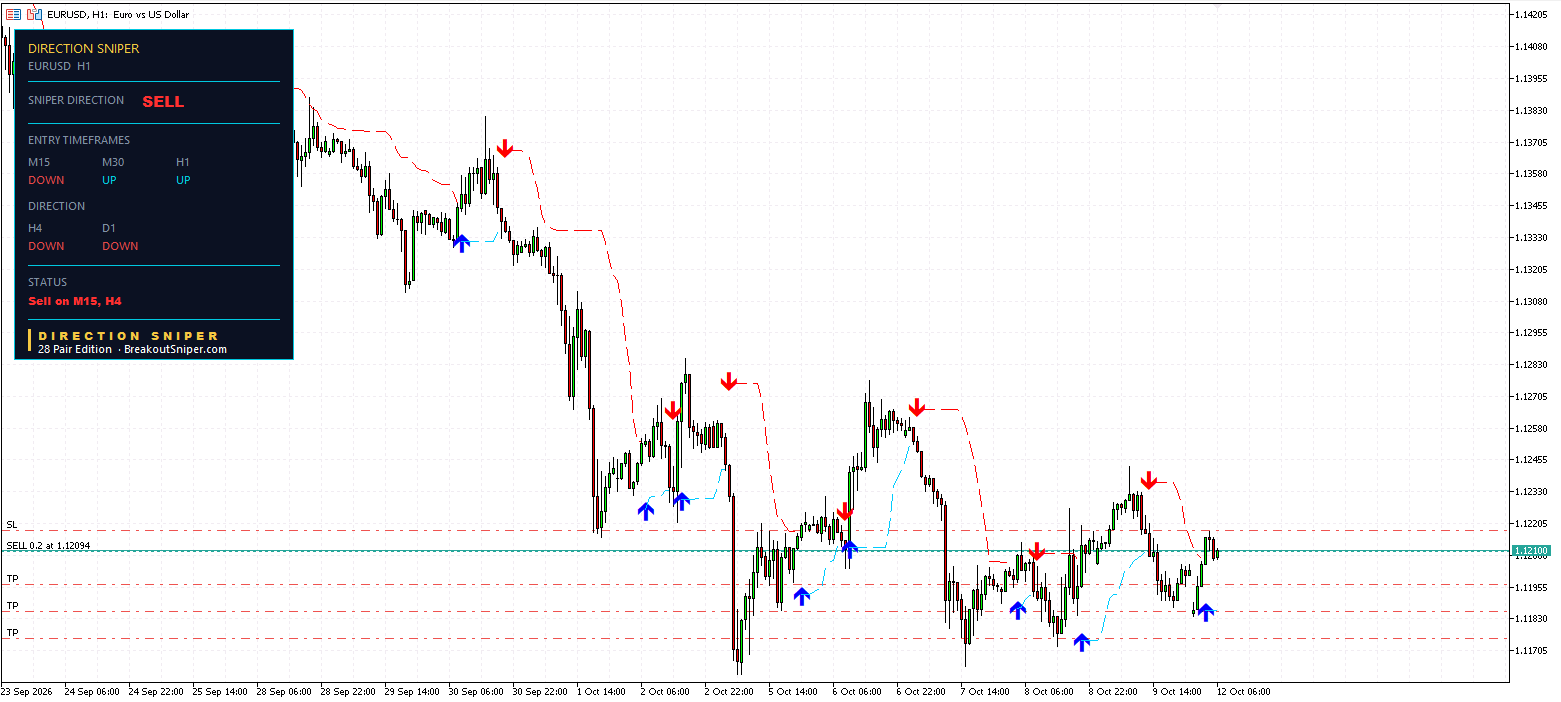
The thirty minute and the one hour are both pointing up. Neither carries a ticket, because the panel will not build a sell on a chart that is currently pointing the other way. Both status lines read the same thing: Sell on M15, H4.
Meanwhile the daily and the four hour have read SELL since 29 September. Thirteen days. One direction.
That is the structure the whole thing rests on. The two slowest charts set the verdict and hold it. The three fastest charts are allowed to disagree, and when they do they simply produce nothing. The disagreement never changes the direction, it only changes how many entries exist.
Two of three entry charts with nothing is not the tool failing. It is the tool declining to manufacture a reason to trade.
6. Where The Lot Size Comes From, And Why Today Shows It Clearly
Today gives you two tickets with very different stops, which makes the point better than any explanation.
H4: 36.6 pips. M15: 10.6 pips.
The calculation is always the same. Your risk in money, divided by the stop distance, divided by what one pip is worth per lot. On EUR USD one standard lot is about ten dollars a pip.
On a ten thousand dollar account risking half a percent, which is fifty dollars:
| Ticket | Stop | Lot at $50 risk |
|---|---|---|
| H4 | 36.6 pips | about 0.14 |
| M15 | 10.6 pips | about 0.47 |
Three and a half times the position size, for exactly the same money at risk.
A trader using one fixed lot on both would have risked three and a half times more on the four hour than on the fifteen minute, without ever deciding to. That is how accounts get damaged by a trade that was read correctly.
The lot size is the protection. Not the stop, not the targets, not the direction. The stop tells you where you are wrong. The lot size decides what being wrong costs. Everything else on this page is secondary to that one number.
What the tool does for you here: the stop arrives measured in pips on every ticket, on every timeframe, at the moment it prints. That number is the only input the calculation needs.
Where The Levels Sit Now
With EUR USD at 1.12100:
1.12176 is the stop on the live fifteen minute ticket, 7.6 pips above price.
1.11964, 1.11859 and 1.11753 are its three targets, sitting 13.6, 24.1 and 34.7 pips below price.
1.12564 is where the four hour ticket completed. Price is 46.4 pips beyond it, so it is history rather than a level to trade against.
1.13659 is where that ticket’s trailing stop froze, 155.9 pips above price. It is on the page because of what it teaches, not because anything lives there now.
Those are the levels on the chart and how far price sits from each. None of it is a forecast.
What You Are Actually Buying
A verdict that holds while the fast charts change their minds. Thirteen days of SELL from the daily and the four hour, through a fortnight in which the thirty minute and one hour have flipped repeatedly.
Targets placed before you are emotionally involved. One, two and three units, printed at the moment the ticket arrives, not negotiated with yourself at hour six of a position.
A trailing level that shrinks the worst case while they do. On this ticket it walked 36.9 pips and finished just past break even. It was never going to collect the money. That was never its job.
A measured stop on every ticket, which is where the lot size comes from. 36.6 pips on one chart, 10.6 on another, on the same pair, on the same morning. Guess that and you are guessing the one number that decides what a bad day costs.
These four panels came from the 28 Pair Edition, $77, which runs every major, minor and cross. The same panel is also on:
- Gold and Silver Edition, the original and still the one most of our traders start with
- Forex Majors Edition, $47, the seven majors
- EURUSD Edition, $7, this pair on its own, which is the cheapest way to put the panel on a chart and watch it work for yourself
Direction Sniper prints all of it on your charts in MetaTrader and keeps it live. You still move the order on your platform yourself. The indicator does the arithmetic, the click is yours.
One question. Do you use targets, a trailing stop, or both? Tell us on the reviews and feedback page.
EUR USD Today: Common Questions
Is EUR USD a buy or a sell today?
On 12 October 2026 the Direction Sniper panel reads SELL on EUR USD, and it has read SELL since 29 September, because the daily and the four hour have both pointed down for thirteen days. One entry chart carries a ticket this morning, the fifteen minute. The thirty minute and the one hour both point up, so neither has one. This describes what the indicator displays and is not a recommendation to trade.
What does All Targets Reached mean on the panel?
It means price touched all three published target levels, so the plan the ticket set out is complete. The indicator ends the ticket at that point rather than leaving a stop running with nothing left to protect. Every number greys out, the stop freezes where it stood, and the status changes so a finished ticket can never be read as a live one. Price reaching a published target level is not the same as a realised result, because that depends on whether a position existed and what was done at each level.
Why was the trailing stop still at break even when target three was reached?
Because a trailing stop and a take profit target do two different jobs. The trail started at 1.14028 and finished at 1.13659, travelling 36.9 pips, while price travelled 109.8 pips to target three. The trail was walking the worst case down from a 36.6 pip loss to roughly flat. The targets were doing the collecting. A trader who expects the trail to gather the profit usually tightens it until it becomes a hair trigger taken out on the first pullback.
Should you use a trailing stop or take profit targets?
This ticket ran both at once, which is the clearest answer available. The three targets sat at fixed distances of one, two and three units of risk, decided the moment the ticket printed. The trailing level moved as structure tightened and shrank the worst case while they waited. Targets end a position on a schedule set before you are emotionally involved. A trail limits what the same position can cost. They are not alternatives, and nothing on this page is a recommendation about which to use.
Did the EUR USD move keep going after target three?
Yes, and we would rather say so than leave it out. Price is 1.12100, which is 156.2 pips below the 1.13662 entry, or 4.27 units of risk, against a plan that promised three. Target three at 1.12564 now sits 46.4 pips behind price. A plan with fixed targets will sometimes finish before the move does. In exchange it finishes at all, rather than leaving a position open with no rule for closing it.
What are the EUR USD key levels today?
With price at 1.12100, the live fifteen minute ticket carries its stop at 1.12176, which is 7.6 pips above price, and three targets at 1.11964, 1.11859 and 1.11753, sitting 13.6, 24.1 and 34.7 pips below. The completed four hour ticket finished at 1.12564 and its trailing stop froze at 1.13659, and neither of those is a live level any more. These describe where the indicator placed levels rather than forecasting what price will do.
Why do the thirty minute and one hour charts have no EUR USD signal?
Because both are currently pointing up while the verdict is to sell, and the panel will not build a sell ticket on a chart pointing the other way. Both status lines read Sell on M15, H4 and nothing else, so neither issues an entry, a stop or targets, and both wait for alignment. The disagreement never changes the direction set by the daily and the four hour. It only changes how many entries exist.
What lot size should you use on EUR USD?
Your risk in money divided by the stop distance, divided by what one pip is worth per lot, which on EUR USD is about ten dollars per standard lot. Today shows why it matters, because the two tickets have very different stops. On a ten thousand dollar account risking half a percent, the 36.6 pip four hour stop allows about 0.14 lots and the 10.6 pip fifteen minute stop allows about 0.47. A trader using one fixed lot on both would risk three and a half times more on one than the other without deciding to. These figures are arithmetic for illustration, not a recommendation about how much anyone should trade.
A live sell order placed by us is visible on these charts at 1.12094. We publish the charts as they are rather than cropping our own positions out of them.
Trading foreign exchange, gold and other leveraged products carries a high level of risk and is not suitable for everyone. The levels above describe where the indicator placed entries, stops and targets at the time the charts were read, and the status shown for each ticket is the status the panel displayed at that moment. Price reaching a published target level is not the same as a realised result. A target shown as reached means price touched that level on the chart. It does not describe anyone’s trade, because that depends on whether a position existed, at what size, and what was done at each level. Distances between an entry and a target are arithmetic on published levels and are not a statement of anyone’s result, which depends on position size, spread, slippage and how each trader manages an order. A stop is a level rather than a guarantee, and gaps or fast markets can fill you past it. Trailing a stop reduces the worst case on a position but also closes positions that may later have moved further. Lot sizing figures are arithmetic for illustration and are not a recommendation about how much anyone should trade. Nothing here is financial advice. Past performance does not guarantee future results.

