Bitcoin and Ethereum Price Forecast Today, 17 October 2026: Bitcoin Bounce Or Reversal?
How Direction Sniper Told The Difference Before Three Targets Were Reached
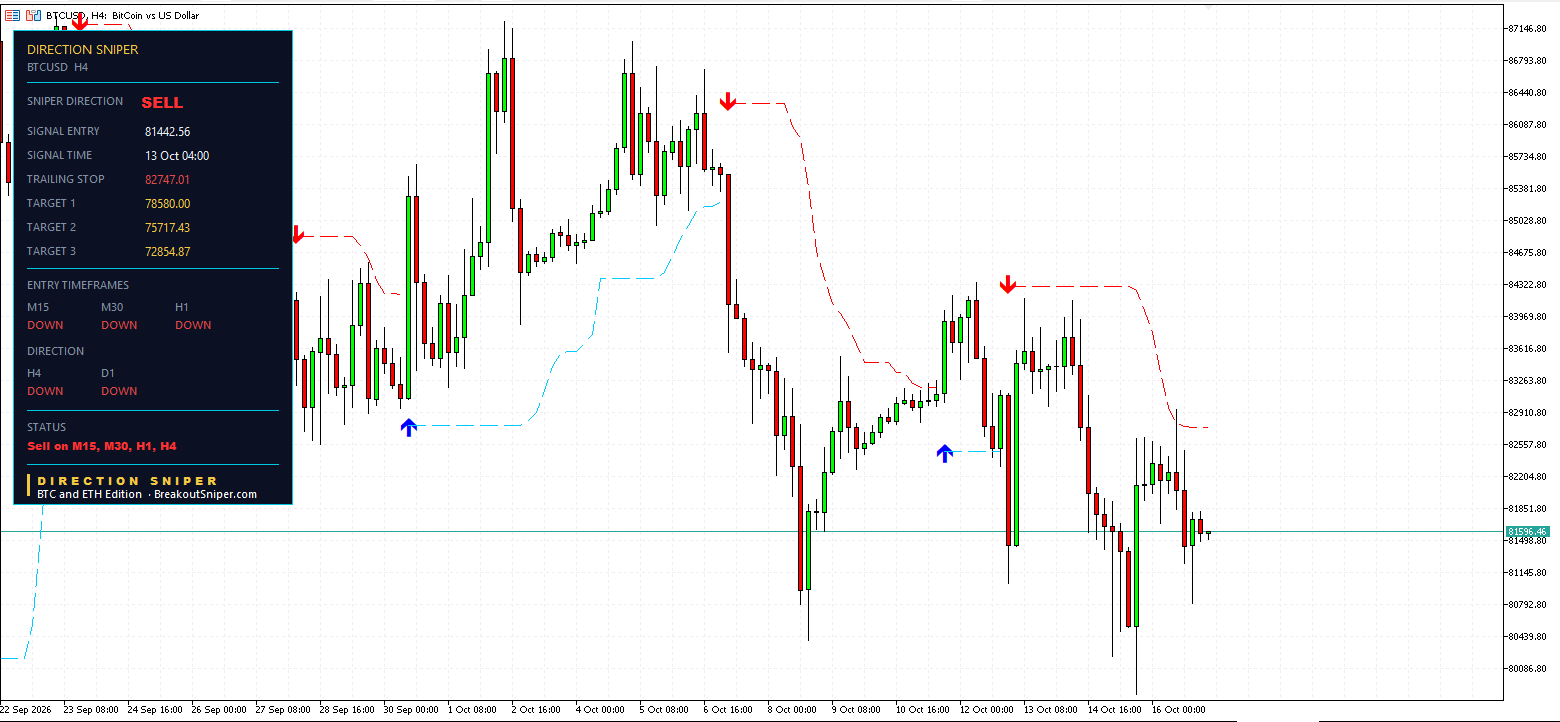
This Bitcoin and Ethereum price forecast today answers the question every crypto trader asks at least once a week: is this a bounce, or is the market turning?
On 15 October Bitcoin dipped to around 80,000. Then it rallied hard, to almost 82,900. Every fast chart flipped UP. On a 15 minute chart it looked exactly like a reversal.
The Direction Sniper panel never flipped. The 4 hour and the daily held DOWN the whole way, so the verdict stayed SELL. When the rally ran out, the panel lined up fresh sell tickets on the 1 hour and the 30 minute. Three targets have been reached since.
Ethereum followed the same path. And right now, the same test is playing out again on Ethereum’s 15 minute chart.
Here is the full board, every number, and how to tell a bounce from a reversal before you put money on it.
The Board At A Glance
| Coin | Chart | Entry | Stop or trailing level | Targets | State |
|---|---|---|---|---|---|
| Bitcoin | H1 | 81974.44 | 82116.42 (trailing) | 81442.34, 80910.25, 80378.15 | Targets 1 and 2 reached |
| Bitcoin | M30 | 81974.44 | 81807.01 (trailing) | 81200.82, 80427.19, 79653.57 | Target 1 reached, stop in front of entry |
| Bitcoin | M15 | 81643.08 | 81814.99 (stop loss) | 81471.17, 81299.26, 81127.35 | Fresh ticket |
| Bitcoin | H4 | 81442.56 | 82747.01 (trailing) | 78580.00, 75717.43, 72854.87 | Running since 13 October |
| Ethereum | M30 | 2439.13 | 2427.21 (trailing) | 2390.79, 2342.44, 2294.10 | Stop in front of entry |
| Ethereum | H1 | 2431.31 | 2459.24 (trailing) | 2387.24, 2343.18, 2299.11 | Running |
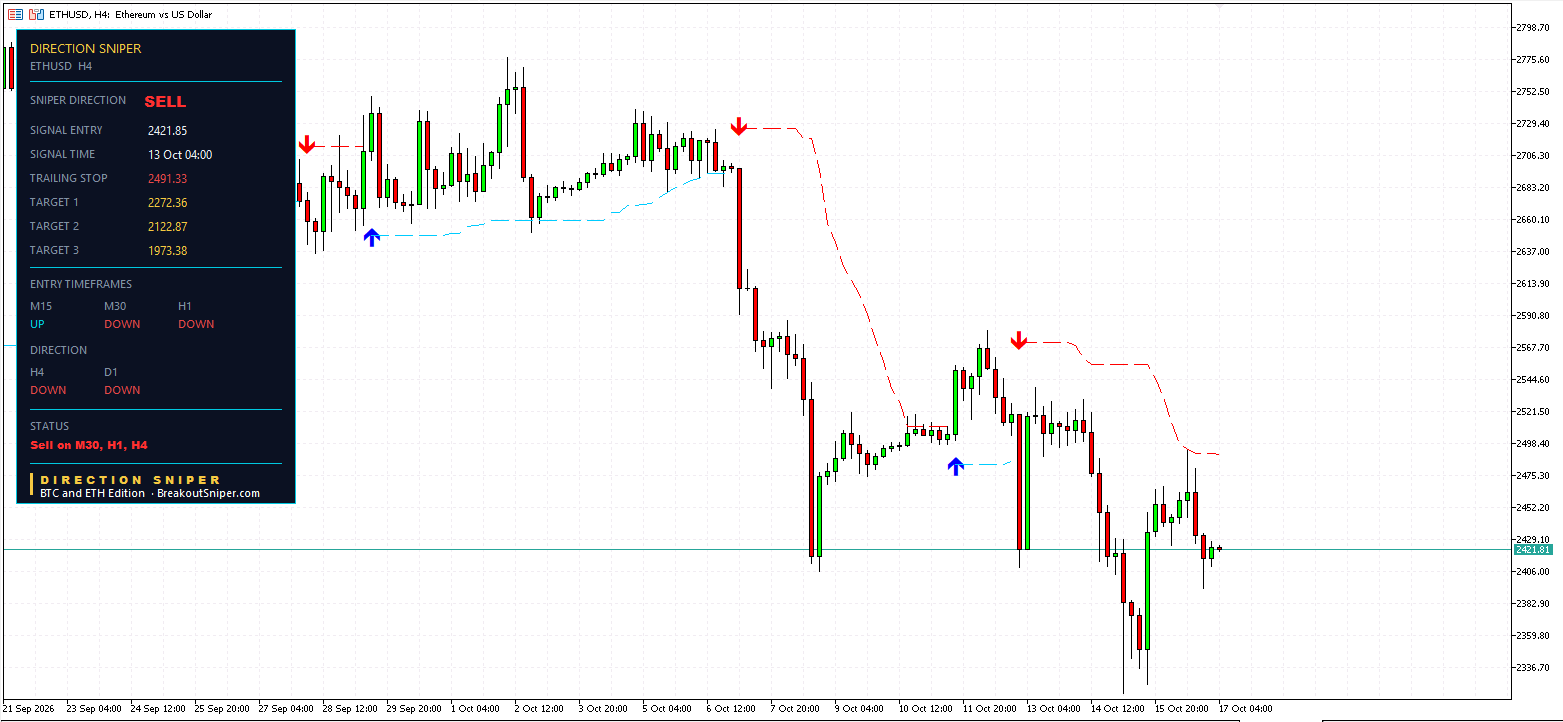
| Ethereum | H4 | 2421.85 | 2491.33 (trailing) | 2272.36, 2122.87, 1973.38 | Running since 13 October |
Three targets reached. Eighteen positions still running, counting each ticket as three positions under the three target split. Both coins read DOWN on the 4 hour and the daily.
1. The Bitcoin Bounce That Looked Like A Reversal
Here is what a trader with only a fast chart saw on 15 October.
Bitcoin fell to around 80,000. Then a run of green candles carried it to almost 82,900, close to 3,000 dollars off the low. The 15 minute flipped UP. The 30 minute flipped UP. The 1 hour flipped UP. Three charts in a row saying the same thing.
That is exactly the moment most traders buy. It feels like the bottom is in.
Here is what the Direction Sniper panel saw. The 4 hour still read DOWN. The daily still read DOWN. The 4 hour sell ticket from 13 October was still running. So the verdict stayed SELL, and the fast charts pointing UP against it produced no buy ticket at all.
That is a rally inside a downtrend that has not broken structure. The fast charts always turn first, on every bounce. A real reversal needs the bigger charts to turn as well, and they never did.
2. What Happened When The Rally Ran Out
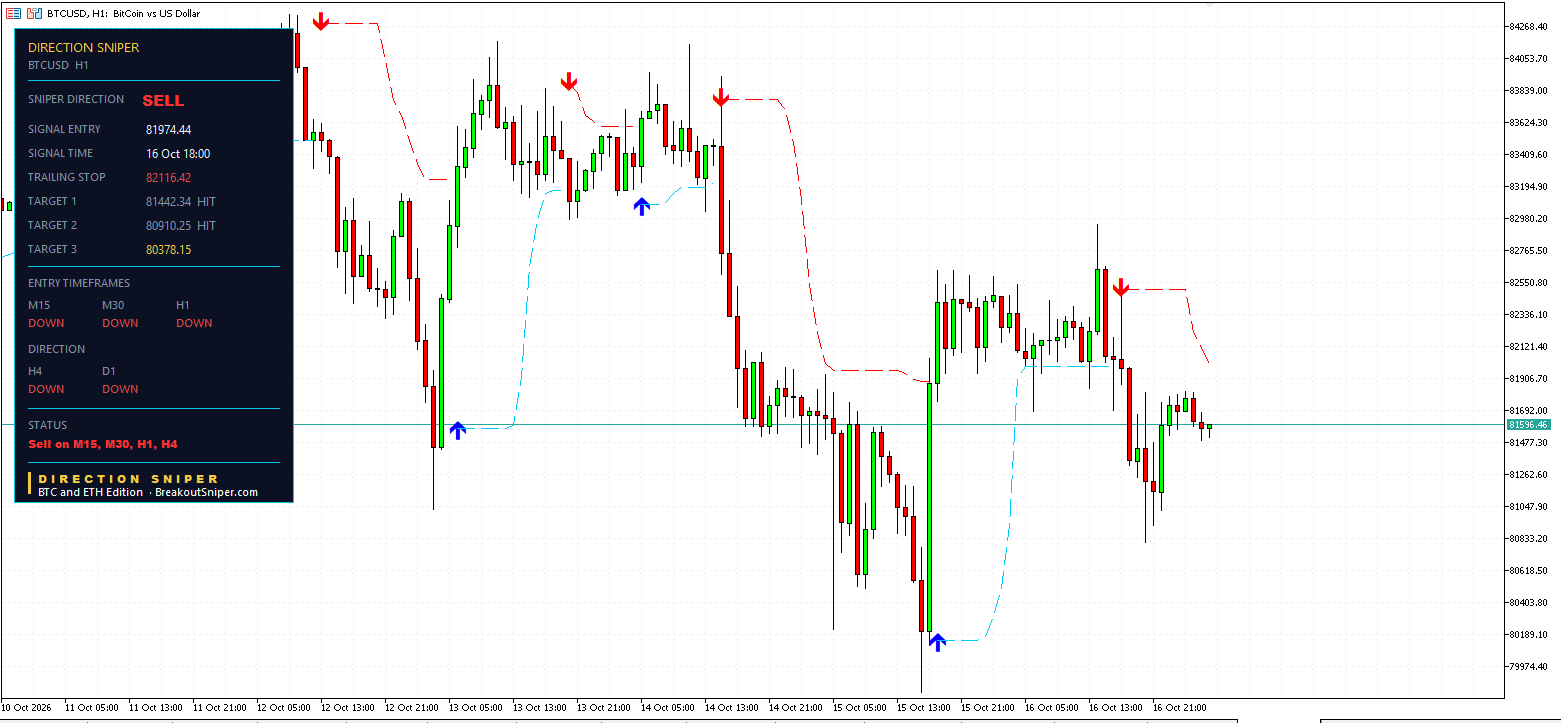
On 16 October at 18:00, the rally ran out of steam and the fast charts lined back up with the verdict. The panel printed fresh sells on both the 1 hour and the 30 minute, at the same price: 81974.44.
The 1 hour ticket:
- Entry 81974.44, original stop 82506.54, so 532.10 of risk
- Target 1 at 81442.34, reached
- Target 2 at 80910.25, reached
- Target 3 at 80378.15, still ahead
Two targets reached in a matter of hours.
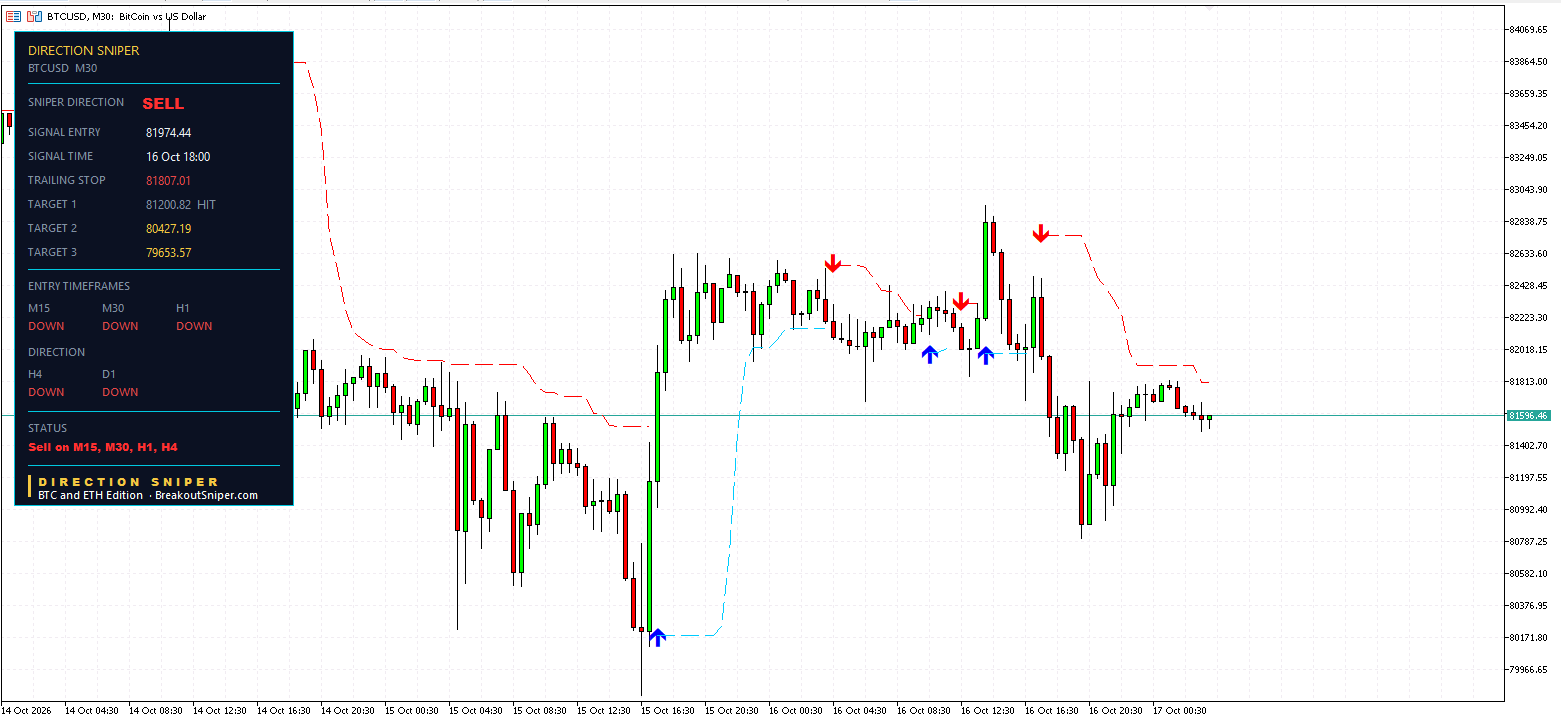
The 30 minute ticket:
- Entry 81974.44, original stop 82748.06, so 773.62 of risk
- Target 1 at 81200.82, reached
- Target 2 at 80427.19 and Target 3 at 79653.57, still ahead
- Trailing level now at 81807.01, which is 167.43 in front of the entry
That last line matters. The 30 minute ticket is already protected. A trigger at its trailing level now closes in front of the entry, not behind it.
A trader who bought the bounce on 15 October was buying straight into the move the panel was waiting for.
3. The Bigger Picture Never Changed
The 4 hour sell from 13 October at 81442.56 is still running. Its original stop was 84305.12, 2862.56 of risk. Its trailing level has since tightened to 82747.01, which takes 1558.11 off the original risk. Target 1 sits at 78580.00.
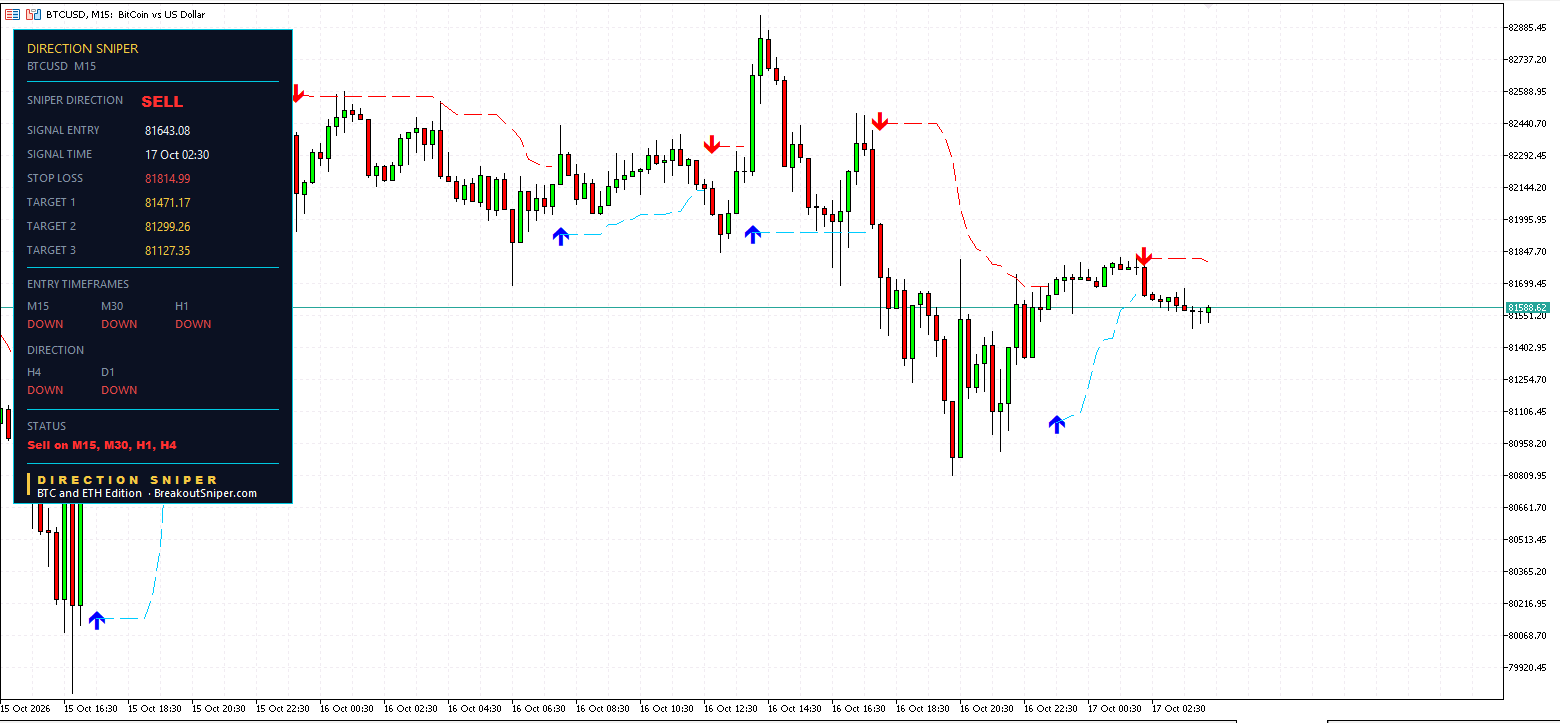
And this morning at 02:30, a fresh 15 minute ticket printed: entry 81643.08, stop 81814.99, targets 81471.17, 81299.26 and 81127.35. Price is already about 32% of the way to Target 1.
The status line on every Bitcoin panel reads the same thing: Sell on M15, M30, H1, H4. Four entry charts lined up with one verdict. You do not have to open five charts and work it out. The panel says it in one line.
4. Ethereum: The Same Story, One Step Behind
Bitcoin usually leads. Ethereum usually follows. Today’s board shows it clearly.
Ethereum’s 4 hour sell printed at the same moment as Bitcoin’s, 13 October at 04:00, entry 2421.85. Ethereum had its own bounce too, from around 2,330 on 15 October to almost 2,495 on 16 October. And the same thing happened: the 4 hour and daily held DOWN, the verdict stayed SELL, and fresh sells lined up when the rally ran out.
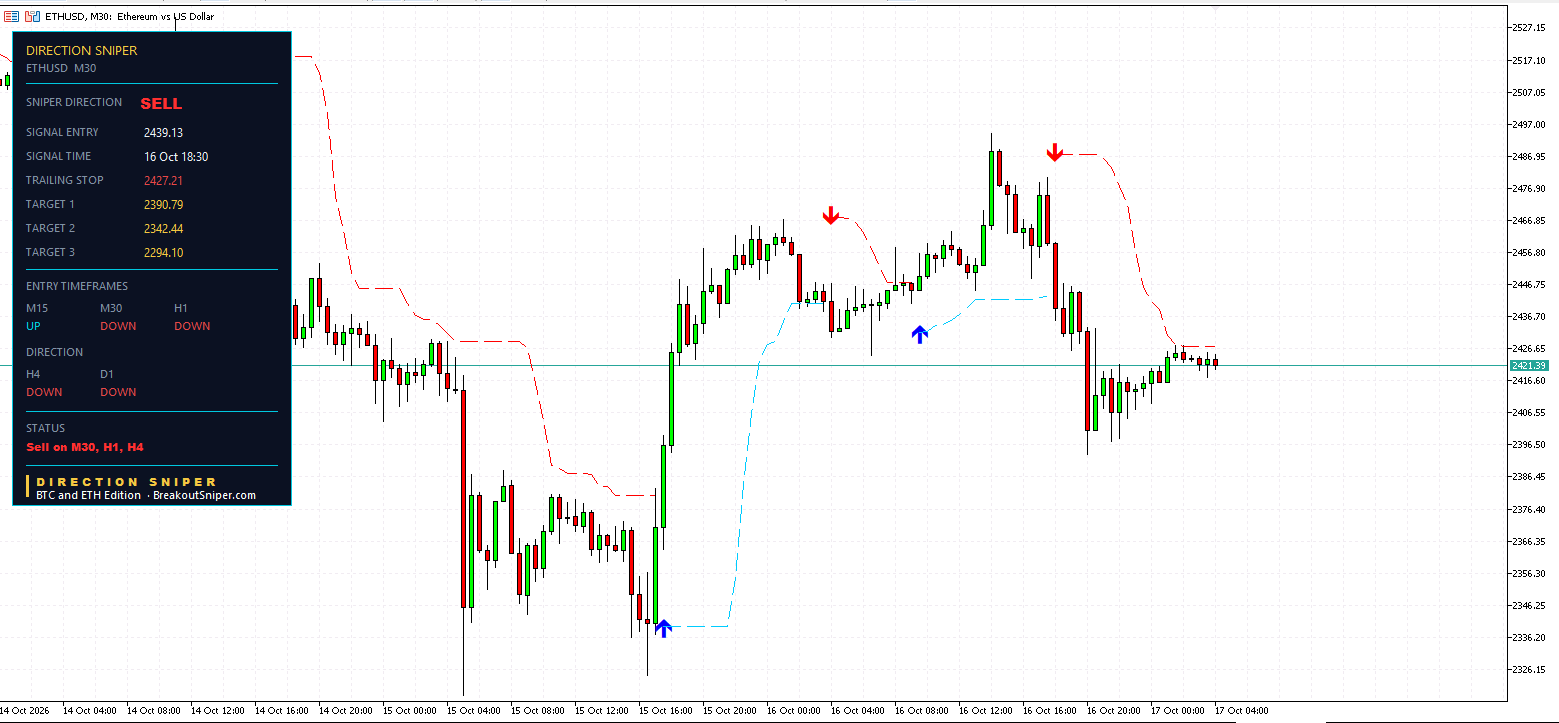
The 30 minute ticket:
- Entry 2439.13, original stop 2487.47, so 48.34 of risk
- Targets 2390.79, 2342.44 and 2294.10
- Trailing level now at 2427.21, which is 11.92 in front of the entry
No targets reached yet, and the stop has already crossed break even on structure alone. Price is about 37% of the way to Target 1.
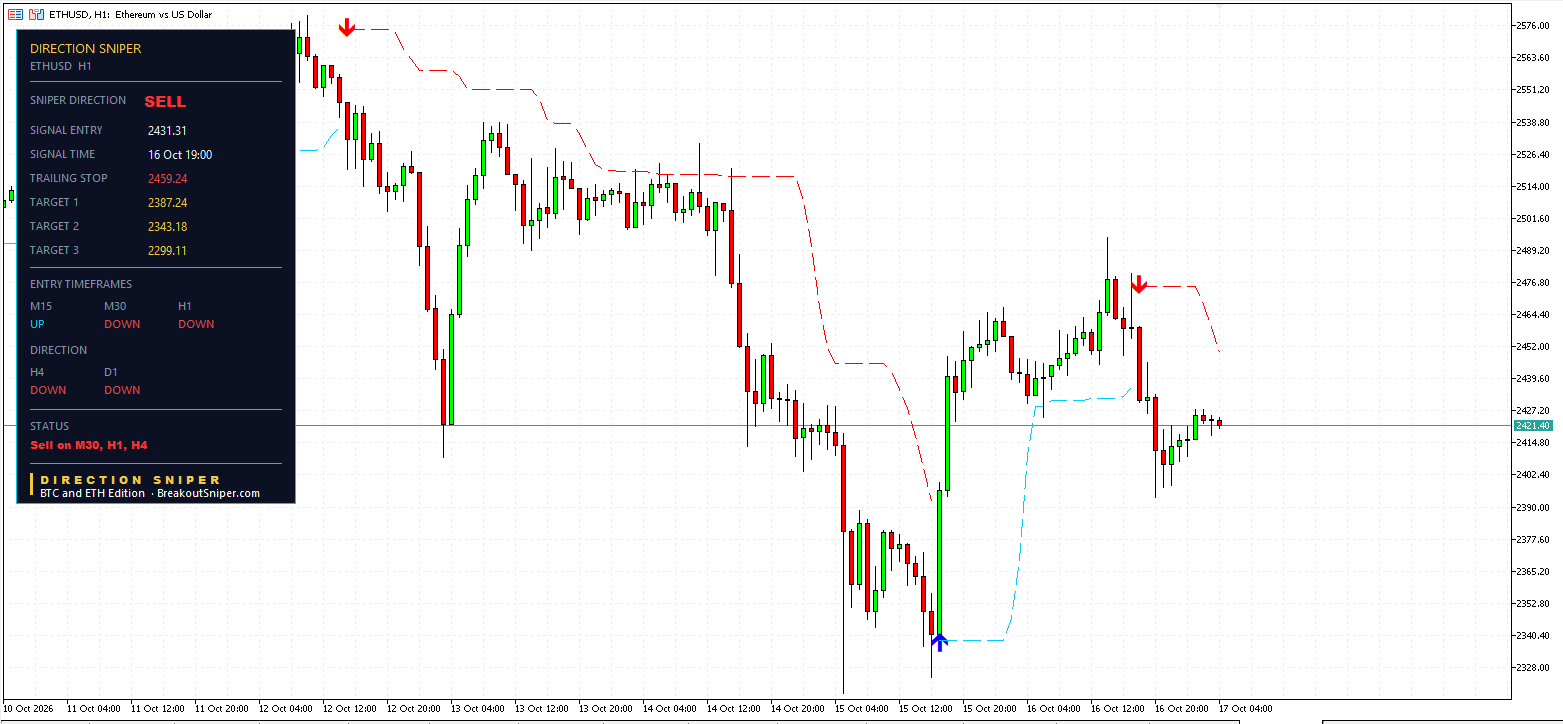
The 1 hour ticket:
- Entry 2431.31, original stop 2475.38, so 44.07 of risk
- Targets 2387.24, 2343.18 and 2299.11
- Trailing level at 2459.24, already tightened by 16.14
The 4 hour ticket from 13 October has its trailing level at 2491.33, tightened by 80.01 from the original 2571.34. Price sits right at the entry.
5. The Same Test, Happening Again Right Now
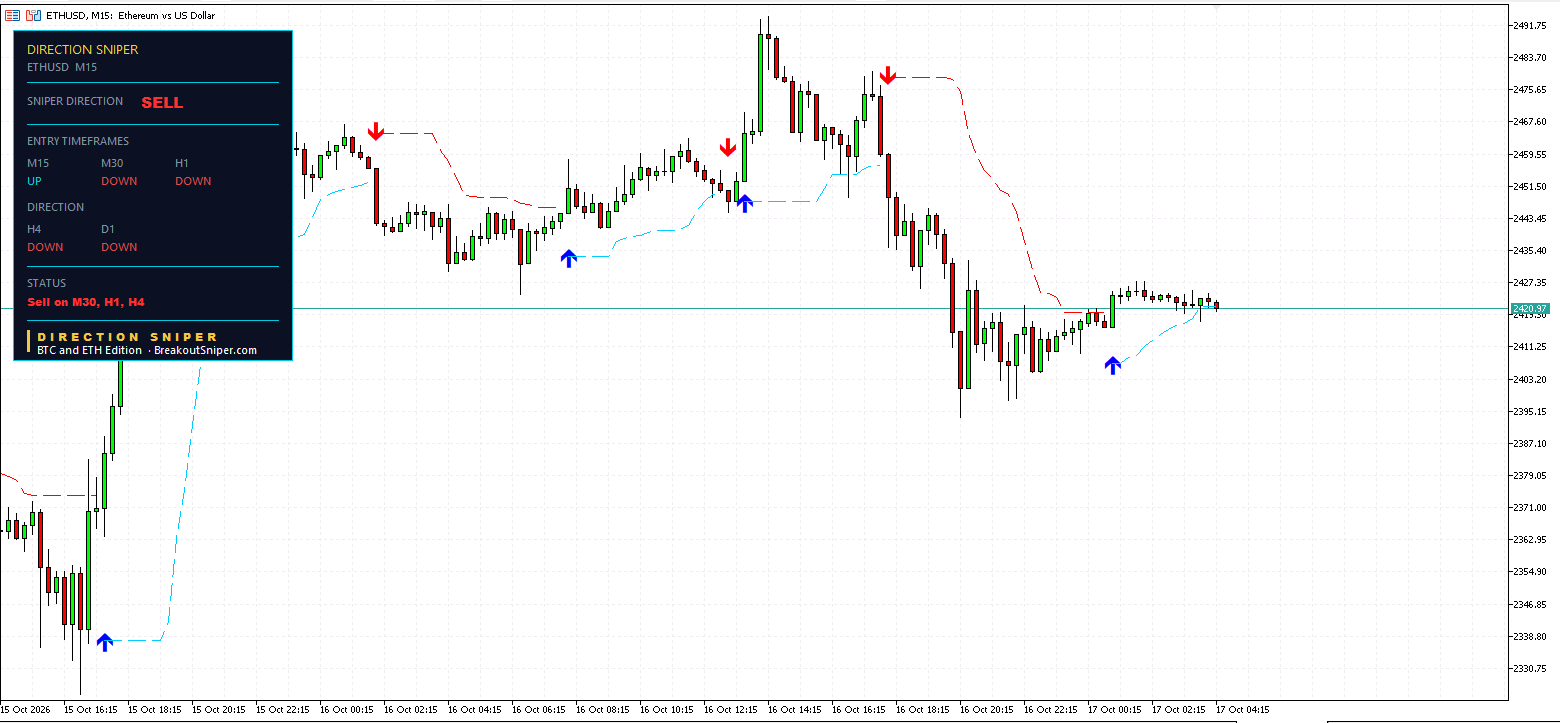
Look at Ethereum’s 15 minute chart this morning. It reads UP.
A trader watching only that chart sees a buy. The panel sees a fast chart pointing against a SELL verdict, so it shows no ticket and waits for alignment. The status reads Sell on M30, H1, H4. The 15 minute is the one chart not on that list.
This is the same test Bitcoin passed on 15 October. Nobody knows how this one ends. What the panel gives you is the same rule every time: the fast chart has to line up with the bigger picture before a ticket appears.
6. The Lesson: How To Tell A Bounce From A Reversal
Here is the rule this board teaches.
A bounce turns the fast charts. A reversal turns the big ones.
- On every rally, the 15 minute, 30 minute and 1 hour turn first. That alone tells you nothing.
- A real change in direction needs the 4 hour and the daily to turn as well.
- Until they do, a rally is a rally inside the trend, and buying it means buying against the bigger picture.
Most traders cannot check five timeframes every time price moves. That is exactly what the Direction Sniper panel does for you, in one verdict line.
7. Lot Size: Two Coins, One Trade
Here is the part most crypto traders miss.
When Bitcoin and Ethereum both show sells at the same time, that is not two separate opportunities. It is one view of the market, seen twice. If both trades go wrong, they will usually go wrong together.
So if your normal risk is 50 dollars per trade, and you take both coins, split it: 25 dollars on Bitcoin, 25 on Ethereum. One lot is usually one coin, so a 1 dollar move is worth about 1 dollar per lot:
- Bitcoin M15: 171.91 of risk, so 25 dollars is about 0.15 lots
- Bitcoin M30: 773.62 of risk, so 25 dollars is about 0.03 lots
- Ethereum M30: 48.34 of risk, so 25 dollars is about 0.52 lots
- Ethereum H1: 44.07 of risk, so 25 dollars is about 0.57 lots
Every Direction Sniper ticket prints the stop before you enter, which is what makes this possible before the trade, not after it. Contract sizes vary between brokers, so check your own Specification window.
8. Where The Levels Sit Now
Bitcoin (price about 81,596)
- M15: Target 1 at 81471.17, stop 81814.99
- M30: Target 2 at 80427.19, trailing level 81807.01
- H1: Target 3 at 80378.15, trailing level 82116.42
- H4: Target 1 at 78580.00, trailing level 82747.01
Ethereum (price about 2,421)
- M30: Target 1 at 2390.79, trailing level 2427.21
- H1: Target 1 at 2387.24, trailing level 2459.24
- H4: Target 1 at 2272.36, trailing level 2491.33
- M15: UP against the verdict, waiting for alignment
Why We Publish This
Every read on this site comes straight from the Direction Sniper panel. We publish the entry, the stop and the targets as the panel shows them, on the days they work and the days they do not. You can check every number against the chart yourself.
Bounce Or Reversal? Let The Panel Tell You
The Direction Sniper BTC and ETH Edition puts this exact panel on your own Bitcoin and Ethereum charts.
- Direction. One verdict from the 4 hour and the daily, so you always know which way the bigger picture is leaning.
- Bounces that have not broken structure. On 15 October every fast chart flipped UP. The panel held SELL, and three targets were reached after the rally ran out.
- The stop loss. Every ticket prints its stop before you enter, and the trailing level shows you the moment a trade is protected, like both 30 minute tickets today.
Built and tested on Tickmill. $47 on MT4, $67 on MT5, rising to $97 and $127 in March 2027.
Want a read like this in your inbox? Join The Daily Sniper Read, free, every trading day.
Frequently Asked Questions
What is the Bitcoin and Ethereum price forecast today, 17 October 2026?
Both coins read SELL on the Direction Sniper panel, because the 4 hour and the daily charts point down on Bitcoin and on Ethereum.
Three Bitcoin targets have been reached since the 16 October sells at 81974.44, and eighteen positions are still running across the two coins.
A fresh Bitcoin 15 minute ticket printed this morning at 81643.08.
Is Bitcoin bouncing or reversing?
On the Direction Sniper panel, a bounce turns the fast charts while a reversal turns the 4 hour and the daily as well.
On 15 October Bitcoin rallied from around 80,000 to almost 82,900 and the 15 minute, 30 minute and 1 hour all flipped UP.
The 4 hour and the daily stayed DOWN, so the verdict stayed SELL and the panel treated the move as a rally inside the downtrend.
Why did Direction Sniper not show a buy when Bitcoin rallied on 15 October?
A ticket only appears when an entry chart agrees with the verdict from the 4 hour and the daily.
The fast charts pointed UP against a SELL verdict, so the panel showed no buy ticket and waited for alignment.
When the rally ran out on 16 October, the 1 hour and 30 minute lined back up and printed sells at 81974.44.
Does Ethereum follow Bitcoin?
They often move together, and today’s board shows it.
Both 4 hour sells printed at the same moment, 13 October at 04:00, and both coins had a rally on 15 and 16 October that did not change the 4 hour or daily direction.
That is why a Bitcoin trade and an Ethereum trade in the same direction are best treated as one view of the market, not two separate opportunities.
How should I size a trade if I take both Bitcoin and Ethereum at the same time?
Split your normal risk between them, because both trades will usually go wrong together if they go wrong.
With 50 dollars of total risk, that is 25 dollars on each coin.
On today’s tickets, 25 dollars on the Bitcoin 15 minute with 171.91 of risk is about 0.15 lots, and on the Ethereum 30 minute with 48.34 of risk is about 0.52 lots, where one lot is usually one coin.
Does a reached target mean a trader made money?
No. Price reaching a published target level is not the same as a realised result.
Fills, spreads, lot size and when each trader closed the position all change the outcome.
These posts report what the Direction Sniper panel showed, for education, and they are not a trade signal service.
Disclaimer: This post reports what the Direction Sniper panel showed on 17 October 2026. It is educational analysis, not financial advice and not a trade signal service. All the tickets described were still open at the time of writing. Price reaching a published target level is not the same as a realised result. Lot sizes are arithmetic for illustration and are not a recommendation about how much anyone should trade. Cryptocurrency is highly volatile, trading carries risk, and you should only trade money you can afford to lose.

