
Bitcoin Holds a Buy Verdict Inside Its Range
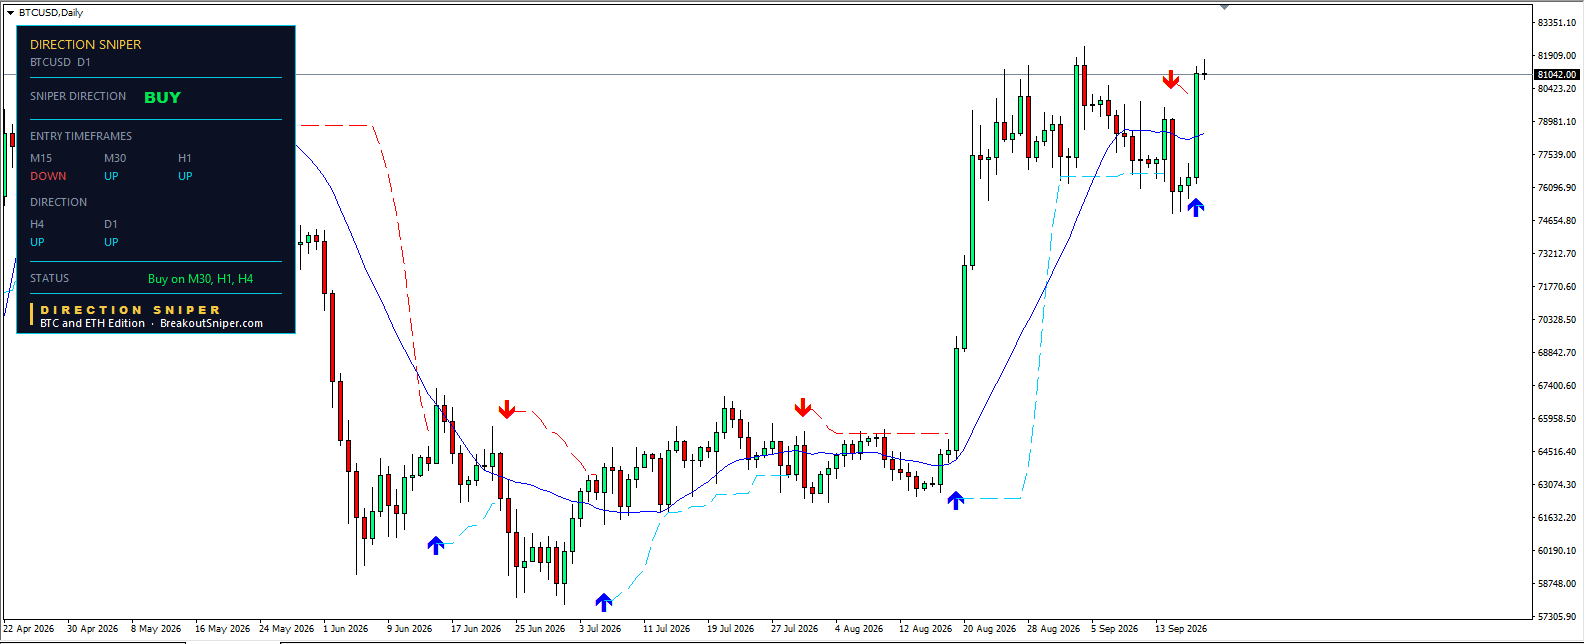
Bitcoin is on a BUY verdict this weekend. Both the H4 and daily timeframes point up, and price has pushed back toward the top of the range it has held since late August. The question now is simple: does Bitcoin break out of that range, or does the ceiling hold again?
Here is what the Direction Sniper indicator shows on BTCUSD.
How to Read the Chart
Direction Sniper reads four timeframes at once so that you do not have to flip between charts to know which way the market leans.
- Direction (H4 and D1). These two set the verdict. Both up means the indicator only looks for buys. Both down means sells only. Mixed means no trade.
- Entry timeframes (M15, M30, H1). These show where a trade could line up with the verdict. When an entry timeframe agrees with the direction, the status line tells you.
- Arrows. A blue arrow marks a buy signal on the chart. A red arrow marks a sell signal.
- Dynamic trend line. The solid blue line shows the underlying trend. Price above it favours buyers.
- Trailing level. The dashed line follows price and shows where the indicator’s stop would sit.
One note for crypto: Bitcoin trades seven days a week, so weekend candles count toward the H4 and daily readings. Gold and silver pause on weekends. Bitcoin does not.
Bitcoin Technical Analysis
Verdict: BUY
H4 is up and D1 is up, so the direction is clear. On the entry timeframes, M30 and H1 are up while M15 is down. The status line reads Buy on M30, H1 and H4, meaning three timeframes currently agree with the verdict.
The daily chart tells the bigger story. In late August, Bitcoin jumped from around 64,500 to around 77,500 in just two candles. Since then it has not trended. It has moved sideways between roughly 75,000 and 82,300.
Inside that range, the indicator has flipped twice. A red arrow printed near the range top around 14 September as price pulled back. Then a blue arrow printed around 16 September near 76,000, and the latest candle has pushed Bitcoin back up to around 81,000.
Key levels on the chart:
- Range top: around 81,900 to 82,300, the late August highs
- Dynamic trend line: around 78,500
- Range floor: around 75,000, the mid September lows
Price is sitting just under the range top, with the trend line and the range floor below.
Lesson: Why M15 Disagreeing Is Not a Problem
New traders often see one timeframe pointing the other way and freeze. On Bitcoin today, M15 shows down while everything above it shows up.
That is normal. Short timeframes react to every small pullback. The verdict comes from H4 and D1, not from M15. When the higher timeframes point up and a short timeframe dips, that dip is often where the entry timeframes look for their next signal in the direction of the verdict.
The rule is simple: let the big timeframes decide direction, and let the small timeframes decide timing.
What Changes the Picture
- A daily close above around 82,300 would take Bitcoin out of its three week range for the first time since the late August jump.
- A move back below the dynamic trend line near 78,500 would put price back in the middle of the range, where direction is less clear.
- H4 or D1 turning down would change the verdict. If one turns, the verdict becomes mixed and the indicator stops looking for buys.
- A break below around 75,000 would take out the range floor and the area where the latest blue arrow printed.
Read Bitcoin on Your Own Chart
Direction Sniper reads four timeframes at once and shows you the verdict, the entry timeframes and the trade ticket on one panel, so that you can see the setup for yourself instead of guessing. The Bitcoin and Ethereum Edition is available as an add on when you get Direction Sniper.
Please note that Direction Sniper was built and tuned on gold and silver. Crypto moves differently, and the Bitcoin and Ethereum Edition uses the same settings without separate testing on crypto.
Get the daily reads on Telegram and Facebook.
Educational analysis, not financial advice. Trading carries risk and you can lose money.
Trade Walkthrough: The H1 Buy Ticket
This is a completed trade, shown after the fact as a teaching example. It shows how the ticket is built and managed. It does not show what the next ticket will do.
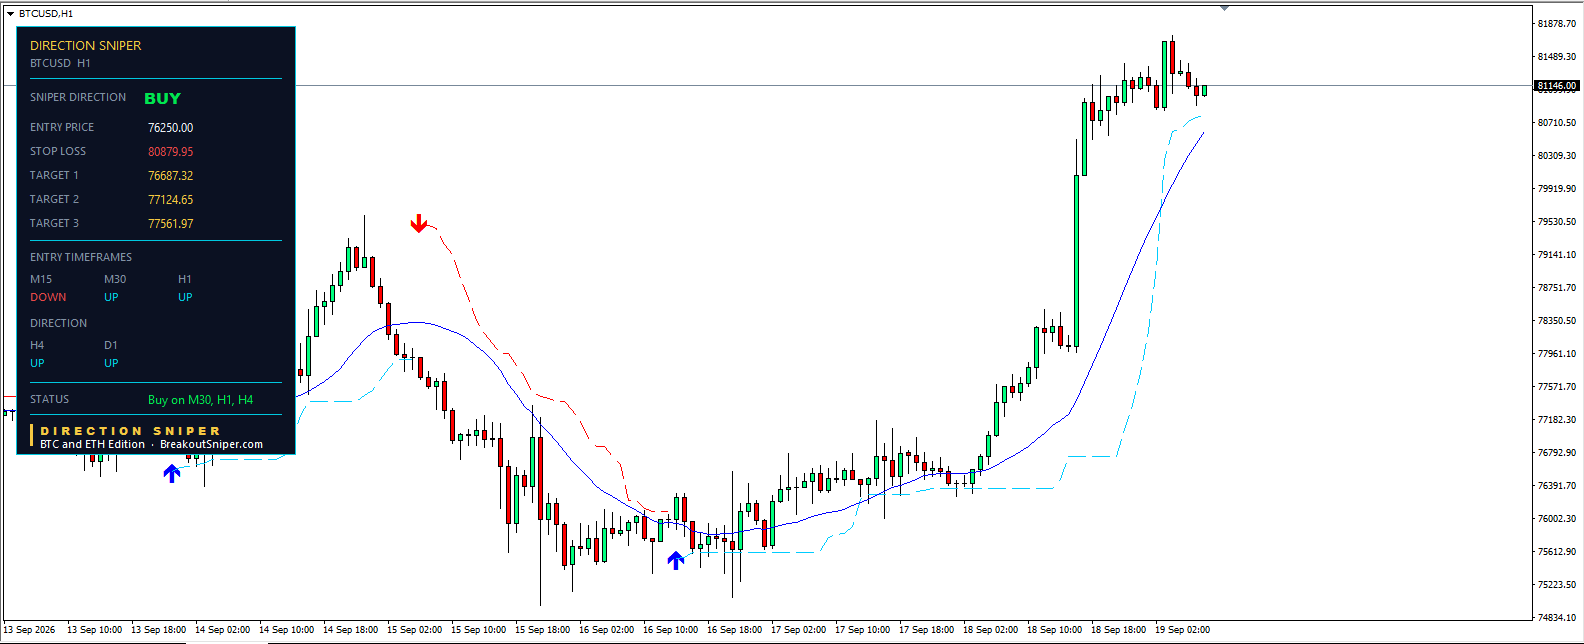
Step 1: The setup. On 14 September, a red arrow printed on H1 near 79,300 and price fell for two days. By 16 September, price had dropped to around 75,500 and started to base. H4 and D1 were still pointing up, so the verdict remained BUY. The indicator was only looking for buys, and the pullback was a sell on the small timeframe inside a bigger uptrend.
Step 2: The signal. Around mid morning on 16 September (server time), a blue arrow printed on H1. That signal agreed with the BUY verdict, so the panel produced a trade ticket.
Step 3: The ticket.
| Level | Price |
|---|---|
| Entry | 76,250.00 |
| Stop loss at entry | around 75,813 |
| Target 1 | 76,687.32 |
| Target 2 | 77,124.65 |
| Target 3 | 77,561.97 |
Each target sits the same distance apart, about 437 points. That distance equals the gap between the entry and the stop, so Target 1 is one times the risk, Target 2 is two times, and Target 3 is three times.
Step 4: The targets. Price reached Target 1 on 17 September, Target 2 later that same day, and Target 3 early on 18 September. Once Target 3 was reached, all three parts of the ticket were complete.
Step 5: The trailing level. If you look at the panel now, the stop loss reads 80,879.95, which is above the entry price. That is not a mistake. The panel shows the current trailing level, and it has followed price up as Bitcoin climbed. On a buy ticket, a trailing level above entry means the stop has moved into profit territory.
What this trade teaches
- The verdict filtered out the wrong side. During the two day fall, the H1 chart looked bearish. Because H4 and D1 still pointed up, the indicator waited for a buy instead of chasing the drop.
- Targets bank the move in stages. Taking one third at each target means part of the trade is closed early, and the rest has room to run.
- Targets do not catch everything. After Target 3, Bitcoin kept climbing to around 81,800. The ticket had already finished well below that. Fixed targets trade some of the upside for consistency, and that is a choice worth understanding before you use them.
- Not every ticket ends like this. Some tickets hit the stop before Target 1. This walkthrough shows how the mechanics work, not how often they work.
Lesson: Why M15 Disagreeing Is Not a Problem
Right now, M15 shows down while everything above it shows up. That is normal. Short timeframes react to every small pullback. The verdict comes from H4 and D1, not from M15. The trade above is a good example: the H1 chart pointed down for two days while the bigger timeframes held up, and the next signal came in the direction of the verdict.
Let the big timeframes decide direction, and let the small timeframes decide timing.
What Changes the Picture
- A daily close above around 82,300 would take Bitcoin out of its three week range for the first time since the late August jump.
- A move back below the dynamic trend line near 78,500 would put price back in the middle of the range, where direction is less clear.
- H4 or D1 turning down would change the verdict. If one turns, the verdict becomes mixed and the indicator stops looking for buys.
- A break below around 75,000 would take out the range floor.
Read Bitcoin on Your Own Chart
Direction Sniper reads four timeframes at once and shows you the verdict, the entry timeframes and the trade ticket on one panel, so that you can see the setup for yourself instead of guessing. The Bitcoin and Ethereum Edition is available as an add on when you get Direction Sniper.
Please note that Direction Sniper was built and tuned on gold and silver. Crypto moves differently, and the Bitcoin and Ethereum Edition uses the same settings without separate testing on crypto. The trade shown above is one example selected after it finished. It is not a typical or guaranteed result.
Ethereum Pushes Above Its Range on a Buy Verdict
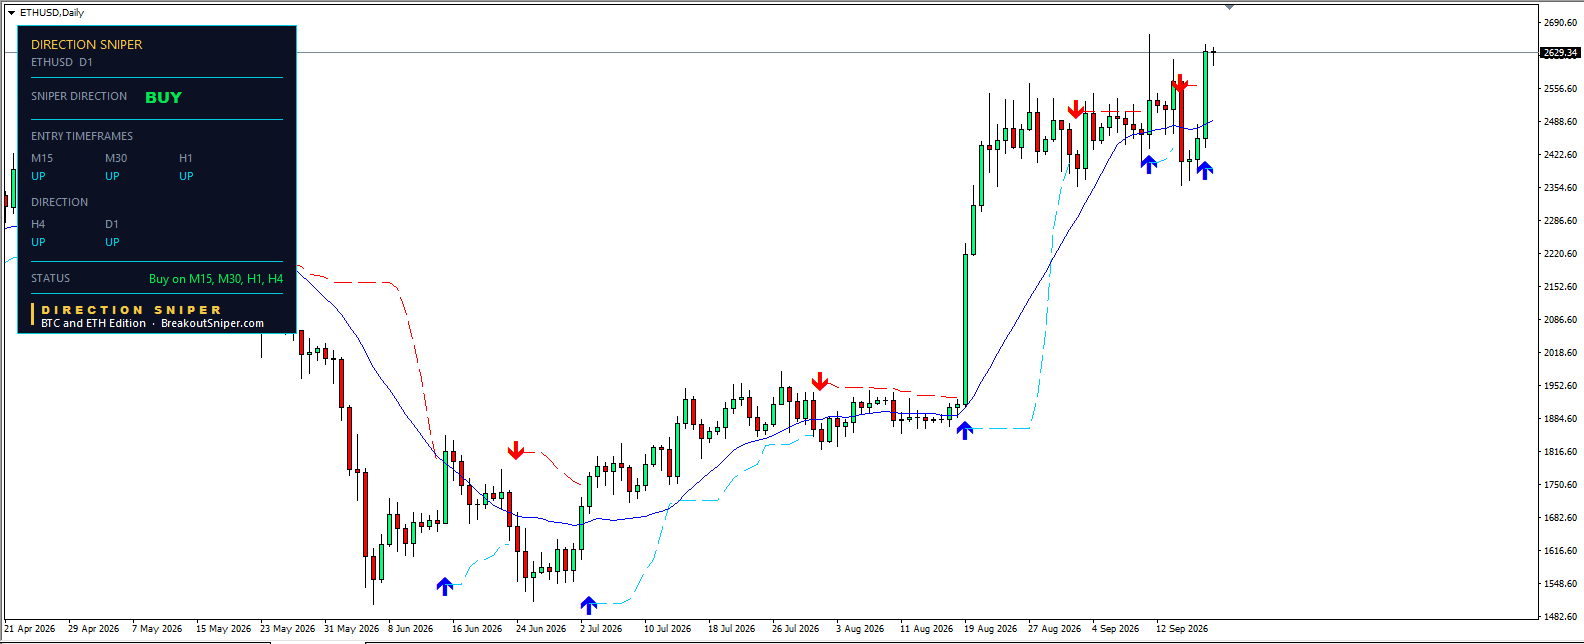
Ethereum is on a BUY verdict this weekend, and every timeframe on the panel agrees. H4 and D1 point up, and so do all three entry timeframes. Price has pushed above the top of the range it has held since late August and is now trading around 2,629.
This week also gave us a clean example of how a Direction Sniper trade ticket works from start to finish. The M30 buy ticket that printed on 18 September has reached all three of its targets. Below, we walk through it step by step so that you can see exactly how the ticket is built and managed.
How to Read the Chart
Direction Sniper reads four timeframes at once so that you do not have to flip between charts to know which way the market leans.
- Direction (H4 and D1). These two set the verdict. Both up means the indicator only looks for buys. Both down means sells only. Mixed means no trade.
- Entry timeframes (M15, M30, H1). These show where a trade could line up with the verdict. When an entry timeframe agrees with the direction, the status line tells you.
- Arrows. A blue arrow marks a buy signal. A red arrow marks a sell signal.
- Dynamic trend line. The solid blue line shows the underlying trend. Price above it favours buyers.
- Trailing level. The dashed line follows price and shows where the indicator’s stop would sit.
- Trade ticket. When a signal agrees with the verdict, the panel shows an entry price, a stop loss and three targets.
One note for crypto: Ethereum trades seven days a week, so weekend candles count toward the H4 and daily readings. Gold and silver pause on weekends. Ethereum does not.
Ethereum Technical Analysis (Daily)
Verdict: BUY
H4 and D1 are up, and M15, M30 and H1 are up too. The status line reads Buy on M15, M30, H1 and H4. That is full alignment across the panel.
The daily chart shows how Ethereum got here. In mid August, price sat flat around 1,900. Then, starting around 19 August, it jumped to around 2,440 in just a few candles. Since then Ethereum has not trended. It has moved sideways, with most daily closes between roughly 2,400 and 2,560, and one sharp spike up to around 2,680 in early September that did not hold.
The latest daily candle is the first strong push above that range in weeks, taking price to around 2,629.
Key levels on the daily chart:
- Spike high: around 2,680, the early September high that did not hold
- Range top: around 2,560, where most daily closes have stalled
- Dynamic trend line: around 2,490
- Range floor: around 2,370 to 2,400, the mid September lows
Ethereum Holds a Buy Verdict as the M30 Ticket Reaches All Three Targets
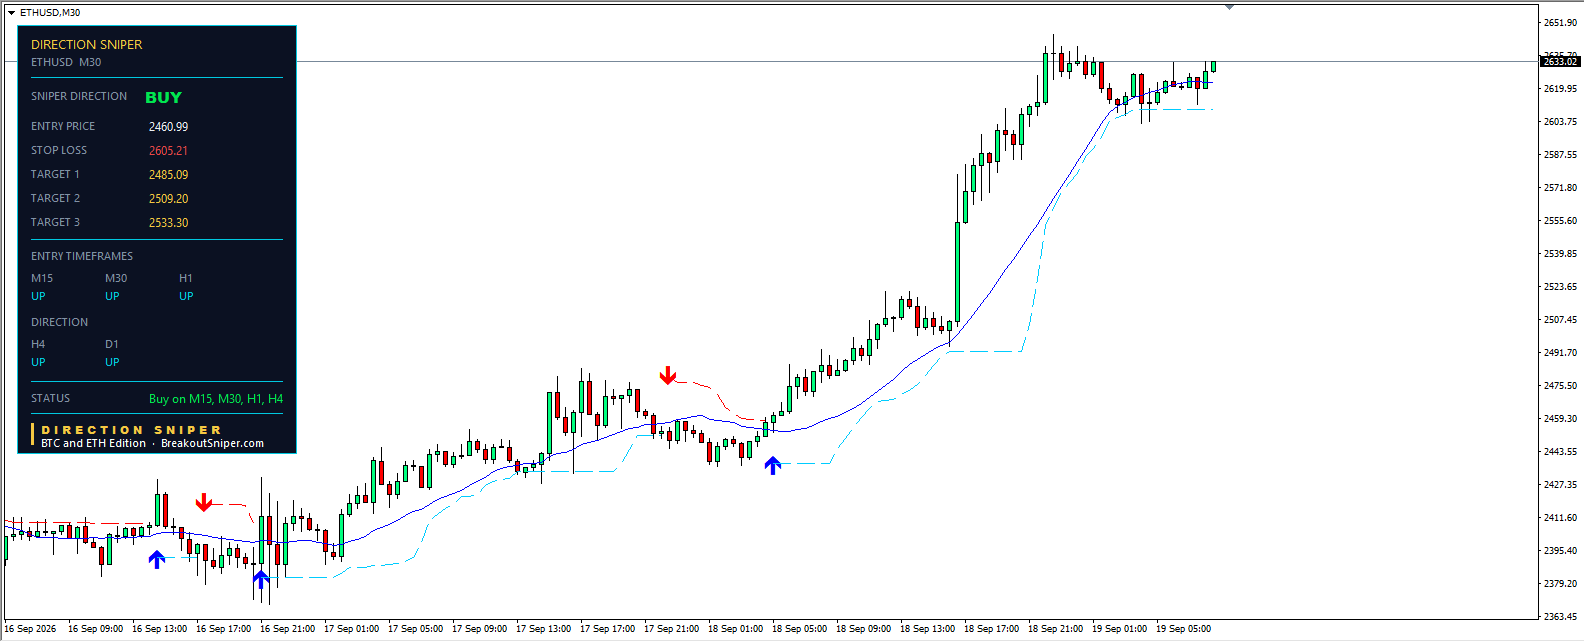
Ethereum is on a BUY verdict this weekend, and every timeframe on the panel agrees. H4 and D1 point up, and so do all three entry timeframes. Price is trading around 2,630, close to the high of the week.
This week also gave us a clean example of how a Direction Sniper trade ticket works from start to finish. The M30 buy ticket that printed on 18 September has reached all three of its targets. Below, we walk through the M30 chart and the ticket step by step so that you can see exactly how the ticket is built and managed.
How to Read the Chart
Direction Sniper reads four timeframes at once so that you do not have to flip between charts to know which way the market leans.
- Direction (H4 and D1). These two set the verdict. Both up means the indicator only looks for buys. Both down means sells only. Mixed means no trade.
- Entry timeframes (M15, M30, H1). These show where a trade could line up with the verdict. When an entry timeframe agrees with the direction, the status line tells you.
- Arrows. A blue arrow marks a buy signal. A red arrow marks a sell signal.
- Dynamic trend line. The solid blue line shows the underlying trend. Price above it favours buyers.
- Trailing level. The dashed line follows price and shows where the indicator’s stop would sit.
- Trade ticket. When a signal agrees with the verdict, the panel shows an entry price, a stop loss and three targets.
One note for crypto: Ethereum trades seven days a week, so weekend candles count toward the H4 and daily readings. Gold and silver pause on weekends. Ethereum does not.
Ethereum Technical Analysis (M30)
Verdict: BUY
H4 and D1 are up, and M15, M30 and H1 are up too. The status line reads Buy on M15, M30, H1 and H4. That is full alignment across the panel.
The M30 chart covers the last three days, and it tells the story in three stages.
Stage 1: The chop (16 September). Ethereum spent most of the day moving sideways around 2,390 to 2,420. Three arrows printed in a few hours, buy, then sell, then buy, as price swung back and forth without going anywhere.
Stage 2: The steady climb (17 September). From the evening low near 2,370, Ethereum climbed in steps through 17 September, reaching around 2,480 by the afternoon. In the evening, a red arrow printed and price pulled back to around 2,440.
Stage 3: The breakout (18 September). A blue arrow printed in the early hours, and this time the move kept going. Price climbed to a small base around 2,505 to 2,520, then one large candle lifted it to around 2,555. By late evening, Ethereum had reached around 2,648. It has since pulled back slightly and is now holding around 2,630.
Key levels on the M30 chart:
- Week high: around 2,648, reached late on 18 September
- Dynamic trend line: around 2,620, sitting just under price
- Trailing level: 2,605.21
- Breakout base: around 2,505 to 2,520, where price paused before the big candle
Trade Walkthrough: The M30 Buy Ticket
This is a completed trade, shown after the fact as a teaching example. It shows how the ticket is built and managed. It does not show what the next ticket will do.
Step 1: The setup. When the red arrow printed on the evening of 17 September, the M30 chart looked like it was turning down. But H4 and D1 were still pointing up, so the verdict remained BUY. The indicator ignored the sell arrow and waited for a buy.
Step 2: The signal. In the early hours of 18 September (server time), a blue arrow printed on M30. That signal agreed with the BUY verdict, so the panel produced a trade ticket.
Step 3: The ticket.
| Level | Price |
|---|---|
| Entry | 2,460.99 |
| Stop loss at entry | around 2,436.89 |
| Target 1 | 2,485.09 |
| Target 2 | 2,509.20 |
| Target 3 | 2,533.30 |
Each target sits about 24 points apart. That distance equals the gap between the entry and the stop, so Target 1 is one times the risk, Target 2 is two times, and Target 3 is three times.
Step 4: The targets. Price reached Target 1 and Target 2 during the morning and early afternoon of 18 September. Target 3 was reached when the large candle broke out of the 2,505 to 2,520 base.
Step 5: The trailing level. If you look at the panel now, the stop loss reads 2,605.21, which is above the entry price. That is not a mistake. The panel shows the current trailing level, and it has followed price up as Ethereum climbed.
What this trade teaches
- The verdict filtered out the wrong side. The red arrow on 17 September looked like a turn. The bigger timeframes said otherwise, and the indicator waited for a buy instead of chasing the drop.
- Targets bank the move in stages. Taking one third at each target means part of the trade is closed early, and the rest has room to run.
- Targets do not catch everything. After Target 3, Ethereum kept climbing to around 2,648. The ticket had already finished well below that. Fixed targets trade some of the upside for consistency, and that is a choice worth understanding before you use them.
- Not every ticket ends like this. Some tickets hit the stop before Target 1. This walkthrough shows how the mechanics work, not how often they work.
Lesson: Why the Verdict Matters More Than Any Single Arrow
Look back at 16 September on the M30 chart. Three arrows printed in a few hours while price went nowhere. If you traded every arrow, you would have been in and out of the market three times with nothing to show for it.
This is why Direction Sniper does not treat every arrow as a trade. The verdict from H4 and D1 decides which side to take. The entry timeframes then look for signals on that side only. On a BUY verdict, red arrows on M30 are simply pullbacks to wait through, not trades to take.
Let the big timeframes decide direction, and let the small timeframes decide timing.
What Changes the Picture
- A move above around 2,648 would put Ethereum at a new high for the week.
- A drop below the dynamic trend line near 2,620 would be the first sign the short term push is losing strength.
- A drop below the trailing level at around 2,605 would mean the pullback has gone deeper than the indicator’s current stop on M30.
- A return to the 2,505 to 2,520 base would undo most of the 18 September breakout.
- H4 or D1 turning down would change the verdict. If one turns, the verdict becomes mixed and the indicator stops looking for buys.
Read Ethereum on Your Own Chart
Direction Sniper reads four timeframes at once and shows you the verdict, the entry timeframes and the trade ticket on one panel, so that you can see the setup for yourself instead of guessing. The Bitcoin and Ethereum Edition is available as an add on when you get Direction Sniper.
Please note that Direction Sniper was built and tuned on gold and silver. Crypto moves differently, and the Bitcoin and Ethereum Edition uses the same settings without separate testing on crypto. The trade shown above is one example selected after it finished. It is not a typical or guaranteed result.
Get the daily reads on Telegram and Facebook.
Educational analysis, not financial advice. Trading carries risk and you can lose money.
