
The gold and silver price forecast today: gold is back to SELL. Yesterday the panel said NO TRADE because the 4 hour and daily disagreed. Overnight the 4 hour turned back down, and the direction has resumed. Readings as of 17 September 2026.
How to Read the Chart
The panel on the left gives the verdict. The H4 and daily set the direction, and the entry timeframes (M15, M30 and H1) are where the timing signals appear. On the chart itself, a red arrow marks where that timeframe turned down, and the red dashed line then follows price from above. A blue arrow marks a turn up, with the blue line following from below.
Gold Technical Analysis Today (XAUUSD)
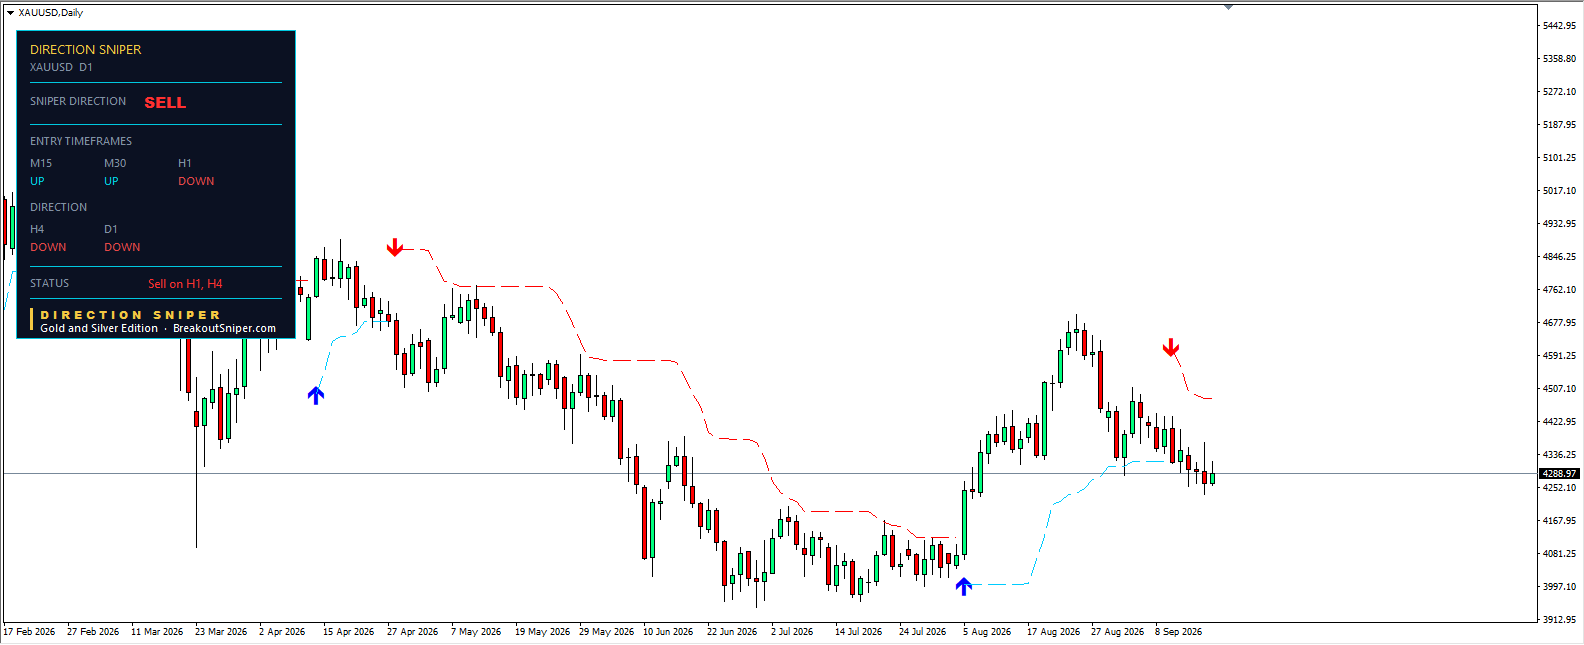
Direction Sniper reads SELL on gold. The H4 and daily both point DOWN, and the status line shows “Sell on H1, H4.”
The entry timeframes are split. The H1 reads DOWN, in line with the direction. The M15 and M30 both read UP.
Price is at 4,288.97.
What Happened Overnight
The Federal Reserve raised its benchmark rate by 25 basis points on Wednesday, to a target range of 3.75 to 4 percent. It was the first increase since 2023, the vote was unanimous, and the updated projections point to the possibility of another rise this year. Chair Kevin Warsh said the committee needed to be confident that underlying inflation was moving to its objective clearly and at sufficient speed.
Higher rates generally weigh on gold, since gold pays no yield.
Here is the part worth noting. The panel does not know any of that happened. It does not read headlines, and there is no news filter in it. It reads price on four timeframes. The 4 hour turned back down because price did, and the verdict changed from NO TRADE to SELL on its own.
That is the difference between analysis and reaction. The news explains why traders sold. The panel tells you that they did, and on which timeframes it now shows.
The H1 Sell Ticket From Last Night
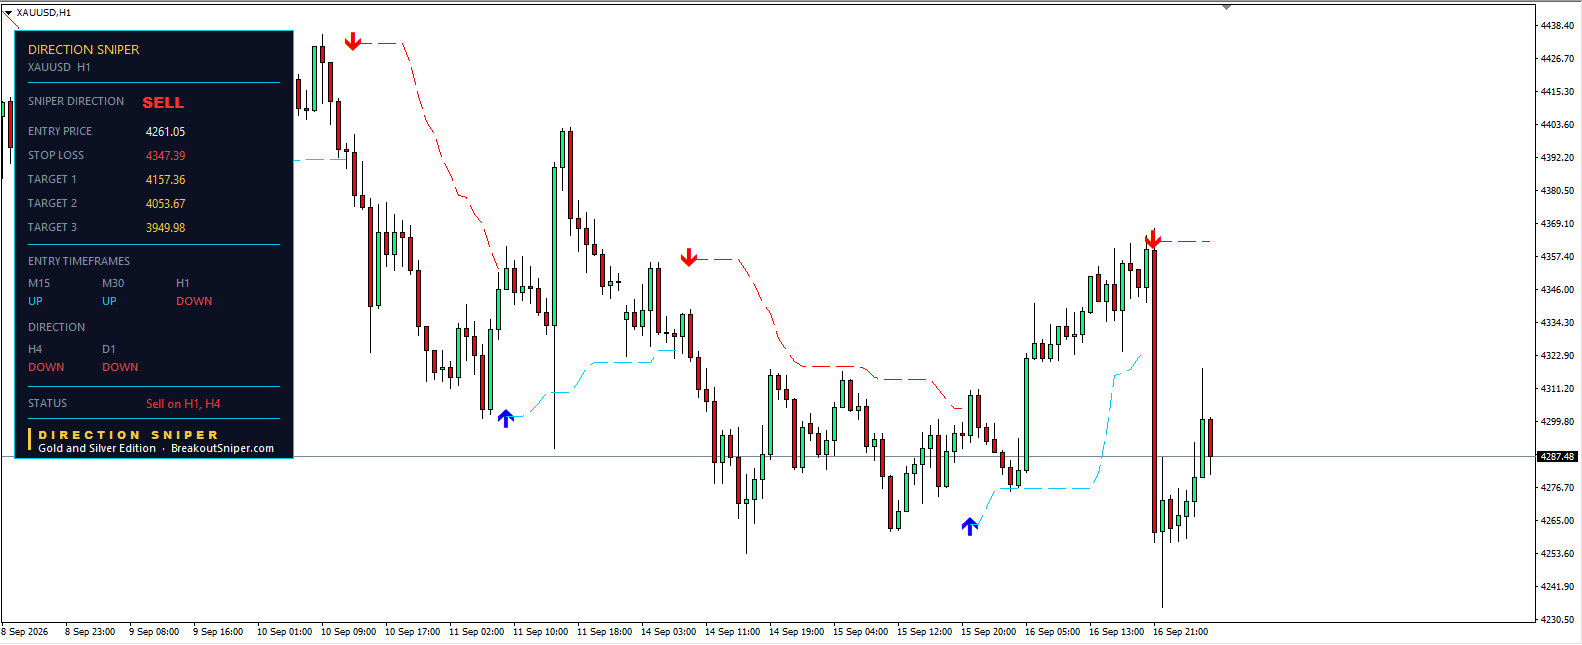
If you took the H1 signal when it printed, here is exactly where it stands this morning.
Entry price: 4,261.05
Stop loss: 4,347.39
Target 1: 4,157.36
Target 2: 4,053.67
Target 3: 3,949.98
The ticket has not closed. Price has not reached a target and the stop at 4,347.39 has not been hit, so the panel still shows it as open.
One thing worth understanding about the levels. The panel calculated the stop and the three targets from an entry at 4,261.05. Price is now above that, so the distances from where price sits today are not the distances on the ticket. On a sell, the stop is nearer and the targets are further than the original numbers suggest. Anyone reading a ticket after the fact is looking at a different risk profile from the one the panel set.
The red arrow printed near 4,360 on the 16 September 21:00 candle. What followed was the single largest candle on this chart, a drop of roughly 130 points straight down to about 4,230, as the market reacted to the Fed decision.
Price is now at 4,287.48. That is above the entry on a sell, so as of this morning the ticket is underwater by about 26 points. The stop at 4,347.39 has not been touched.
Two ways to handle a morning like this
In real trading, plenty of people would have closed into that spike. Price dropped 130 points in an hour, it was sitting well in profit, and taking money off the table there is a perfectly reasonable decision. Nobody needs the system’s permission to do that.
Following the system strictly means you did not. You hold, and you let the mechanism finish the job. The trailing stop keeps moving with price, and it will eventually close the position, either at a target or at the line. That is the trade off. You give up the discretionary exit in return for not having to make a judgement call in the middle of a violent move.
Neither approach is wrong. What matters is knowing which one you are following before the candle arrives, rather than deciding halfway through.
Two things about this ticket are worth studying
The stop is unusually wide. It sits about 86 points above the entry, where yesterday’s M15 ticket had a stop around 12 points away. The trailing line is calculated from recent price behaviour, and a candle that size widens everything. Bigger moves mean wider stops. That is the system working as designed, not a fault, but it means the position size that suited yesterday does not suit today.
The targets are a long way out. Target 1 sits over 100 points below the entry, and Target 3 asks for nearly 3,950. Those came from the same volatility. On a quiet day the H1 might ask for 20 points. After a Fed decision it asks for 100.
Where Today’s Next Signal Comes From
The H1 has already fired and its ticket is open. The next one has to come from the M15 or the M30.
And it can only be a sell.
That is not a preference, it is how the system is built. The H4 and daily both read DOWN, so the direction is SELL. An entry timeframe only produces a ticket when it turns in the same direction. Right now the M15 and M30 both read UP, which is why neither is showing anything.
So the two things to watch are simple. The M15 flipping from UP to DOWN. Or the M30 doing the same. Either one produces a sell ticket with its own entry, trailing stop and three targets, calculated on that timeframe’s own volatility.
A buy signal cannot appear on gold today unless the H4 turns back up first and the direction itself changes. Until that happens, every up move on the fast charts is a bounce inside a sell direction, not a setup.
That is the whole discipline the panel enforces. You are not looking for something to trade. You are watching two fields, waiting for one specific thing.
Silver Price Forecast Today (XAGUSD)
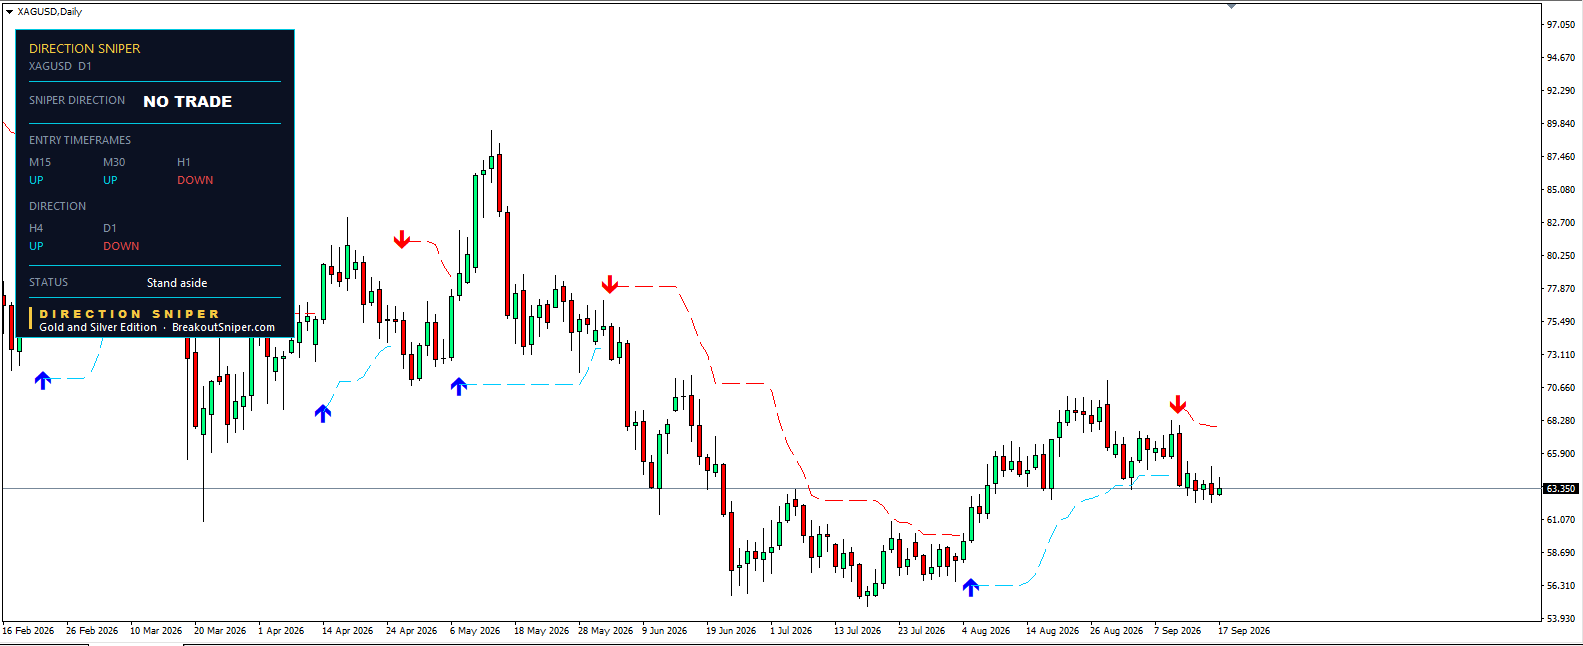
Silver has not followed gold. The panel still reads NO TRADE, status “Stand aside.”
The H4 is UP while the daily reads DOWN. Those two disagree, so there is no direction, and with no direction there is no ticket on any timeframe. Among the entry timeframes, the M15 and M30 read UP and the H1 reads DOWN.
Price is at 63.350.
This is the first day this week the two metals have read differently. All week they moved together, often matching field for field. Today gold’s H4 turned back down and silver’s did not.
That split is useful information on its own. The Fed decision hit both markets, and gold’s structure resolved while silver’s did not. If you were watching only one chart you would have no idea the other behaved differently.
There is also nothing to do about it. Silver has no direction, so no setup on any smaller timeframe counts until the H4 and daily agree again. If the H4 turns back down, silver joins gold in a sell direction. If the daily turns up, silver flips to a buy with the M15 and M30 already pointing that way.
What Changes the Picture
Gold has a direction and silver does not.
On gold, the M15 or M30 turning down would bring a new ticket in line with the H4 and daily. The H4 turning back up would remove the direction entirely, as it did yesterday.
On silver, nothing counts until the H4 and daily agree. Watch which way that resolves before looking at any entry timeframe.
The Lesson: The System Does Not Need the News
Last night the Federal Reserve raised rates for the first time since 2023, and gold dropped 130 points in a single hour.
The panel did not know that was happening.
It has no news feed. It does not read the Fed statement or the dot plot. All it did was read price on four timeframes, and when the 4 hour turned back down it changed the verdict from NO TRADE to SELL. The news explained why traders were selling. The panel told you that they were.
That gap matters more than it sounds.
If you trade the news, you have to be right about the announcement, right about how the market will interpret it, and right about the timing. Three predictions stacked on top of each other, made before the event.
If you read the chart, you wait until the market has told you what it thinks. You act after, not before.
There is a second lesson sitting next to the first one. Gold and silver both received the same news. Gold’s direction resolved and silver’s did not. Same event, same session, two different outcomes, because the two charts were in different positions when it arrived.
News is the same for everyone. The chart is specific to the instrument in front of you.
