EUR USD Price Forecast Today (EURUSD)
This EUR USD forecast today reads SELL, with both direction timeframes down while all three entry timeframes point up.
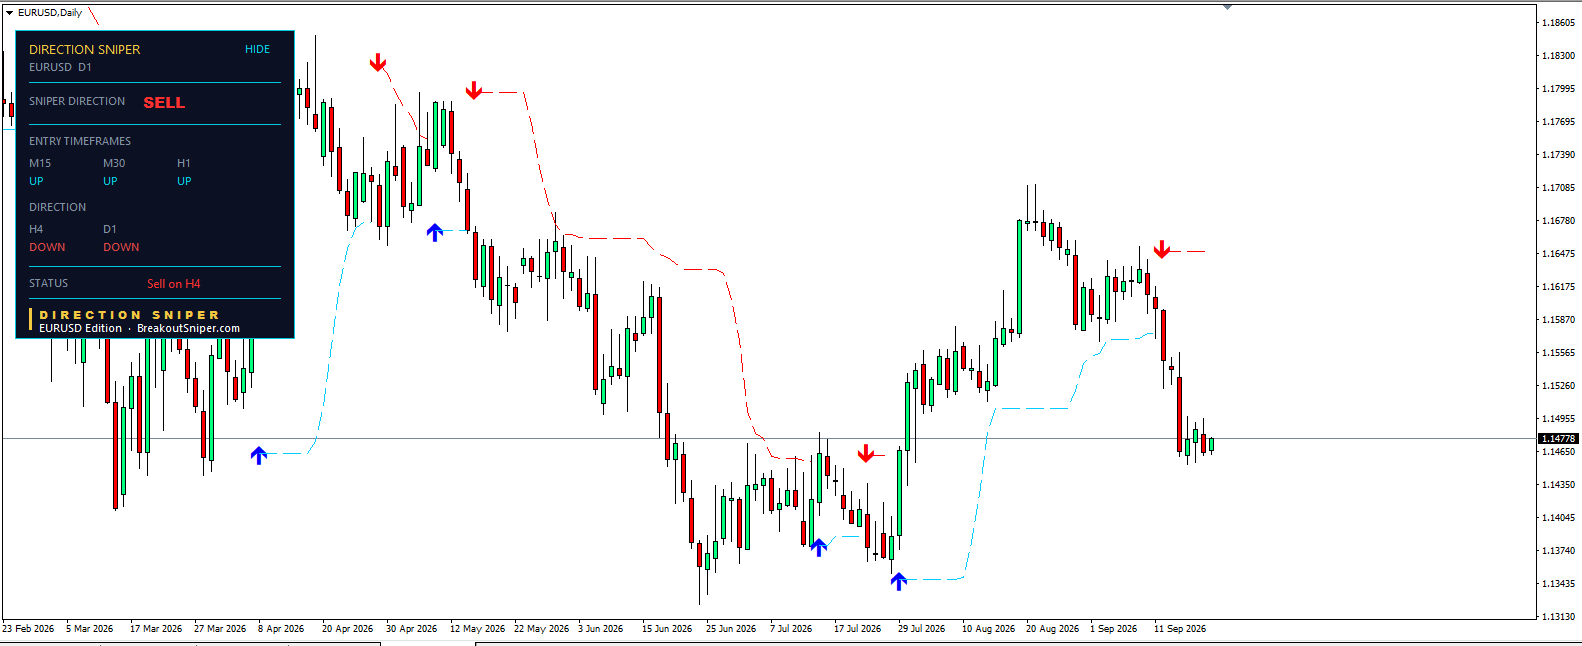
Direction Sniper reads SELL on EURUSD. Status: Sell on H4.
Both direction timeframes are down. H4 reads DOWN and the daily reads DOWN, so the verdict is set. On the entry timeframes, all three read UP: M15, M30 and H1.
Price is at 1.14778.
A Sell Verdict With Everything Fast Pointing Up
This is worth sitting with, because it is the opposite of what most people expect a signal tool to show.
The direction is down. Every fast chart is pointing up. And the panel will still only build sell tickets, because direction is set by the H4 and daily, and neither of those cares what the 15 minute chart did in the last hour.
What you are looking at is a bounce inside a downtrend. Price fell from around 1.1680 in early September to roughly 1.1455, and it has spent the last few sessions grinding back up to 1.14778. The fast charts have turned up to reflect that bounce. The daily has not moved.
So there is no ticket. The panel is waiting for an entry timeframe to turn back down while the direction stays down, which is the same waiting it does in an uptrend, just mirrored.
What the Daily Chart Shows
EURUSD has printed eight daily signals since March, and the pattern is worth noting.
A blue arrow printed around mid March near 1.1435, and price ran up to about 1.1820 by late April, where a red arrow printed. A second red arrow followed in early May near 1.1790 and that one ran for six weeks, taking price from roughly 1.1790 down to about 1.1313 by late June.
July was choppy. A red arrow near 1.1465, then blue arrows near 1.1374 and again near 1.1345 within two weeks. Three signals in a month with price going nowhere.
August was the opposite. Price climbed from around 1.1345 to roughly 1.1680 by early September without a single daily signal against it.
The most recent red arrow printed around 11 September near 1.1647. That is the signal currently setting the daily direction.
The Levels That Matter
- The red trailing line above, around 1.1647. It has been flat since the September red arrow. A daily close above it would turn the daily up and end the SELL verdict.
- The recent low, around 1.1455. Where the September fall stopped. A break below it puts price back in the direction the daily is pointing.
- The June and July lows, around 1.1313 to 1.1345. The base this year’s range has been built on.
Price at 1.14778 sits just above the first of those, with a long way to the trailing line above.
What Changes the Picture
If M15, M30 or H1 turns back down while the H4 and daily stay down, a sell ticket appears on that timeframe with an entry, a stop and three targets. If the H4 turns up, the verdict becomes NO TRADE and the panel stands aside. A daily close above 1.1647 would turn the direction up entirely.
Until one of those happens, the bounce continues and there is nothing to trade.
The Setup: Waiting on a Sell Signal from M15, M30 or H1
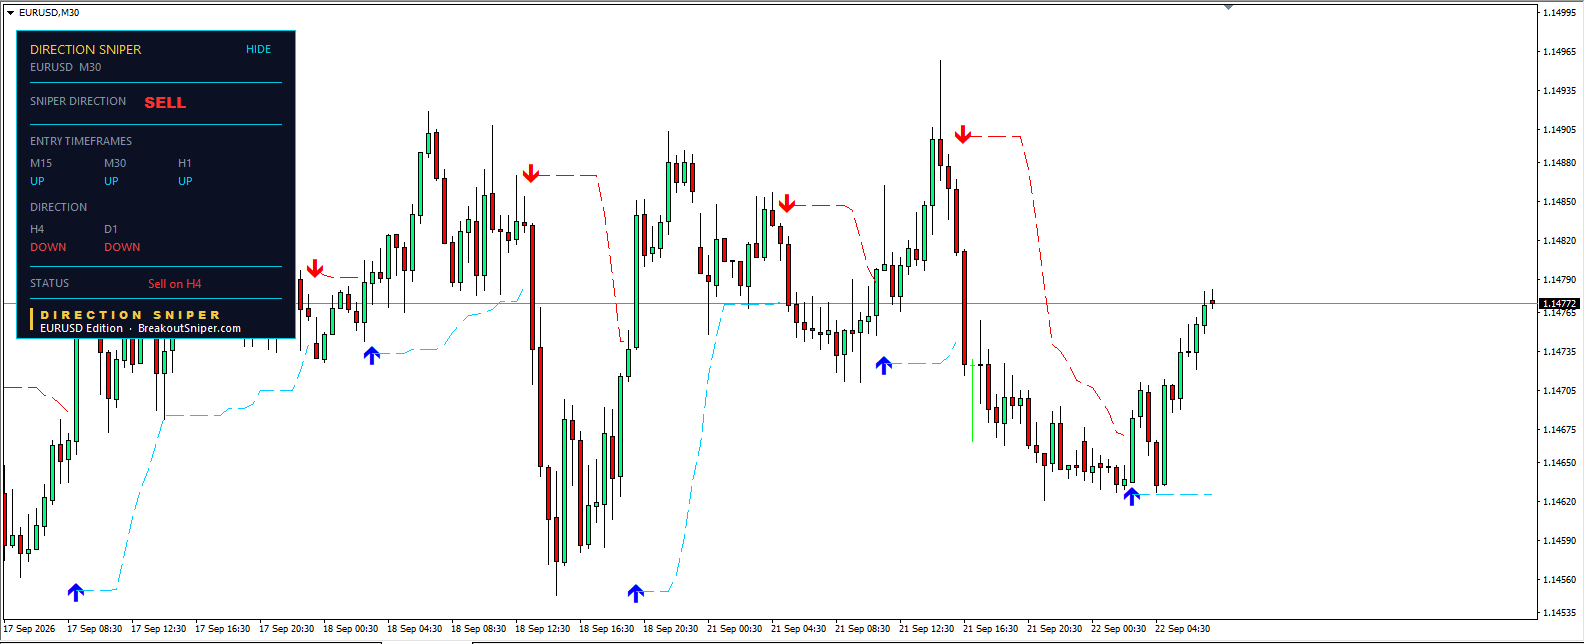
The verdict is SELL. H4 and daily are both down. Status reads Sell on H4, which means the H4 is the only timeframe currently agreeing with the verdict.
Price is at 1.14772.
All three entry timeframes read UP, so there is no ticket. What the panel is waiting for is one of them to turn back down while the direction stays down. The M30 chart shows what that looks like and where the level sits.
What the M30 Chart Shows
The M30 turned up in the early hours of this morning. A blue arrow printed around 00:30 on 22 September near 1.1462, and price has climbed to 1.14772 since.
The cyan dashed line now sits beneath price around 1.1462 and rises slowly with each candle. That line is the level the M30 has to close back below before a red arrow prints and a sell ticket appears.
At 1.14772, price is roughly 15 pips above it.
Why the Blue Arrow Produced Nothing
This is the part that matters most on a chart like today’s.
A blue arrow printed on M30 this morning, and the panel built nothing from it. It could not. The verdict is SELL, so the only tickets the panel will ever construct are sells. A buy signal on an entry timeframe, while the direction is down, is a bounce to wait through, not a trade to take.
That is the same rule that kept buyers out of trouble on crypto this morning, running in the opposite direction. There the verdict was BUY and the red arrows on the fast charts were ignored. Here the verdict is SELL and the blue arrows are ignored. One rule, applied without reference to which way it happens to point today.
What a Signal Would Look Like
If price closes back below the line on M30, a red arrow prints and the panel builds the ticket automatically:
- Entry at that closing price
- Stop at the band where the arrow prints, sitting above the entry on a sell
- Target 1 one times that stop distance below entry
- Target 2 two times
- Target 3 three times
Every number comes from the one stop distance, so the ticket sizes itself to the market rather than to a fixed pip count. On a tight range like the last few days, that stop distance will be small, and the targets will be correspondingly close together.
The same happens on M15 or H1 if either turns first. M15 sits closest to price and will usually signal earliest. H1 sits furthest away and waits for more of the bounce to be finished before it commits.
The Honest Warning on This Chart
Look at how many arrows have printed on this M30 in five days.
A red arrow on 17 September, a blue arrow the same evening. A red arrow on 18 September, a blue arrow four hours later. A red arrow on 21 September, a blue arrow four hours after that. Another red arrow later on 21 September, and a blue arrow this morning.
Eight arrows since 17 September. In that time EURUSD has moved between roughly 1.1444 and 1.1497, a band of about 53 pips, and finished almost exactly where it started.
That is what a range does to any signal tool, including this one. Price keeps crossing back and forth over the level, and the tool keeps reporting it, because that is its job. It is not broken and it is not being clever. It is describing a market that has not decided anything.
The daily verdict is still SELL, so the direction is clear enough. What is not clear is the timing, and on a chart like this one the timing costs more than usual to get wrong.
What Changes the Picture
- M30 closes back below around 1.1462. A sell ticket appears on that timeframe with entry, stop and three targets.
- M15 turns down first. Likely, since its band sits closest to price. Tighter stop, tighter targets, and on a range like this one, more false starts.
- H1 turns down. The slowest of the three, and the one that waits for the most of the bounce to finish.
- H4 turns up. The verdict becomes NO TRADE and none of the above matters until the direction returns.
- A daily close above 1.1647 would turn the daily up and end the SELL verdict entirely.
Until one of the first three happens, there is no ticket on EURUSD, and on a five day range that has gone nowhere, that is not a bad place to be.
Update, 22 September: the sell signal has printed on M30
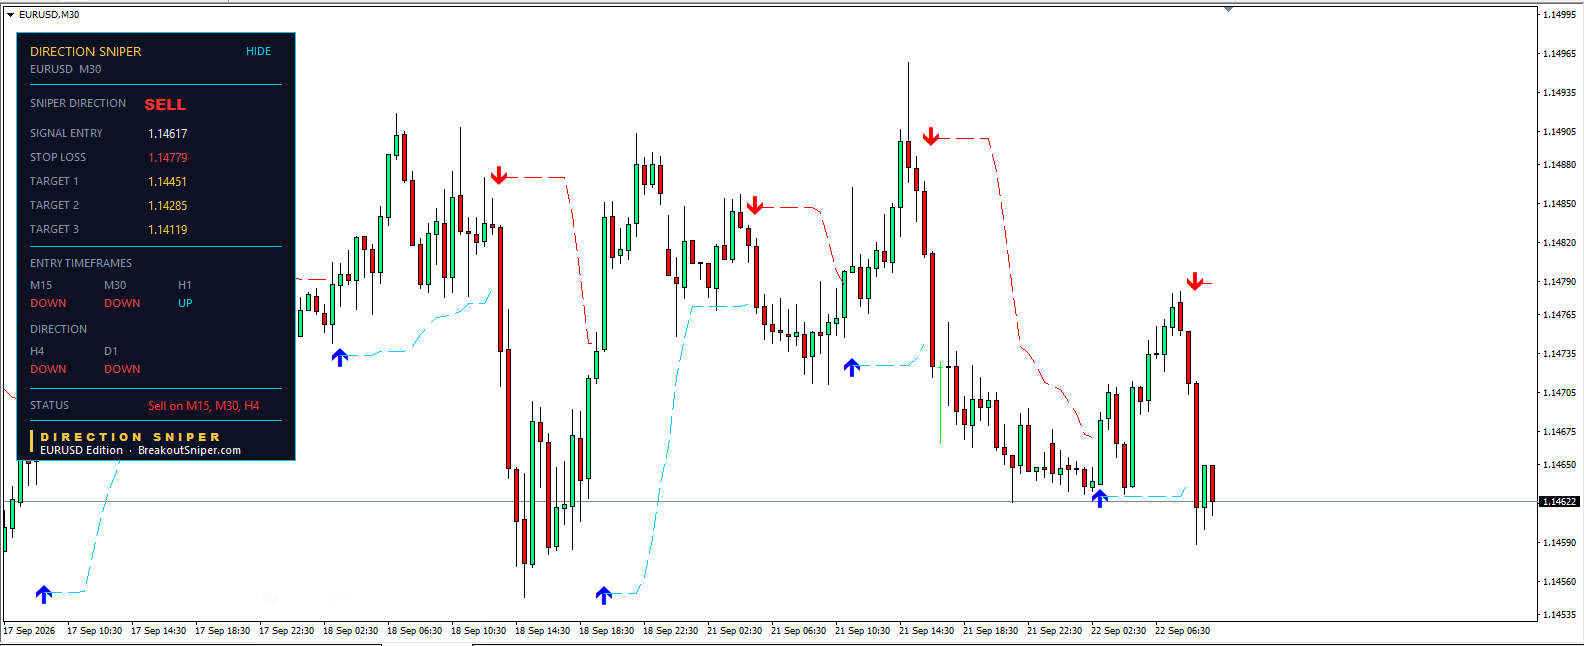
Earlier today this post said the M30 had to close back below around 1.1462 before a sell ticket would appear. That close happened, a red arrow printed, and the panel built the ticket.
The ticket
- Signal entry: 1.14617
- Stop loss: 1.14779
- Target 1: 1.14451
- Target 2: 1.14285
- Target 3: 1.14119
The stop sits about 16.6 pips above entry, and each target is one more 16.6 pip step below the last. Target 1 is one times the risk, Target 2 is two times, Target 3 is three times.
The status line now reads Sell on M15, M30, H4. The M15 turned down as well, the H1 is still up, and the direction timeframes are both still down.
Where price is right now
1.14622, which is a few points above the signal entry. Target 1 has not been reached. The stop has not been passed. Nothing has happened yet.
What the targets are asking for
This is the part worth thinking about before the outcome arrives.
Target 1 at 1.14451 sits almost exactly on the low of the five day range, around 1.1444. So the first target only asks price to travel back to the bottom of ground it has already covered twice this week.
Targets 2 and 3, at 1.14285 and 1.14119, sit below that range entirely. Reaching either of them requires EURUSD to break out of a range it has held since 17 September, not just traverse it.
That is a meaningful difference in what each target is asking for, and the panel does not distinguish between them. It measures three equal steps from the stop distance and prints them. Whether the market is willing to travel that far is not something the arithmetic knows.
Published before the outcome, and left alone afterwards
This section is going up while the trade is open. Target 1 is unreached, the stop is unpassed, and nobody knows what happens next, including us.
We are not going to come back and quietly edit it if it works, or remove it if it does not. Tomorrow’s read will report where it ended, either way.
Anyone can publish a walkthrough after the targets are hit. The question worth asking of any tool is what it said before, and this is what it said before.
Trade ticket levels are indicator output, shown for education, not a recommendation to trade. This ticket is open and its outcome is unknown. Educational analysis, not financial advice. Trading carries risk and you can lose money.

