Bitcoin Price Forecast Today (BTCUSD)
Direction Sniper reads BUY on Bitcoin. Status: Buy on H1, H4.
Both direction timeframes are up. The daily reads UP and the H4 reads UP, so the verdict is set. On the entry timeframes, H1 is up while M15 and M30 have turned down.
Price is at 85,518.36.
What the Daily Chart Shows
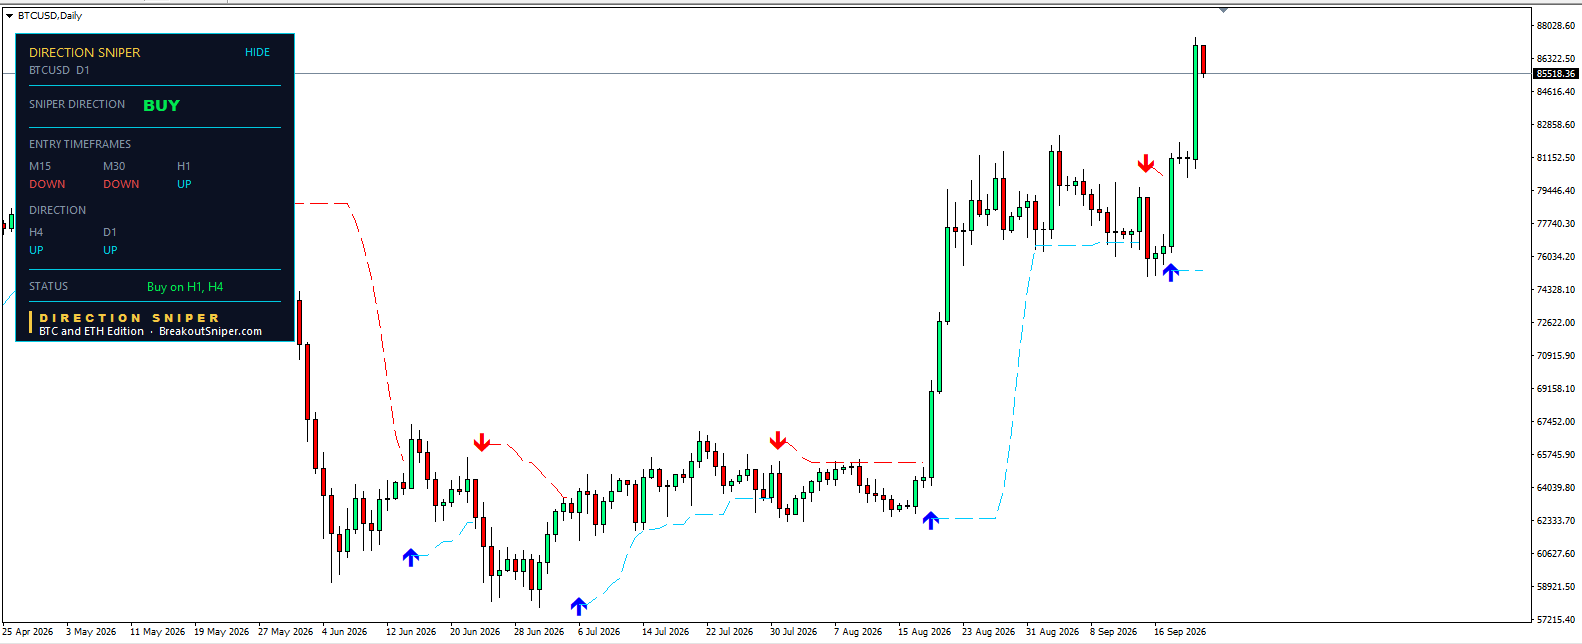
The daily has printed six signals since late spring, and the spacing tells you how this market has behaved.
A blue arrow printed around 12 June near 60,600, and a red arrow followed about a week later near 65,700. That pair was the market going nowhere, two signals inside a fortnight with no move to show for it.
The blue arrow in early July near 58,900 was different. It marked the low and held for three weeks while price climbed back toward 65,700, where a red arrow printed around 30 July.
Then came the move that set up everything since. A blue arrow printed around 15 August near 62,300, and Bitcoin went from roughly 62,300 to the high 70s in about a week. That signal ran for a month before a red arrow printed around 16 September near 81,100.
That red arrow lasted days, not weeks. Price fell to around 75,500, a blue arrow printed around 19 September, and the daily turned back up.
Where That Leaves Price Now
The candle that followed is the one that matters. Bitcoin cleared the range it had held since late August and reached roughly 88,000 before settling back to 85,518.
Three levels are worth marking on the daily:
- The recent high, around 88,000. Reached in the last two sessions and not yet tested again.
- The old range top, around 82,800. This capped every attempt through late August and mid September. It now sits below price, which means it should hold as support if the breakout is real.
- The trailing level, around 75,800. Rising since the 19 September blue arrow, and a long way beneath price.
The gap between price and that trailing level is the thing to notice. The daily has a lot of room before anything on this timeframe is in question.
What Changes the Picture on the Daily
A daily close back below around 82,800 would put price inside the old range again and turn the breakout into a failed one. A close below the trailing level near 75,800 would turn the daily down and end the BUY verdict entirely. Until either happens, the daily is pointing up and the panel will keep looking for buys on the entry timeframes.
The Closed Trade on H1
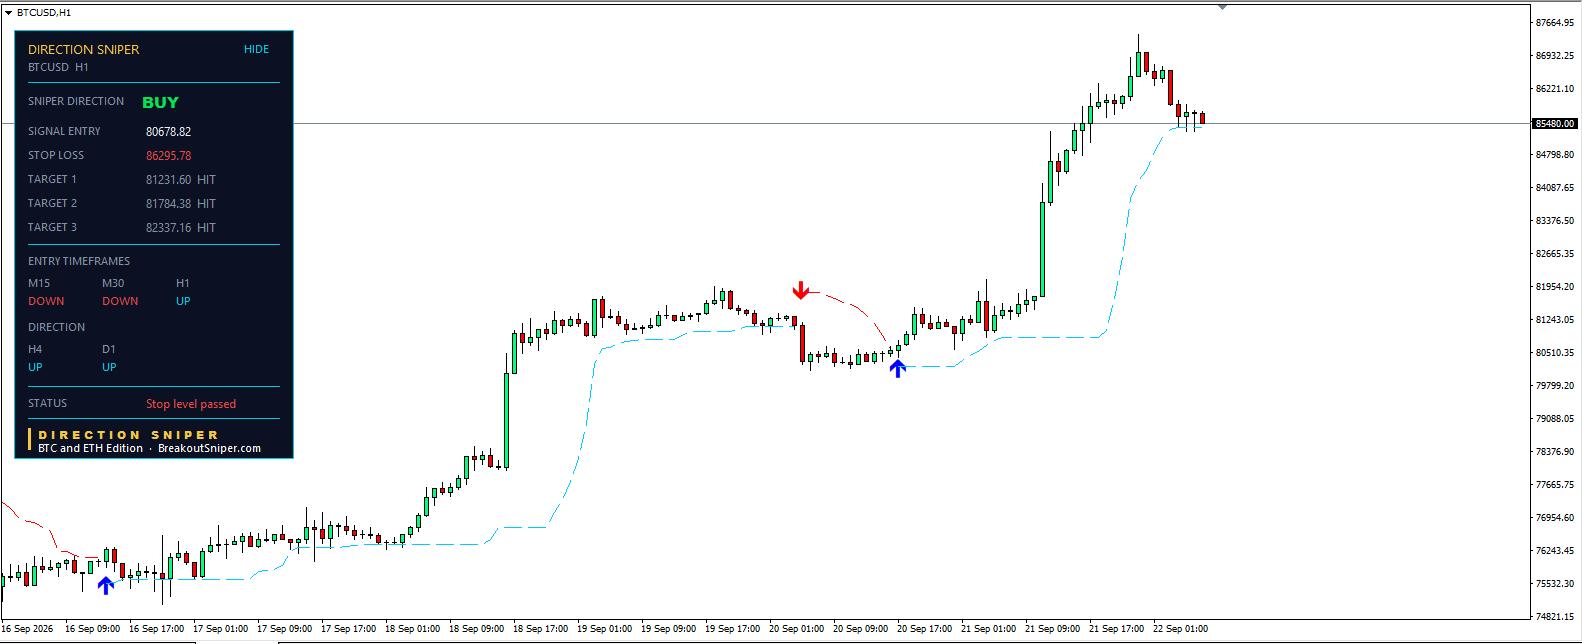
This is the ticket that printed on Sunday, now complete. Here is how it ran from start to finish.
Step 1: The setup
A red arrow printed on H1 in the early hours of 20 September near 81,900, and price fell to around 79,900 over the next few hours. On the H1 chart alone, that looked like a turn down.
The H4 and daily were both up, so the verdict stayed BUY. The panel ignored the red arrow, because a sell signal on an entry timeframe is not a trade when the direction says buy. It is a pullback to wait through.
Step 2: The signal
Around midday on 20 September, a blue arrow printed on H1 near 80,300. That agreed with the verdict, so the panel built a ticket.
Step 3: The ticket
- Signal entry: 80,678.82
- Stop at entry: around 80,126
- Target 1: 81,231.60
- Target 2: 81,784.38
- Target 3: 82,337.16
The stop sat about 553 points below entry, and each target sits one more 553 point step above the last. Target 1 is one times the risk, Target 2 is two times, Target 3 is three times. Every number on the ticket comes from that one stop distance.
Step 4: The targets
Price turned up from the signal bar and did not look back. Target 1 and Target 2 were reached through the evening of 20 September. Target 3 at 82,337.16 was reached on the morning of 21 September, and all three now show HIT on the panel.
At Target 3 the position was fully closed. The trade was over roughly a day after the signal printed.
Step 5: What happened next, and why the status line is red
Bitcoin kept going. It ran to roughly 87,664 on the evening of 21 September before pulling back to 85,480, where it sits now.
The stop field on the panel currently reads 86,295.78, and the status line reads Stop level passed. Neither of those describes this trade.
The panel keeps tracking the trailing level after a ticket completes. That level followed price up during the run to 87,664, and when price pulled back it crossed back through it, so the status line reports it. There was no position left for it to affect. The trade closed at Target 3 more than 3,900 points below where that level now sits.
Read the three HIT labels, not the status line. The ticket finished when Target 3 was reached.
Step 6: The honest number
Target 3 closed the trade at 82,337.16. Bitcoin went on to about 87,664.
That is roughly 5,300 points of further move that this ticket did not capture, on a trade where the entire risk at entry was 553 points. The targets did exactly what they were built to do, and the market went nearly ten times the risk distance beyond where they closed it.
Both things are true at once, and any walkthrough that shows you the three HIT labels without that second number is showing you half the trade.
The Next Setup: A Pullback on M30 or M15
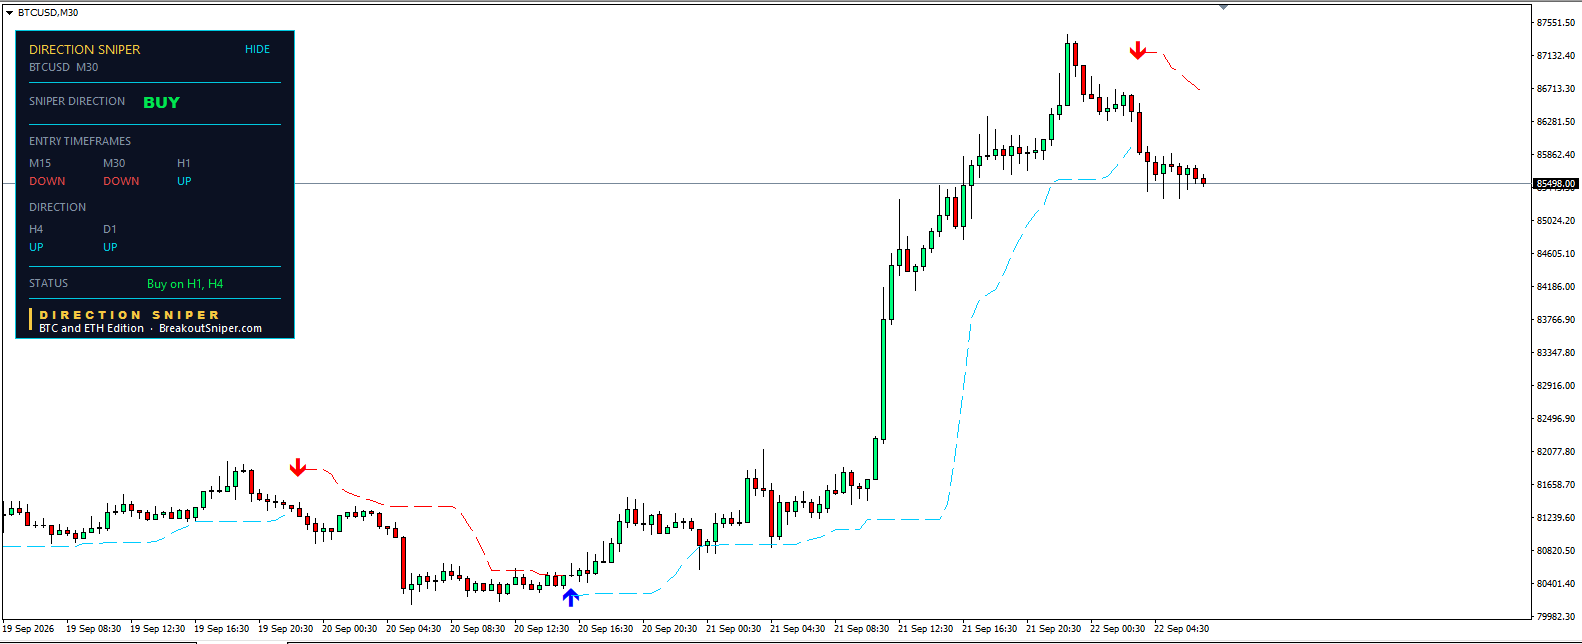
The verdict is BUY. H4 and D1 are both up, and while that stays true the panel is only looking for buys. Status reads Buy on H1, H4.
What it is waiting for is a signal on M30 or M15, and both of those have turned down.
What the M30 Chart Shows
Price is at 85,498.00.
A red arrow printed on M30 in the early hours of this morning near 87,100, after Bitcoin reached roughly 87,551 yesterday evening. Since then price has come back to around 85,000 and is holding just above it.
The red dashed line now sits above price, around 86,700, and it falls a little with each candle. That line is the level the M30 has to close back above before it turns up again.
So the reading is simple. The direction is up. The M30 is in a pullback. The pullback has a number attached to it.
Why the Red Arrow Is Not a Sell
A red arrow on M30 while the verdict is BUY does not produce a sell ticket. It cannot. The direction is set by H4 and daily, and both are up, so the only trades the panel will build are buys.
That arrow is the panel telling you a pullback has started on the 30 minute chart, nothing more. On a market where the daily is pointing up, that is information about timing, not about direction.
What a Signal Would Look Like
If price closes back above the red line on M30, a blue arrow prints and the panel builds a ticket automatically: an entry at that close, a stop at the band where the arrow prints, and three targets measured in equal steps from that stop distance. The same happens on M15 if it turns first, with a tighter stop and tighter targets because the level sits closer to price.
Whichever turns first is where the ticket appears. That is the only decision the panel makes here, and it makes it on a bar close, not on a hunch.
Worth Noticing, and Worth Not Over-Reading
This is close to the same reading the panel gave on the morning of 20 September. A red arrow printed on M30 near 82,000, price pulled back to around 80,000, and a blue arrow followed later that day near 80,200 with the direction still up.
That does not mean today repeats it. A pullback can keep going, the H4 can turn down, and the verdict can disappear before any signal prints. The panel is not forecasting anything by showing the same shape twice. It is describing a condition, and the condition resolves either way.
What Changes the Picture
- M30 or M15 closes back above its line. A ticket appears on that timeframe with entry, stop and three targets.
- H1 turns down. All three entry timeframes would then be pointing down against the verdict, which is a deeper pullback, not a signal.
- H4 turns down. The verdict becomes NO TRADE, the panel stands aside, and nothing on M30 or M15 matters until the direction returns.
Until one of those happens, there is no ticket, and the correct action is the one that feels like inaction.
Ethereum Price Forecast Today (ETHUSD)
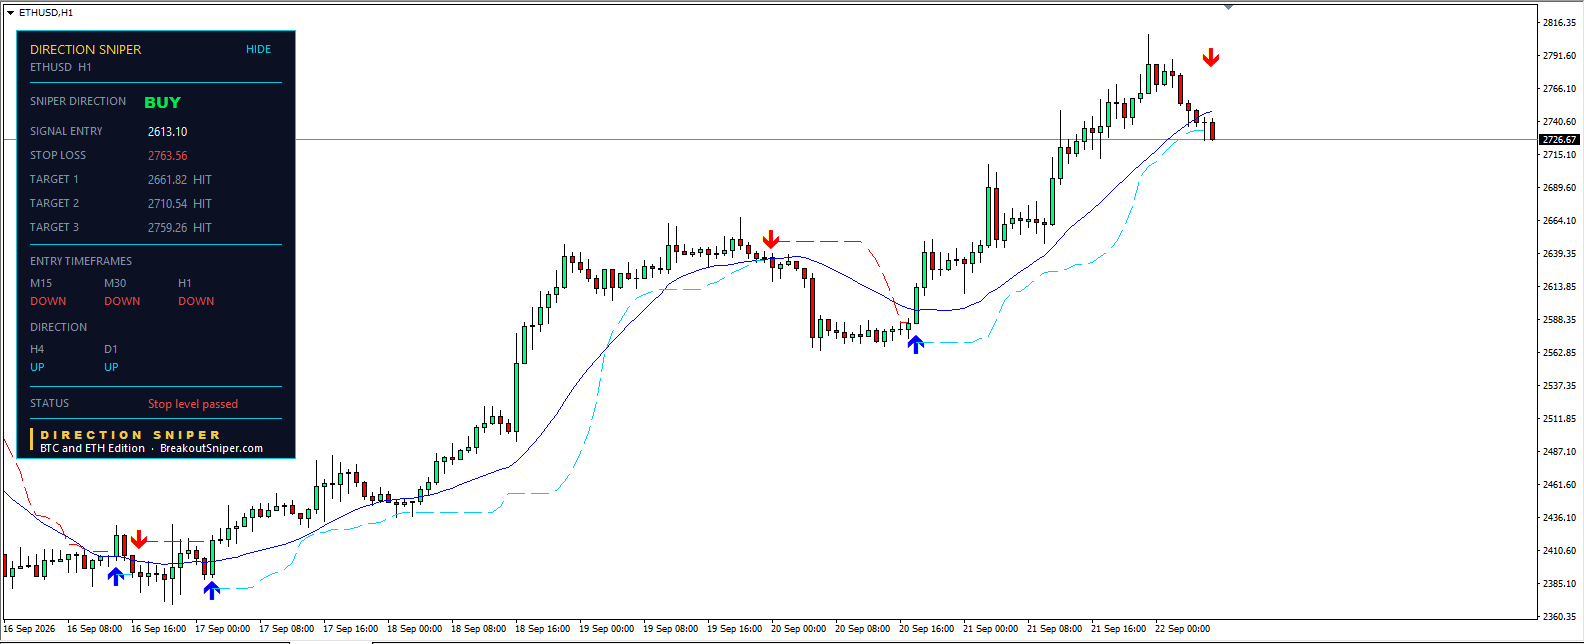
Direction Sniper reads BUY on Ethereum. H4 and D1 are both up.
All three entry timeframes have turned down: M15, M30 and H1. Price is at 2,726.67, and the status line reads Stop level passed.
The Closed Trade on H1
Ethereum ran the same sequence as Bitcoin, on the same days, and the ticket is now complete.
Step 1: The setup
A red arrow printed on H1 in the evening of 19 September near 2,650, and price fell to around 2,570 over the following hours. The H4 and daily were both up, so the verdict stayed BUY and the panel treated that arrow as a pullback rather than a trade.
Step 2: The signal
Around midday on 20 September, a blue arrow printed on H1 near 2,575, in the direction of the verdict. The panel built a ticket.
Step 3: The ticket
- Signal entry: 2,613.10
- Stop at entry: around 2,564.38
- Target 1: 2,661.82
- Target 2: 2,710.54
- Target 3: 2,759.26
The stop sat about 48.7 points below entry, and each target is one more 48.7 point step above the last. Same structure as the Bitcoin ticket, scaled to Ethereum’s price.
Step 4: The targets
Price turned up from the signal bar and climbed through 20 and 21 September. Target 1 and Target 2 were reached during that run, and Target 3 at 2,759.26 was reached on 21 September. All three show HIT.
The position was fully closed at Target 3. The trade was over about a day after the signal printed.
Step 5: Why the status line is red
Ethereum reached roughly 2,816 on the evening of 21 September, then a red arrow printed on H1 in the early hours of this morning near 2,790 and price pulled back to 2,726.67.
The stop field now reads 2,763.56. That is the trailing level as it stands today, not the stop this trade closed on. The panel keeps tracking it after a ticket completes, so when price came back through it the status line reported it.
The trade closed at Target 3. Read the three HIT labels, not the status line.
The Number Worth Comparing
Here is where Ethereum and Bitcoin differ, and it is the most useful thing on the page today.
Ethereum’s Target 3 closed the trade at 2,759.26, and price went on to about 2,816. That is roughly 57 points beyond the last target, on a trade where the risk at entry was 48.7 points. A little over one times the risk left on the table.
Bitcoin’s Target 3 closed at 82,337.16, and price went on to about 87,664. That is more than 5,300 points beyond the last target, on a risk of 553 points. Close to ten times the risk left on the table.
Same method. Same three targets. Same two days. On one coin the targets caught almost the whole move, and on the other they caught the first tenth of it.
You cannot know in advance which one you are in. That is the honest version of what fixed targets do: they give you a defined exit every time, and the size of what you leave behind is decided by the market, not by you.
Where Ethereum Sits Now
All three entry timeframes are down, which is a deeper pullback than Bitcoin is showing, where H1 is still up.
The verdict is still BUY, because the direction is set by H4 and daily and both are still up. So the panel is doing the same thing on Ethereum as on Bitcoin: waiting for an entry timeframe to turn back up while the direction holds. Ethereum simply has further to come back, since all three of its fast charts have to start from down.
What Changes the Picture
- M15, M30 or H1 closes back above its line. A ticket appears on that timeframe.
- H4 turns down. The verdict becomes NO TRADE, and the panel stands aside until the direction returns.
- A drop below the area around 2,570, where the last signal printed, would take price back to where this move started.
The Next Setup on Ethereum: M30 and M15
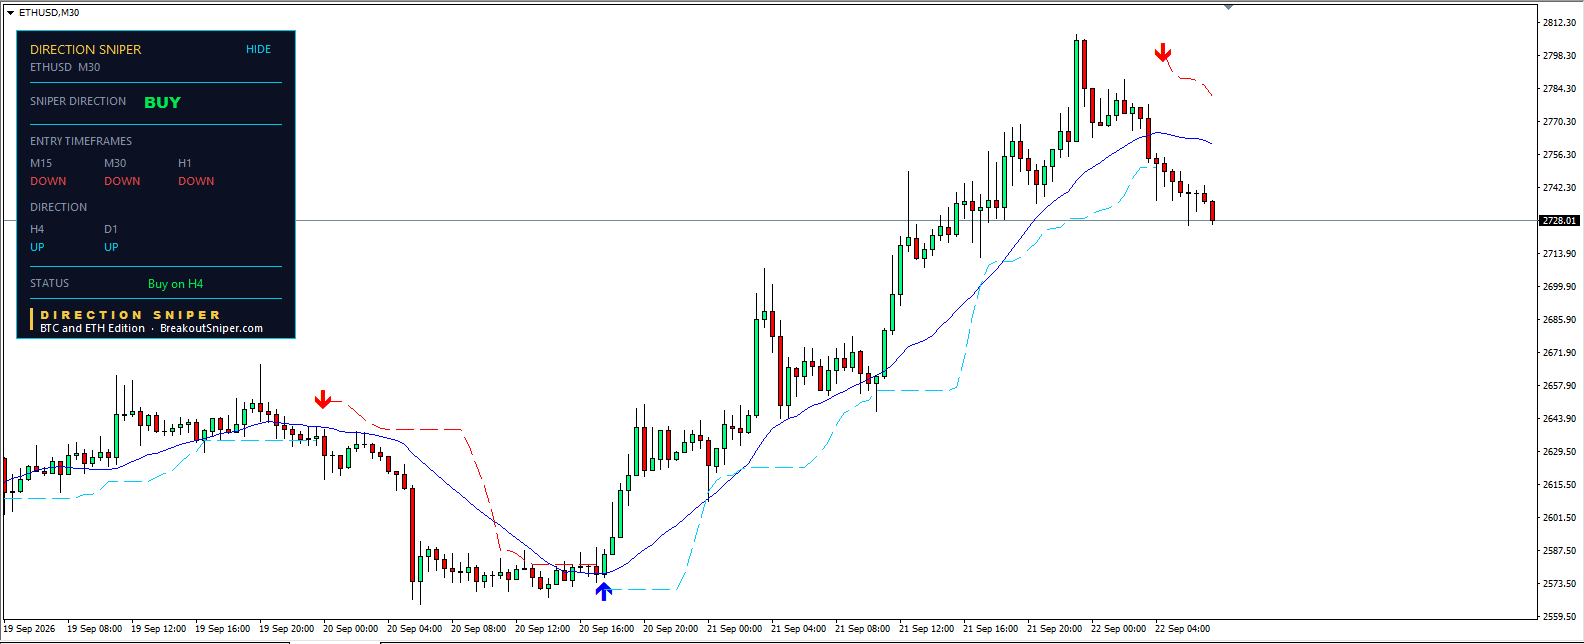
The verdict is BUY. H4 and D1 are both up. But the status line reads Buy on H4 only, which means the H4 is the single timeframe currently agreeing with the verdict. M15, M30 and H1 have all turned down.
Price is at 2,728.01.
What the M30 Chart Shows
Ethereum reached roughly 2,812 late yesterday evening. A red arrow printed on M30 in the early hours of this morning near 2,800, and price has come back to 2,728.
The red dashed line now sits above price around 2,786 and falls slightly with each candle. That is the level M30 has to close back above before a blue arrow prints and a ticket appears.
At 2,728, price is about 58 points below that line. Ethereum has to recover roughly two percent of its price before the M30 turns.
Which Timeframe Is Most Likely to Signal First
M15, almost certainly. Not because it is better, but because it is faster.
The M15 band sits closer to price than the M30 band does, simply because it is calculated over a shorter window. Price does not have to travel as far to cross it. On any pullback that turns, the 15 minute chart will usually turn first, then the 30 minute, then the hour.
That is worth understanding properly, because “first” and “best” are not the same thing.
The Trade Off Between the Two
A signal on M15 gives you a ticket with a tighter stop, because the band it measures from sits closer to the entry. Tighter stop means tighter targets, since all three are measured in equal steps from that stop distance. The trade completes faster and the numbers are smaller in both directions.
A signal on M30 gives you a wider stop, wider targets, and a trade that takes longer to resolve.
There is a second difference that matters more. The faster the timeframe, the more often it turns up inside a pullback that then keeps falling. M15 will produce more signals than M30, and a larger share of them will be false starts. M30 produces fewer, and waits for more of the pullback to be finished before it commits.
Neither is correct. They are different trade offs, and the panel shows both so you can pick rather than guess.
How Ethereum Compares With Bitcoin Right Now
Bitcoin’s status reads Buy on H1, H4. Ethereum’s reads Buy on H4.
That one word difference is the whole comparison. On Bitcoin the H1 is still pointing up, so only the two fastest charts have pulled back. On Ethereum all three entry timeframes are down, so the pullback has gone deeper.
Ethereum needs about two percent to turn its M30. Bitcoin needs closer to one and a half percent. Both are in the same condition, and Ethereum simply has more ground to recover.
What Changes the Picture
- M15 closes back above its line. The first ticket of the day would appear there, with the tightest stop and the tightest targets.
- M30 closes back above around 2,786. A slower signal with a wider stop and wider targets.
- H4 turns down. The verdict becomes NO TRADE and none of the above matters until the direction returns.
- A drop below around 2,573, where the last signal printed on 20 September, would take price back to where this entire move began.
Until one of the first two happens, there is no ticket on Ethereum, and the panel keeps waiting.
Adding the M15 Level
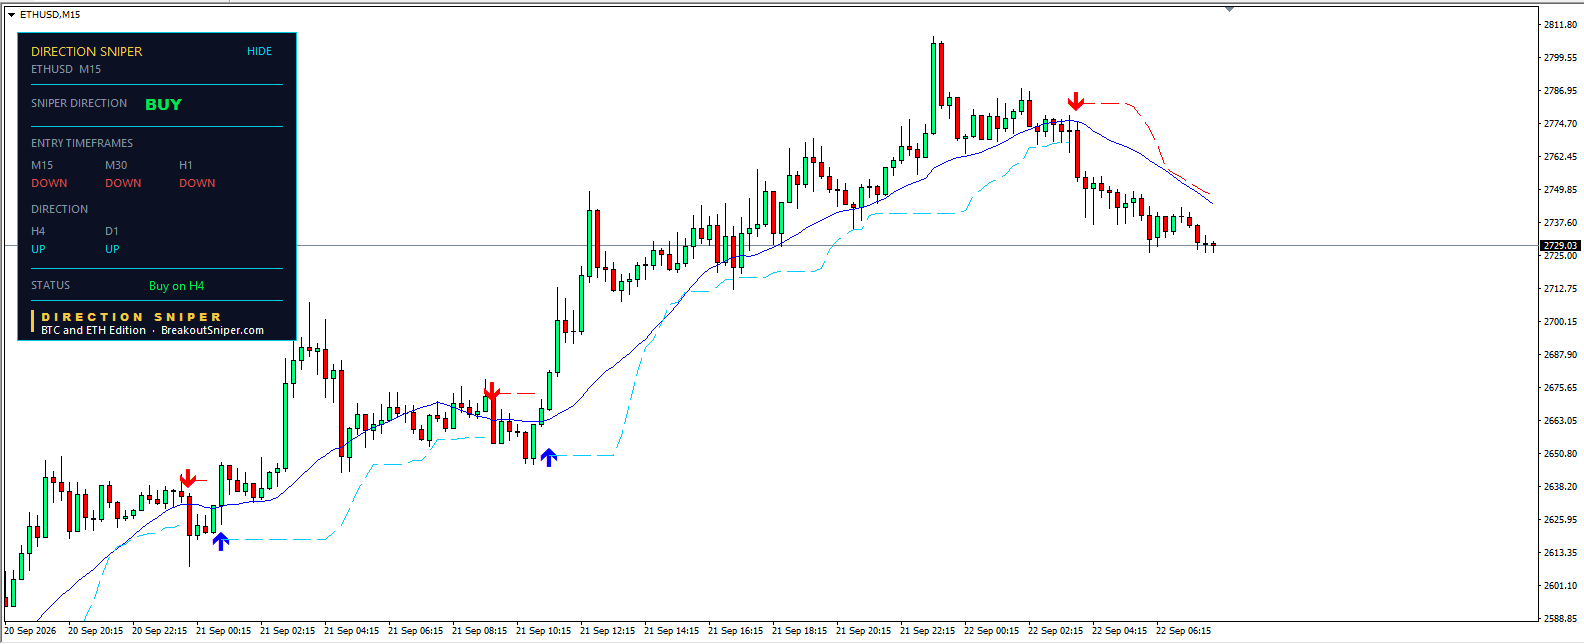
Price is at 2,729.03. Same panel reading: BUY verdict, all three entry timeframes down, status Buy on H4.
The red dashed line on M15 sits above price around 2,752 and is falling. That is the M15 trigger.
The Two Levels Side by Side
- M15 trigger: around 2,752, roughly 23 points above price
- M30 trigger: around 2,786, roughly 58 points above price
That gap is the whole argument from the previous section, made concrete. The M15 needs Ethereum to recover about 0.8 percent. The M30 needs about 2.1 percent, nearly three times as much ground.
If this pullback turns, M15 will signal first. It has the shortest distance to travel and it always will.
The Cost of Being First
Look at what the M15 did yesterday.
A red arrow printed late on 20 September near 2,640. A blue arrow followed about two hours later near 2,620. Another red arrow printed on the morning of 21 September near 2,672, and another blue arrow about two hours after that near 2,650.
Five arrows in roughly a day and a half, on the same market, during a move that the H1 chart described with a single signal.
That is what you get on the fastest entry timeframe. More opportunities and more noise, in the same package. Some of those flips sit inside a move that continues, and some sit inside a pullback that keeps going. The chart does not label them in advance.
The M30 printed one blue arrow across that same stretch, and the H1 printed one. Fewer chances, more of the pullback already finished before either committed.
Choosing Before It Happens, Not During
This is the practical point, and it is worth making before a signal prints rather than afterwards.
If you intend to take the M15, you are accepting a tighter stop, smaller targets, a faster result and more false starts. If you intend to take the M30, you are accepting a wider stop, larger targets, fewer trades and more waiting, including days like today where nothing triggers at all.
Decide which of those you are before the arrow appears. Once it prints, whichever timeframe fired will look like the obvious one to take, and that feeling is not analysis.
What Changes the Picture
- M15 closes back above around 2,752. First ticket of the day, tightest stop, tightest targets.
- M30 closes back above around 2,786. Slower signal, wider stop, wider targets.
- H4 turns down. Verdict becomes NO TRADE and neither level matters.
- A drop below around 2,573, where the last H1 signal printed on 20 September, would take price back to where this move started.

