USD CAD Forecast Today, 20 October 2026: Why Does Price Go Your Way Right After Your Stop Loss Is Hit?
This USD CAD forecast today answers the most frustrating question in trading: why does price go your way right after your stop loss is hit?
Every trader has lived it. You call the direction. A sharp move reaches your stop. The trade closes. And then, almost as if it was waiting for you to leave, the market goes exactly where you said it would.
USDCAD has just shown it in full. The Direction Sniper 4 hour sell from 13 October closed at its stop on a spike on 14 October. Today USDCAD trades at about 1.4085, roughly 155 pips below that entry, and past the level where all three of its targets sat. And the panel never stopped reading the direction. This morning it printed two fresh sells, and one has already reached its first target with its stop in front of entry.
Why does price go your way right after your stop loss is hit? Because a stop at a normal distance sits where ordinary rallies and spikes can reach it, while the bigger direction can stay exactly the same. A stop out tells you the room was too small for that swing. It does not tell you the direction was wrong. If the bigger timeframes still agree, the move can continue without you, so the real question after a stop loss is whether the bigger picture changed, and how you get back in when it has not.
The Board Today
| Chart | Entry | Stop or trailing stop | Targets | State |
|---|---|---|---|---|
| M15 | 1.40978 | 1.40968 (trailing) | 1.40861, 1.40743, 1.40626 | Target 1 reached, stop 1.0 pip in front of entry |
| M30 | 1.40933 | 1.41118 (stop loss) | 1.40748, 1.40562, 1.40377 | Fresh sell, running |
| H1 | UP against the verdict, price just below its line | |||
| H4 | 1.42408 | 1.42887 (stop loss) | 1.41929, 1.41450, 1.40971 | Closed at stop loss on 14 October |
The 4 hour and the daily both read DOWN, so the verdict is SELL. The status reads Sell on M15, M30, H4.
1. Why Price Moves Right After Your Stop Is Hit
There are three reasons, and none of them is bad luck.
Reason one: stops sit where rallies reach. Inside a downtrend, price does not fall in a straight line. It rallies, sometimes sharply. A stop placed a sensible distance above entry sits right in the zone those rallies travel through. When a spike reaches it, the trade closes, even though the trend has not changed.
Reason two: the direction and the room are two different questions. Your entry asked “which way?” Your stop asked “how much room?” A stop out answers only the second one. Most traders hear it as an answer to the first, decide they were wrong, and walk away.
Reason three: one ticket is not the trend. A single trade is one entry at one moment. The trend is the 4 hour and the daily. Unless those turn, the market is still pointing the same way, and the next entry is still ahead of you.
That is exactly what USDCAD has shown over the past week.
2. The USDCAD Story So Far
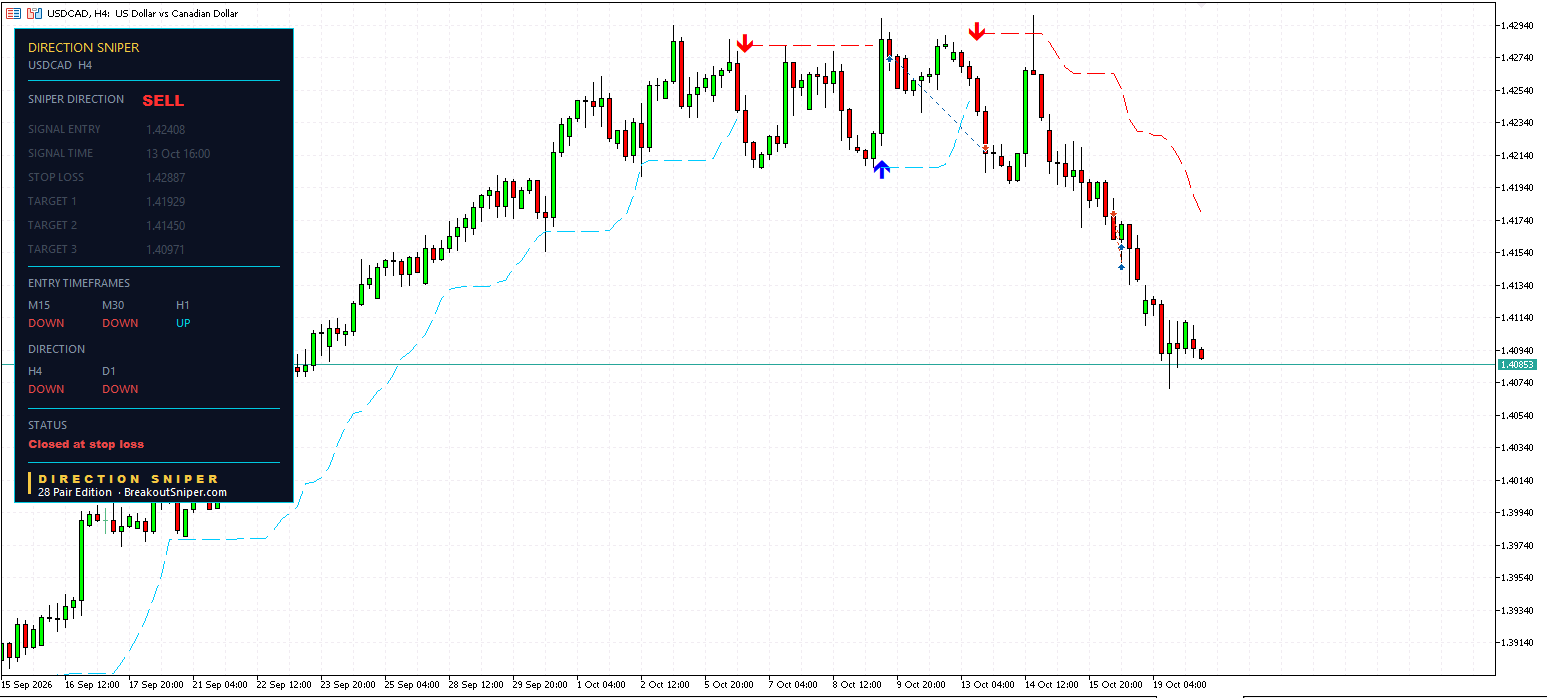
13 October: the 4 hour called it. A sell at 1.42408, with a stop at 1.42887. That is 47.9 pips of risk, and targets at 1.41929, 1.41450 and 1.40971.
14 October: the spike. USDCAD rallied sharply to around 1.4298. It reached the stop and the ticket closed. But the 4 hour and the daily both stayed DOWN. The verdict never flipped.
16 October onwards: the fast charts stepped in. With the bigger picture unchanged, the 15 minute and 30 minute lined back up with the verdict and the panel printed fresh sells lower down. In our USD CAD forecast on 19 October we counted seven targets reached after the stop out, and price sat 119 pips below the old entry.
Since Monday’s post, the move kept going. The 15 minute ticket from 1.41486, whose trailing stop sat 26.0 pips in front of its entry, closed at that trailing stop, in front of its entry. The 30 minute ticket from 1.41738 saw price trade down through 1.40967, the level where its Target 3 sat. And USDCAD dipped to around 1.4072.
Today: about 155 pips below the old 4 hour entry, beyond all three of its target levels.
The 4 hour ticket closed. The 4 hour direction never did.
3. This Morning: Target 1 Reached, Stop Already In Front
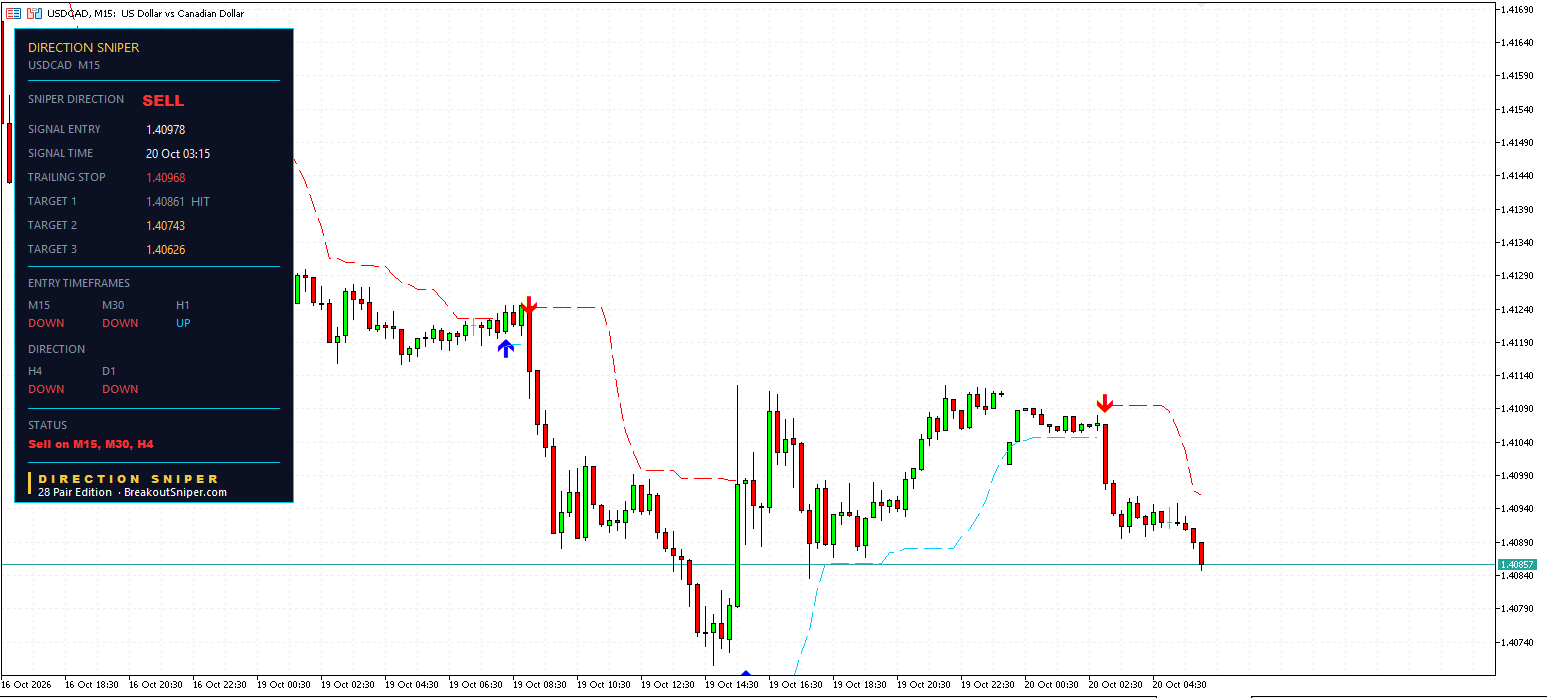
After an overnight bounce, the fast charts lined up again. The 15 minute sell printed at 20 October 03:15:
- Entry 1.40978
- Original stop 1.41095, so 11.7 pips of risk
- Target 1 at 1.40861, reached
- Target 2 at 1.40743, Target 3 at 1.40626
Its trailing stop now sits at 1.40968, which is 1.0 pip in front of the entry. It has tightened by 12.7 pips, more than the whole original risk. If that level is reached, the ticket closes in front of where it started.
That is the trade after the stop loss. The trader who walked away on 14 October does not see this ticket. The trader still reading the panel does.
4. The 30 Minute: A Fresh Sell
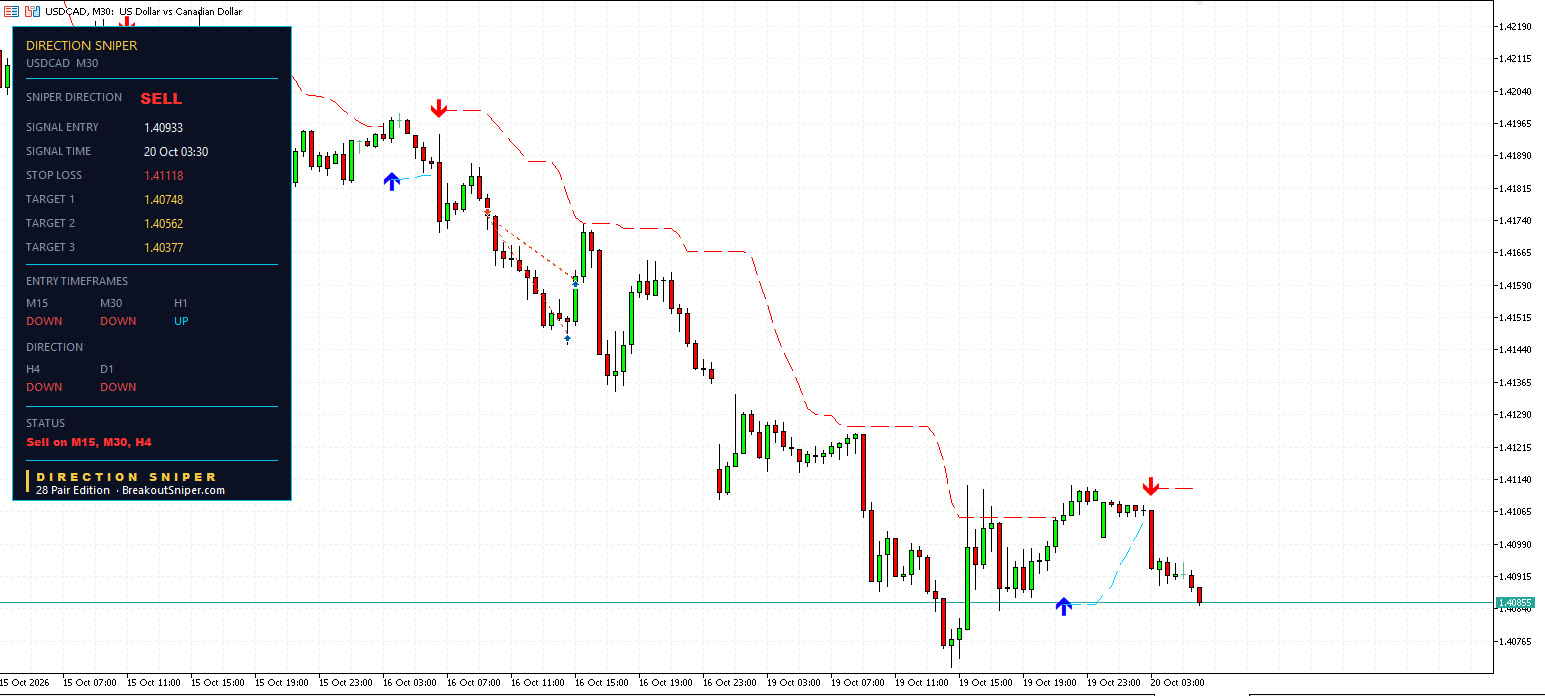
Fifteen minutes later, the 30 minute lined up too:
- Entry 1.40933 at 20 October 03:30
- Stop loss 1.41118, so 18.5 pips of risk
- Target 1 at 1.40748, Target 2 at 1.40562, Target 3 at 1.40377
Price sits at about 1.40855, roughly 7.8 pips in favour and 42 percent of the way to Target 1.
5. The Next Chart To Watch: The 1 Hour
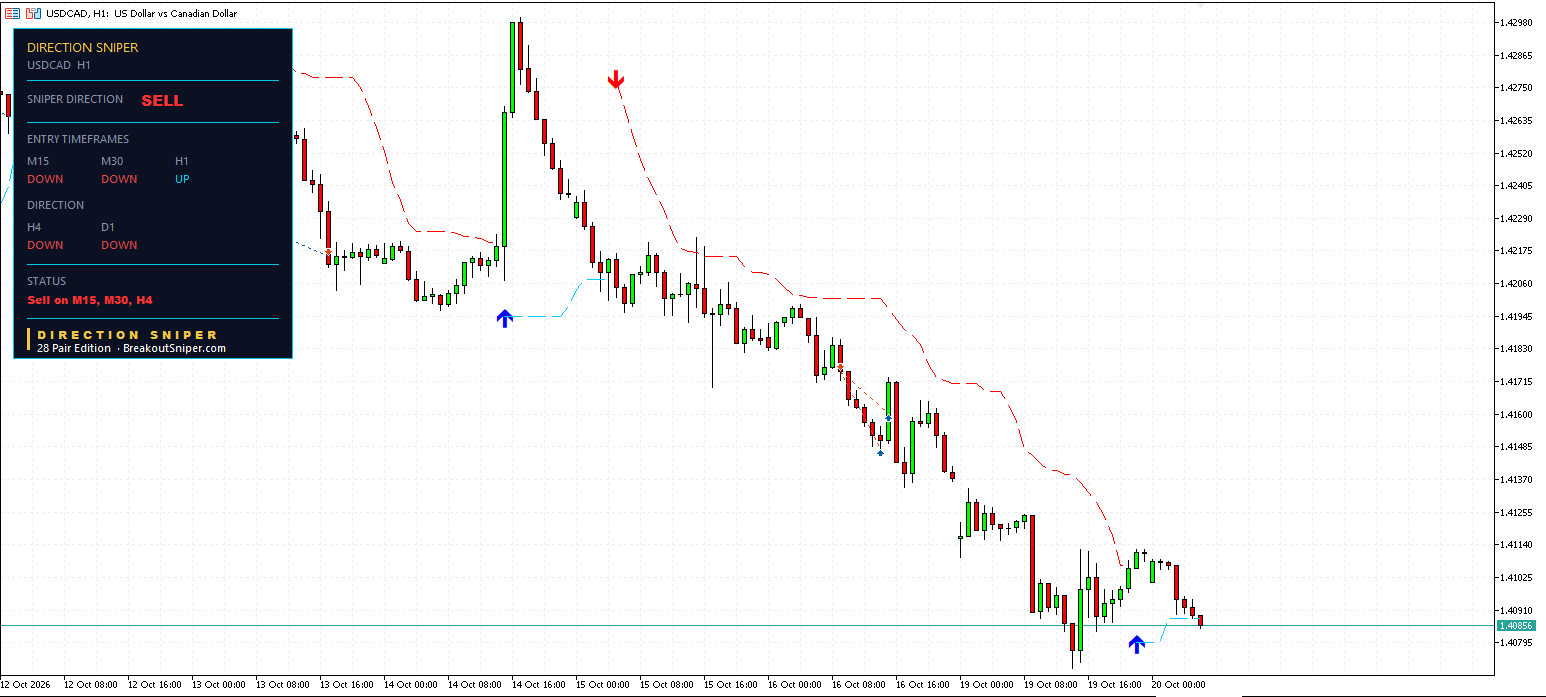
The 1 hour is the one chart not on the status line. It turned UP during the overnight bounce, so the panel shows no ticket on it.
But look where price is. The 1 hour’s blue trailing line sits at around 1.4087, and price is already about 1.5 pips below it. A 1 hour candle that closes below that line turns the chart back DOWN, lines it up with the verdict again, and the status would read Sell on M15, M30, H1, H4.
The other side, just as clearly: the M30 stop at 1.41118 is about 26 pips above price. If a bounce reaches it, that ticket closes there. Both levels sit on one screen. Nobody knows which comes first. The panel shows you which one happened.
6. What To Do After A Stop Loss: 3 Steps
The next time a stop is hit, run through this before you do anything else.
Step 1. Ask whether the bigger picture changed. Check the 4 hour and the daily. If they still point the same way, the stop out was about room, not direction. On USDCAD, both held DOWN the whole time.
Step 2. Wait for the next entry, do not chase. Do not jump straight back in at a worse price, and do not flip to the other side out of frustration. Wait for a faster chart to line back up with the verdict. On Direction Sniper, that is the moment a new ticket prints, with its own entry, stop and three targets.
Step 3. Make sure the stop out did not cost you the week. This step decides whether you are able to take Step 2 at all. If the loss was sized at 0.5 percent of your account, you can take the next ticket calmly. If it was 5 percent, you probably will not.
7. Lot Size: Why Small Risk Keeps You In The Game
We risk at most 2 percent of the account on a single trade, and usually 0.5 percent. On a 10,000 dollar account, 0.5 percent is 50 dollars.
USDCAD is priced in Canadian dollars, so one pip on a standard lot is worth 10 Canadian dollars, about 7.08 US dollars at today’s price. At 50 US dollars of risk:
- H4, 47.9 pips: about 0.15 lots. Sized like that, the 14 October stop out cost exactly what was planned, 50 dollars, and nothing more.
- M30, 18.5 pips: about 0.38 lots
- M15, 11.7 pips: about 0.60 lots
Notice that the fast chart tickets, with their tighter stops, take a bigger size for the same 50 dollars. Size every ticket to its own stop, never to the last one.
If you are worrying about every trade, your lot size is still too big.
Small account? On a 100 dollar account, 0.5 percent is 50 cents, and even the smallest 0.01 lot on today’s 15 minute ticket risks about 83 cents. A cent account fixes it, because lot sizes work in hundredths of a standard lot. We recommend a RoboForex Cent account or an XM Micro account.
We may earn a commission if you open an account through our links. It does not change the price you pay or the advice above.
8. The Same Lesson On Gold And Silver Today
Our gold and silver forecast this morning shows the other half of this lesson. Two gold tickets closed at their trailing stops on a bounce, neither chart turned UP, and gold then fell below the levels where their first targets sat. Meanwhile three tickets on the same board have their stops in front of entry.
Stop outs and protected tickets on the same board, the same week, in the same direction. That is what trading looks like when the direction is right and the risk is small.
9. Where The Levels Sit Now
USDCAD (price about 1.4085)
- M15: Target 2 at 1.40743, trailing stop 1.40968, in front of entry
- M30: Target 1 at 1.40748, stop loss 1.41118
- H1: UP against the verdict, blue line around 1.4087
- H4: closed, direction still DOWN
- Verdict SELL. Status: Sell on M15, M30, H4
Why We Publish This
Every read on this site comes straight from the Direction Sniper panel. We publish the tickets that close at their stops alongside the ones that reach their targets, and we keep coming back to show what happened next. You can check every number against the chart yourself.
Never Mistake A Stop Out For A Wrong Direction Again
USDCAD is in both the Direction Sniper Forex Majors Edition and the 28 Pair Edition.
- Direction. The 4 hour and daily held DOWN through the 14 October spike. A week later, price sits about 155 pips below the old entry.
- Rallies that have not broken structure. The spike reached a stop. It never changed the verdict, and the panel kept printing fresh sells lower down.
- The stop loss. Every ticket prints its stop before you enter, so every loss is sized before it happens. This morning’s 15 minute ticket already has its stop in front of entry.
The 28 Pair Edition covers USDCAD and 27 other pairs in one file, so when one chart shakes you out, the panel is already lining up the next entry.
See the Forex Majors and 28 Pair Editions
Want a read like this in your inbox? Join The Daily Sniper Read, free, every trading day.
Frequently Asked Questions
Why does price go your way right after your stop loss is hit?
Because a stop at a normal distance sits where ordinary rallies and spikes can reach it, while the bigger direction can stay exactly the same.
A stop out tells you the room was too small for that swing. It does not tell you the direction was wrong.
If the 4 hour and daily still agree, the move can continue without you, so the real question is whether the bigger picture changed.
Does a stop loss mean my trade idea was wrong?
Not necessarily. Your entry asked which way the market would go, and your stop asked how much room the trade needed.
A stop out answers only the question about room.
On USDCAD, the 4 hour sell from 1.42408 closed at its stop on 14 October, yet price later traded about 155 pips below that entry while the 4 hour direction stayed DOWN.
What should you do after a stop loss?
First, check whether the 4 hour and daily still point the same way.
Second, wait for a faster chart to line back up with the verdict instead of chasing price or flipping to the other side.
Third, make sure the loss was sized small, around 0.5 percent of the account, so you are calm enough to take the next entry.
Should you get back into a trade after being stopped out?
Only when the bigger picture is unchanged and a fresh entry appears.
On the Direction Sniper panel, that is the moment a faster chart lines back up with the verdict and a new ticket prints with its own entry, stop and three targets.
Size that new ticket to its own stop, never to the last one.
What is the USD CAD forecast today, 20 October 2026?
The 4 hour and daily both read DOWN on the Direction Sniper panel, so the verdict is SELL.
A 15 minute sell from 1.40978 has reached Target 1 at 1.40861, and its trailing stop at 1.40968 sits 1.0 pip in front of entry.
A 30 minute sell from 1.40933 has its stop at 1.41118 and Target 1 at 1.40748, and the 1 hour is the next chart to watch, with price just below its line around 1.4087.
How much should you risk per trade on USDCAD?
We risk at most 2 percent of the account on a single trade, and usually 0.5 percent.
USDCAD is priced in Canadian dollars, so one pip on a standard lot is worth about 7.08 US dollars at today’s price.
At 50 dollars of risk, today’s 11.7 pip 15 minute ticket is about 0.60 lots and the 47.9 pip 4 hour ticket was about 0.15 lots.
Does a reached target mean a trader made money?
No. Price reaching a published target level, or passing a level where a closed ticket’s target sat, is not the same as a realised result.
Fills, spreads, lot size and when each trader closed the position all change the outcome.
These posts report what the Direction Sniper panel showed, for education, and they are not a trade signal service.
Disclaimer: This post reports what the Direction Sniper panel showed on 20 October 2026. It is educational analysis, not financial advice and not a trade signal service. The 15 minute and 30 minute tickets were still open at the time of writing. The 1 hour line level is an approximate reading from the chart. Price reaching a published target level, or passing a level where a closed ticket’s target sat, is not the same as a realised result. Lot sizes are arithmetic for illustration and are not a recommendation about how much anyone should trade. Trading carries risk, and you should only trade money you can afford to lose.

