Currency Strength Today, 2 November 2026: The Dollar Spent The Weekend At The Bottom. Here Are Three Pairs, Six Currencies, And No Overlap
The market went home on Friday with the US dollar sitting at the bottom of the board. It came back on Monday morning, looked around, and found it was still there.
This currency strength today read starts with a quiet but important fact: the ranking did not move over the weekend. The Canadian dollar still leads. The US dollar is still last. And a fresh sell printed overnight on a pair that pits one of the strongest currencies against one of the weakest.
Below is what changed since Friday, today’s ranking, the pairs we think are trending best, our one currency, one position rule, what the dollar is really doing, and a first look at gold and silver.
1. What Changed Since Friday
In Friday’s currency strength read, USDCAD was our Pick of the Day. Over the weekend we wrote up the whole week in our currency strength this week recap.
The Ranking
| Group | Friday morning | Monday morning |
|---|---|---|
| Strongest | CAD, then CHF, then GBP | CAD, then GBP, then CHF |
| Weakest | USD, then EUR and NZD | USD, then EUR, then NZD |
| Middle | AUD and JPY | AUD and JPY |
One small shuffle: the British pound slipped past the Swiss franc into second place. Everything else held.
Friday’s Tickets, Checked
| Pair | Chart | Ticket | What happened |
|---|---|---|---|
| USDCAD | H4 | SELL from 1.39928 | Still running, trailing stop tightened to 1.40029 |
| USDCAD | H1, M30, M15 | SELL | Closed at their trailing stops on Friday’s late bounce |
| GBPUSD | H1 | BUY from 1.33559 | Target 1 reached, then closed 18.2 pips in front of the entry |
| GBPNZD | H1 | BUY from 2.36991 | Targets 1 and 2 reached, then closed 52.0 pips in front of the entry |
| XAUUSD | H1 | SELL from 4024.79 | All three targets reached |
| XAGUSD | M30 | SELL from 53.096 | All three targets reached |
2. Strongest And Weakest Currencies Today
| Group | Currencies |
|---|---|
| Strongest | CAD, then GBP, then CHF |
| Middle | AUD and JPY |
| Weakest | USD, then EUR, then NZD |
Think of it as a tug of war. Put a strong team against a weak team, and the rope moves. Put two equal teams together, and it just shakes in the middle.
Pairing the three strongest with the three weakest gives nine pairs where the rope should move:
USDCAD, USDCHF, GBPUSD, EURCAD, EURCHF, EURGBP, NZDCAD, NZDCHF and GBPNZD.
On the Direction Sniper board, all nine point the way the ranking says they should.
3. The Best Trending Pairs Today
Nine pairs passed the first test: a strong currency against a weak one. But not all nine are trending equally well this morning.
We run each one through the same three checks we explain in our guide to the best trending forex pairs:
- Strong against weak? Is one side clearly winning on the board?
- Do the timeframes agree? Are the entry charts pointing the same way as the 4 hour and the daily?
- Is the structure clean? Is each bounce stopping lower than the last in a downtrend, or each dip higher than the last in an uptrend?
Here is how the strongest candidates score:
| Pair | Strong against weak | Timeframes agree | Clean structure | Our read |
|---|---|---|---|---|
| NZDCHF | Yes | Yes, every chart DOWN | Yes, lower highs since 28 October | Trending best today |
| NZDCAD | Yes | Fresh sell ticket on the board | Not checked on the chart today | A strong candidate, but see the rule below |
| USDCAD | Yes | Not yet, entry charts bouncing UP | Yes, a steady fall since mid October | Trending, waiting for the trigger |
| EURGBP | Yes | Not yet, entry charts bouncing UP | Yes, lower highs all of October | Trending, waiting for the trigger |
Only one pair passes all three checks this morning: NZDCHF. USDCAD and EURGBP have the trend and the structure, but their faster charts are bouncing, so they are trending pairs on a pause.
Think of it like traffic lights. NZDCHF is on green. USDCAD and EURGBP are on red at the same junction, pointing the right way, engines running.
4. Our Rule: One Currency, One Position
Here is a trap that catches a lot of traders on a morning like this.
NZDCAD and NZDCHF both look great today. But both depend on one thing: a weak New Zealand dollar. Taking both is like building two houses on the same patch of sand and calling it diversification. If the sand shifts, both houses go together.
And the cost is not obvious until it bites. Two trades at 0.5 percent risk each, on the same weak currency, is really one position at 1 percent risk. Add a third, and you have tripled your risk on a single idea without noticing.
So we follow one rule every morning: each strong currency and each weak currency is used only once. We start with the pair that is trending best, then fill the remaining currencies with the next best pairs that do not share any of them.
Today that gives us three pairs, six currencies, and no currency counted twice:
| Pair | Strong side | Weak side | What the panel shows |
|---|---|---|---|
| NZDCHF | CHF | NZD | Fresh sell ticket, every timeframe DOWN |
| USDCAD | CAD | USD | 4 hour sell running, waiting for the next trigger |
| EURGBP | GBP | EUR | 4 hour sell running, waiting for the next trigger |
NZDCAD is left out on purpose. It is not a bad pair. It is the same trade idea as NZDCHF, and NZDCHF scored better.
5. Pick Of The Day: NZDCHF
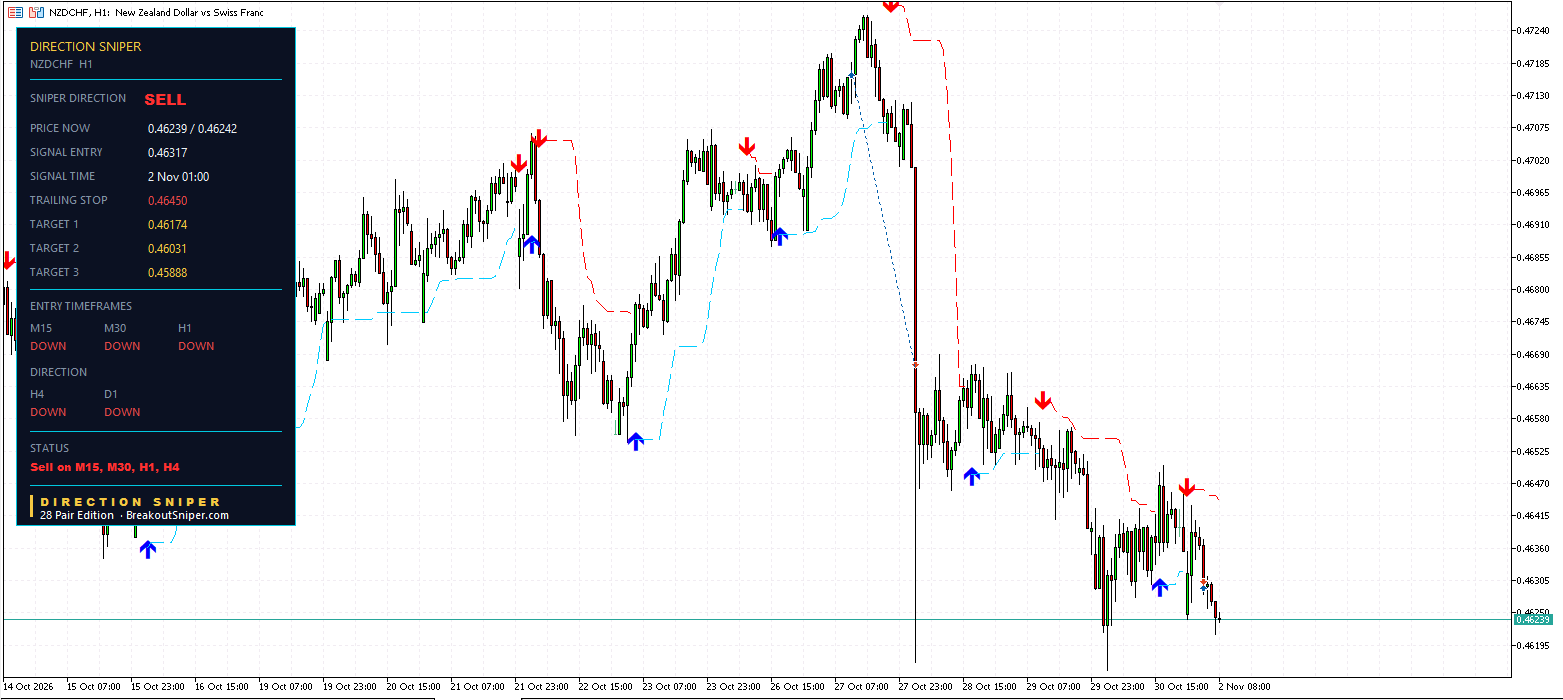
If you came here looking for the best forex pair to trade today, this is the one where the board and the chart agree most completely.
On the 1 hour chart, NZDCHF climbed to around 0.4725 on 27 October. Then the floor gave way: it dropped sharply on 28 October, and every bounce since has stopped lower than the one before, like a ball bouncing down a staircase.
Every timeframe on the panel agrees.
| Chart | Reads |
|---|---|
| M15 | DOWN |
| M30 | DOWN |
| H1 | DOWN |
| H4 | DOWN |
| Daily | DOWN |
The status line reads Sell on M15, M30, H1, H4.
The sell ticket printed this morning at 01:00 at 0.46317, with a risk of 14.3 pips. NZDCHF is at 0.46239, about 7.8 pips below the entry.
- Trailing stop: 0.46450
- Target 1: 0.46174
- Target 2: 0.46031
- Target 3: 0.45888
No target has been reached yet. It is the pair we are watching most closely today, not a trade recommendation. For every NZDCHF timeframe and the full plan, read today’s NZD CHF forecast.
6. USDCAD And EURGBP: Sell Into Strength
These two are the patient half of today’s board.
USDCAD: The Ticket That Survived Friday
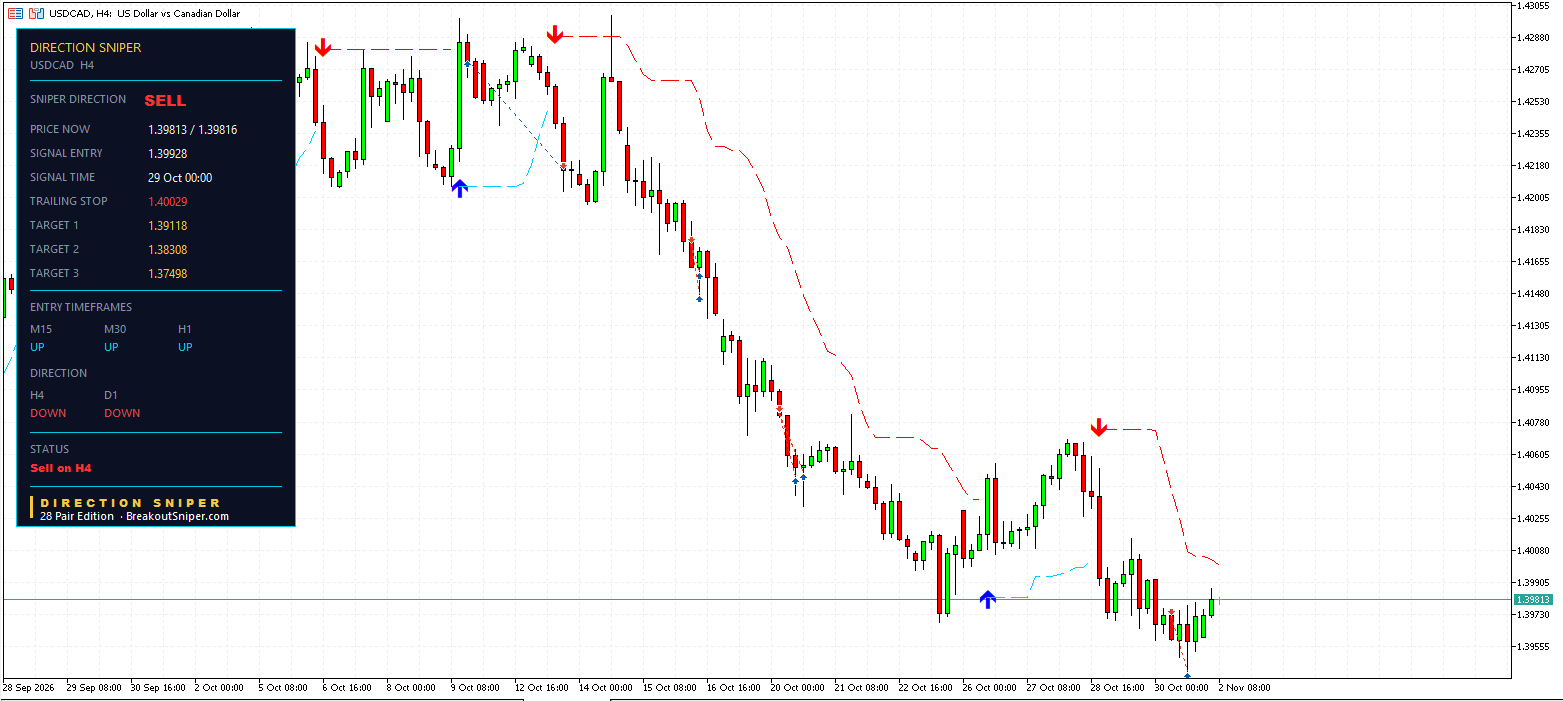
The 4 hour sell from 1.39928 is still running. Its trailing stop has tightened again, to 1.40029, just 10.1 pips behind the entry. USDCAD is at 1.39813.
But look at the entry charts: the 15 minute, 30 minute and 1 hour all read UP. USDCAD is bouncing.
That is not a reason to switch sides. The 4 hour and the daily still read DOWN. It is a reason to wait. Selling into strength means letting the bounce come to you, then selling when the faster charts turn back down, the way a surfer waits for the next wave instead of paddling after the last one.
EURGBP: Target 1 Already Reached
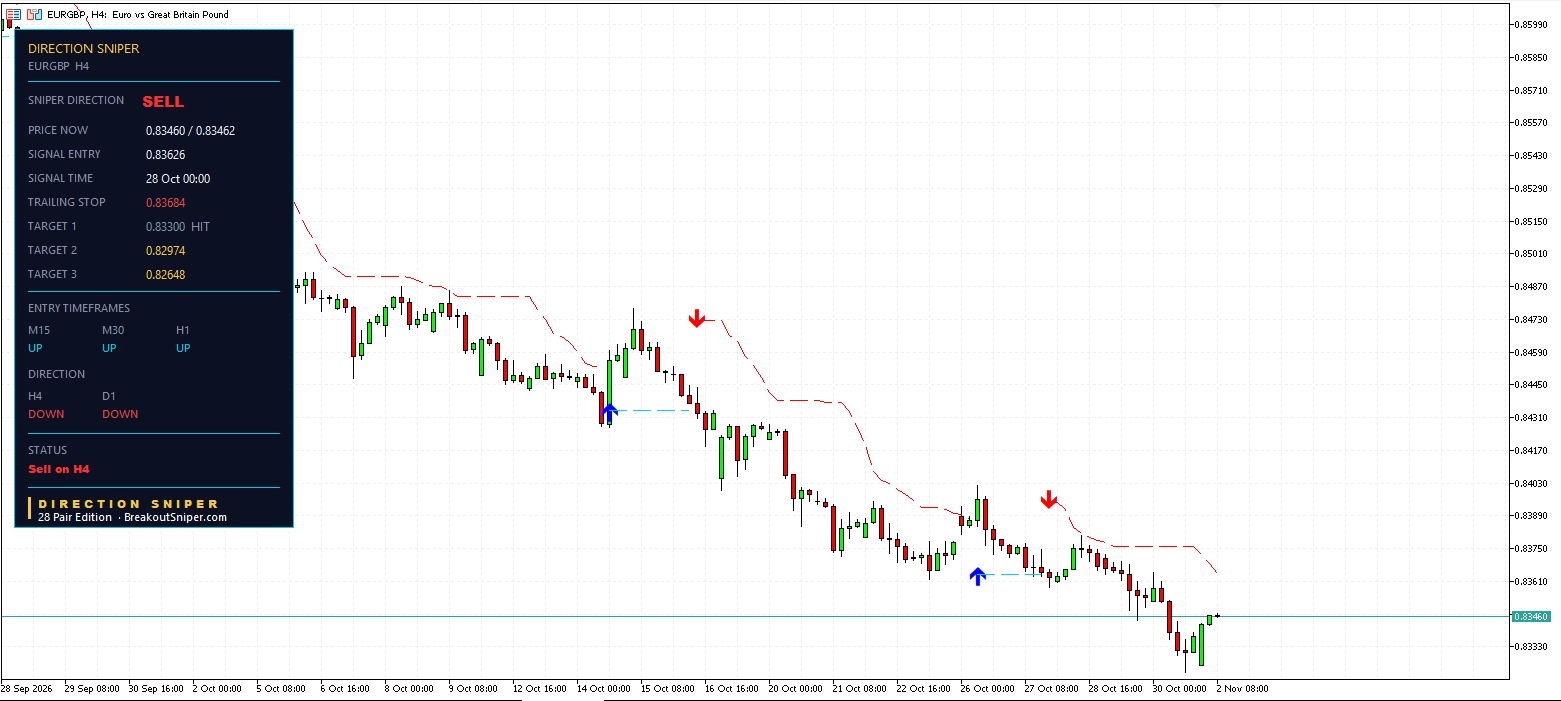
The EURGBP 4 hour sell printed on 28 October at 0.83626 and has already reached Target 1 at 0.83300. Its trailing stop sits at 0.83684, and EURGBP is at 0.83460.
- Target 2: 0.82974
- Target 3: 0.82648
Same story as USDCAD. The entry charts have bounced UP, the 4 hour and the daily still read DOWN, and the status reads Sell on H4.
The trigger to watch on both: the 15 minute, 30 minute and 1 hour turning back DOWN. When they do, the panel prints a fresh ticket with its own entry, stop and targets. Until then, these are pairs to watch, not pairs to chase.
7. US Dollar Today: MIXED
The US dollar is the world’s reserve currency, so every day we check whether it is leading the market or sitting out.
| Pair | Panel | What it says about the dollar |
|---|---|---|
| GBPUSD | BUY | Weaker than the pound |
| AUDUSD | BUY | Weaker than the Australian dollar |
| NZDUSD | BUY | Weaker than the New Zealand dollar |
| USDCAD | SELL | Weaker than the Canadian dollar |
| USDCHF | SELL | Weaker than the Swiss franc |
| USDJPY | SELL | Weaker than the yen |
| EURUSD | Stand aside | No clear edge |
For the second trading day in a row, the dollar is weaker on six of seven pairs and stronger on none. Even the New Zealand dollar, one of the weakest currencies on the board, is beating it.
Part of the backdrop is last week’s central bank split. On 28 October, the Bank of Canada raised interest rates while the US Federal Reserve held. Money tends to drift toward the higher rate, and that fits the Canadian dollar at the top and the US dollar at the bottom.
So why only MIXED? Because gold still disagrees. Gold reads SELL on its 4 hour and daily, and a falling gold price normally goes with a firm dollar, not a weak one. When the dollar and gold stop moving in opposite directions, the old rules of thumb stop working. Trade the pairs the board points to, and do not assume gold will confirm a dollar trade.
This week also brings a busy US calendar, including the midterm elections on Tuesday 3 November. Big events can move the dollar sharply in either direction, which is one more reason to size every trade for its stop.
8. Gold Check: Bouncing Today, Still SELL On The Big Charts
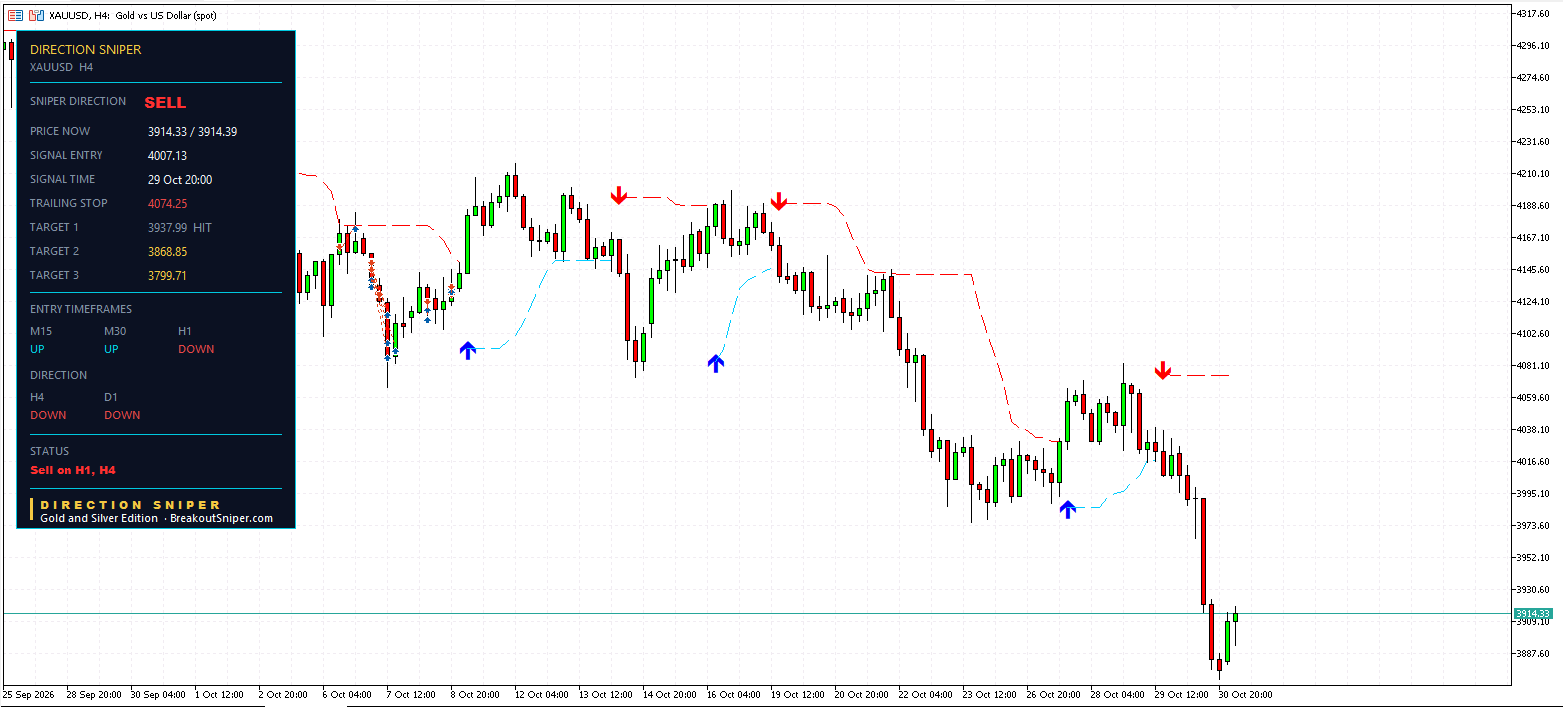
Gold had a dramatic Friday. The 1 hour sell reached all three targets as gold fell to around 3,880. This morning it has bounced back to 3914.33, up about 1 percent on the day.
The 4 hour sell from 4007.13 is still running. Target 1 at 3937.99 has been reached, the trailing stop sits at 4074.25, and Target 2 at 3868.85 is still open. The 4 hour and the daily both read DOWN.
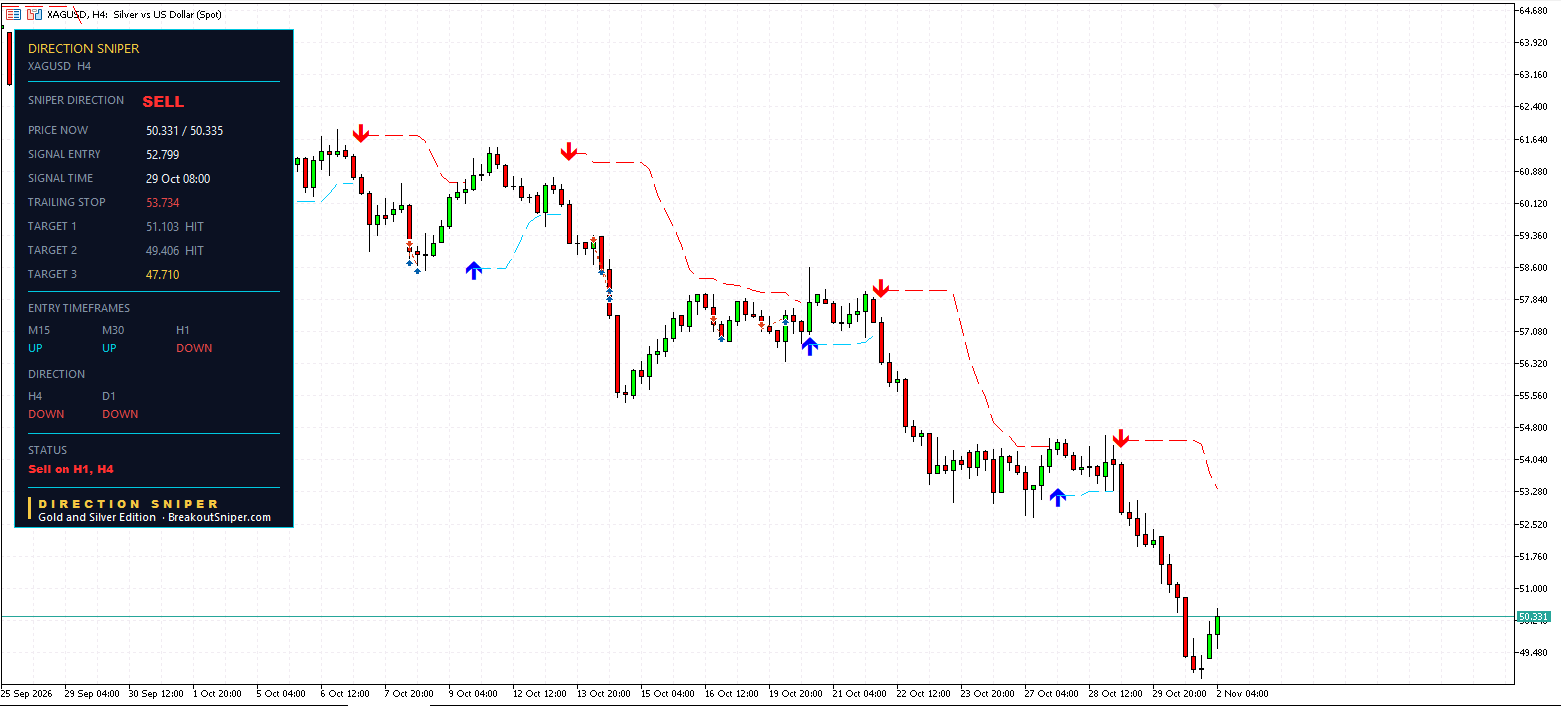
Silver is bouncing harder, up about 2.6 percent to 50.331. Its 4 hour sell from 52.799 has reached Targets 1 and 2, and something new happened: the stop has started trailing. It has moved down from 54.495 to 53.734.
So the bigger charts still say SELL on both metals, while the faster charts are bouncing. That is the same bounce or turn question we asked about Bitcoin this weekend, and the panel answers it the same way: a bounce turns the fast charts, a turn turns the big ones.
For every gold and silver timeframe and the live 1 hour tickets, read today’s gold and silver price forecast.
9. Before You Act: Check The Numbers, Then The Size
A live ticket is only useful if the numbers still make sense from where price is now.
1. Where is price against the entry? NZDCHF is 7.8 pips below its entry, close to the plan as printed.
2. How much room is left? From 0.46239, the NZDCHF trailing stop is 21.1 pips away. Target 1 is only 6.5 pips away, and Target 2 is 20.8 pips away. So from today’s price, the stop and Target 2 are about the same distance apart, with Target 1 almost there already.
3. Does the pair overlap with another trade? If you already hold a New Zealand dollar sell elsewhere, NZDCHF adds to the same exposure. Count it before you place it.
Every ticket gets the same risk. We risk at most 2 percent per trade, usually 0.5 percent, and that does not change because a pair looks perfect.
NZDCHF is quoted in Swiss francs, so one pip on a standard lot is 10 francs, roughly $12.14 with the franc where it is today. Check the exact figure on your platform. From today’s price to the trailing stop is 21.1 pips, so $50 of risk is about 0.19 lots. To work out your own size in seconds, use our free NZDCHF Lot Size Calculator.
On a small account, a cent account makes sizes like that possible. For small balances we recommend a RoboForex Cent account or an XM Micro account. These are partner links, so we may receive a commission at no cost to you.
Lot size is the seatbelt. It does not stop the crash. It decides how badly you get hurt. If you are worrying about every trade, your lot size is still too big.
One Board, Three Pairs, No Overlap
Put the morning together.
The ranking held through the weekend. The Canadian dollar still leads, the US dollar is still last, and all nine strong against weak pairs point the way the board says. NZDCHF has a fresh sell with every timeframe DOWN. USDCAD and EURGBP are bouncing inside their downtrends, waiting for the faster charts to turn back. And gold and silver are bouncing too, while their bigger charts still read SELL.
That is Direction Sniper:
- Direction. One verdict from the 4 hour and the daily. On all three of today’s pairs, it reads SELL.
- Rallies and bounces that have not broken structure. USDCAD and EURGBP are bouncing. Their verdicts have not changed.
- The stop loss. Every ticket arrives with its stop and three targets marked, and the USDCAD 4 hour stop has now trailed to just 10.1 pips behind its entry.
New to all this? Start with our step by step guide on how to trade currency strength.
The 28 Pair Edition puts this panel on NZDCHF, USDCAD, EURGBP and every other major, minor and cross, MT4 or MT5, on one licence.
Want the strongest and weakest currencies in your inbox every trading morning? Join The Daily Sniper Read, free.
Currency Strength Today: Frequently Asked Questions
Updated 2 November 2026. Levels are as shown on the Direction Sniper panel at the time of writing.
1What is the currency strength today, 2 November 2026?+
The strongest currencies are the Canadian dollar, then the British pound, then the Swiss franc. The weakest are the US dollar, then the euro, then the New Zealand dollar.
The ranking held over the weekend, and all nine strong against weak pairs point the way the ranking says they should.
2Which is the strongest currency today?+
The Canadian dollar, for another session. It has led our board every trading day since our daily reads began on 28 October 2026.
Last week the Bank of Canada raised interest rates while the US Federal Reserve held, which fits CAD at the top and the US dollar at the bottom.
3What is the best forex pair to trade today?+
Our Pick of the Day is NZDCHF, a strong currency against a weak one, with every timeframe reading DOWN and a fresh SELL ticket from 0.46317 this morning.
Target 1 is 0.46174, and the trailing stop is 0.46450. This is the pair we are watching, not a trade recommendation.
4Which forex pairs are trending best today?+
We check each strong against weak pair three ways: is one side clearly winning, do the timeframes agree, and is the structure clean. On 2 November 2026, only NZDCHF passed all three, with every timeframe reading DOWN.
USDCAD and EURGBP have the trend and the structure, but their faster charts are bouncing, so they are trending pairs waiting for a trigger.
5Why not trade NZDCAD and NZDCHF together?+
Both depend on a weak New Zealand dollar. Two trades at 0.5 percent risk on the same weak currency are really one position at 1 percent risk, and if the New Zealand dollar bounces, both lose together.
Our rule is one currency, one position. Today we chose NZDCHF, USDCAD and EURGBP, so each strong and each weak currency is used only once.
6What does sell into strength mean?+
It means waiting for a bounce inside a downtrend, then selling when the faster charts turn back down, instead of selling after price has already fallen.
On USDCAD and EURGBP, the 4 hour and the daily read DOWN while the entry charts have bounced UP. The trigger is the 15 minute, 30 minute and 1 hour turning back DOWN.
7Is the US dollar weak today?+
On forex, yes. The dollar is weaker on six of the seven dollar pairs and stronger on none, for the second trading day in a row.
Our US Dollar Today verdict is MIXED, because gold still reads SELL on its bigger charts, and a falling gold price normally goes with a firm dollar.
8Is gold still a sell?+
Gold and silver are both bouncing this morning, but their 4 hour and daily charts still read DOWN. The gold 4 hour sell from 4007.13 has reached Target 1 at 3937.99.
Silver’s 4 hour sell has reached Targets 1 and 2, and its stop has started trailing, to 53.734.
9What lot size should I use on NZDCHF?+
We risk at most 2 percent per trade, usually 0.5 percent, which is $50 on a $10,000 account. With one NZDCHF pip worth about $12.14 per standard lot, a 21.1 pip stop is about 0.19 lots.
Use the NZDCHF Lot Size Calculator to work out your own size. These figures are arithmetic for illustration, not a recommendation about how much anyone should trade.
DIRECTION SNIPER 28 PAIR EDITION
See NZDCHF and 27 more pairs the moment a ticket prints.
Direction, entry, stop and three targets on all 28 pairs. MT4 or MT5, one licence.
Disclaimer: This post reports what the Direction Sniper panel showed on 2 November 2026. The tickets were running at the time of writing, and prices will have moved by the time you read this. It is educational analysis, not financial advice and not a trade signal service, and nothing here is a recommendation to buy or sell. Price reaching a published target level is not the same as a realised result. A target shown as reached means price touched that level on the chart, and does not describe anyone’s trade. High and low levels are approximate readings from the chart. Pip values and lot sizes are arithmetic for illustration, depend on the exchange rate, and are not a recommendation about how much anyone should trade. Forex trading carries risk, and you should only trade money you can afford to lose.

