Multi Timeframe Analysis For Gold: Which Chart Decides Direction?
Multi timeframe analysis for gold starts with one question: which chart decides direction?
The answer is short. On gold, the bigger charts decide direction and the faster charts decide timing. When the 4 hour and daily charts agree, you have a direction to trade. When they disagree, the right trade is no trade.
That one rule clears up most of the confusion traders feel when they flip between timeframes on XAUUSD. This guide shows how we read it on the Direction Sniper panel, chart by chart, so you can bring the same thinking to your own gold charts.
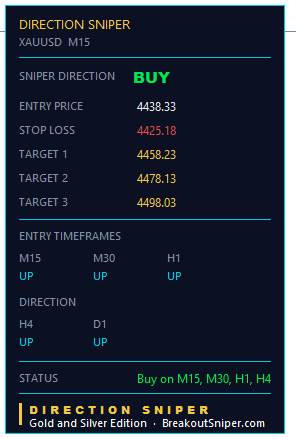
1. Why Gold Punishes Single Chart Trading
Gold can move more in one session than many currency pairs move in a week. On a 15 minute chart, that range shows up as a string of sharp moves in both directions, and each one looks like the start of something new.
A trader watching only that chart sees a reversal every few hours. A trader watching the 4 hour and daily charts sees one trend with a few pullbacks inside it. Same market, same day, two very different stories.
Multi timeframe analysis tells you which story to believe before you place a trade. It is also the first thing the Direction Sniper panel shows you: one verdict for gold, read from the charts that actually decide direction.
2. Two Kinds Of Charts, Two Different Jobs
| Chart | Job | Question it answers |
|---|---|---|
| Daily | Direction | Which way is gold leaning? |
| 4 hour | Direction and entry | Does the swing agree with the daily? Is there a ticket here? |
| 1 hour | Entry | Is there a clean entry in the verdict’s direction? |
| 30 minute and 15 minute | Entry | Is there an earlier entry with a tighter stop? |
The 4 hour chart is the hinge. It helps decide direction, and it is also an entry chart. When the 4 hour and daily line up, the panel can print a ticket on the 4 hour chart itself.
The common mistake is asking a fast chart to do a slow chart’s job. A 15 minute chart is good at timing. It is poor at telling you where gold is heading.
3. When The 4 Hour And Daily Agree, You Have A Direction
When the 4 hour and daily charts point the same way, the panel shows a verdict: BUY or SELL. That verdict is your direction. Every trade you consider from that point either agrees with it or gets ignored.
This is what we mean when we say direction comes first. A mediocre entry in the right direction usually has room to work. A perfect entry in the wrong direction rarely does.
With Direction Sniper you do not have to flip between charts and judge for yourself whether they agree. The panel reads both and gives you one word.
4. When They Disagree, The Answer Is NO TRADE
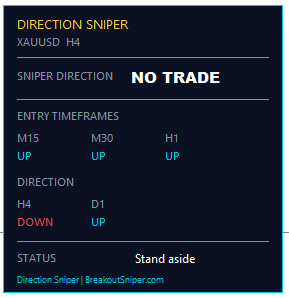
Here is how the two direction charts combine into one verdict.
| 4 hour | Daily | Verdict |
|---|---|---|
| UP | UP | BUY |
| DOWN | DOWN | SELL |
| UP | DOWN | NO TRADE |
| DOWN | UP | NO TRADE |
Sometimes the daily chart is still rising while the 4 hour chart has turned down. Both are telling the truth about their own timeframe. Neither is telling you what gold will do next.
This is where many gold traders get into trouble. They pick whichever chart agrees with the trade they already wanted to take.
The panel settles it by showing NO TRADE. No verdict, no ticket. Standing aside on these days is not a missed opportunity. It is a decision, and it keeps your account ready for the days when the charts line up again.
Many traders find this the hardest rule to follow and the most valuable one to have on screen. When the panel says NO TRADE, the argument is over before it starts.
5. Fast Charts Execute, They Do Not Decide
Once there is a verdict, the faster charts have one job: finding entries in that direction. The panel’s status line shows which charts are ready, for example Sell on M15, H1, H4. Think of it as your entry map.
A ticket, with entry, stop loss and three targets, only prints when an entry chart lines up with the verdict. If a fast chart points against the verdict, there is no ticket. That is by design.
Three Fast Charts Say DOWN. The Panel Still Says NO TRADE.
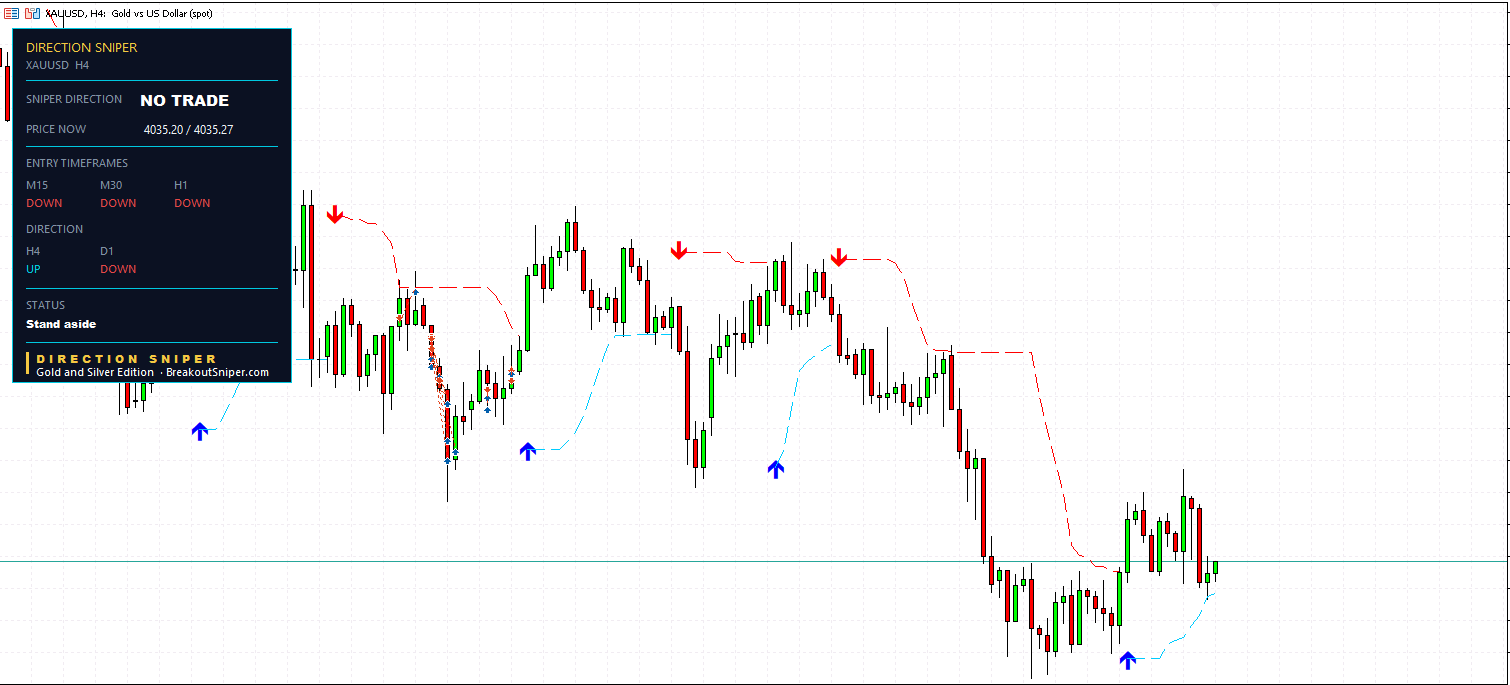
Here is a real gold board, with price near 4,035.
Every entry chart on the panel reads DOWN: the 15 minute, the 30 minute and the 1 hour. A trader watching only those three would think the sell case is obvious.
The panel says NO TRADE anyway. The reason sits in the Direction row: the 4 hour reads UP and the daily reads DOWN.
| Chart | Reads | Job |
|---|---|---|
| M15 | DOWN | Entry |
| M30 | DOWN | Entry |
| H1 | DOWN | Entry |
| H4 | UP | Direction |
| Daily | DOWN | Direction |
The verdict is NO TRADE, and the status reads Stand aside.
The 4 hour chart shows why. Over the last several weeks gold stepped lower, with a sell arrow on rally after rally. Then, near the lows, a buy arrow printed and the trailing line turned up underneath price. The 4 hour is asking whether this is the start of a turn. The daily is still pointing down, and treats the same move as a bounce inside a falling market.
Either chart could turn out to be right. Until one of them gives way, there is no direction, and without a direction the three fast charts have nothing to execute.
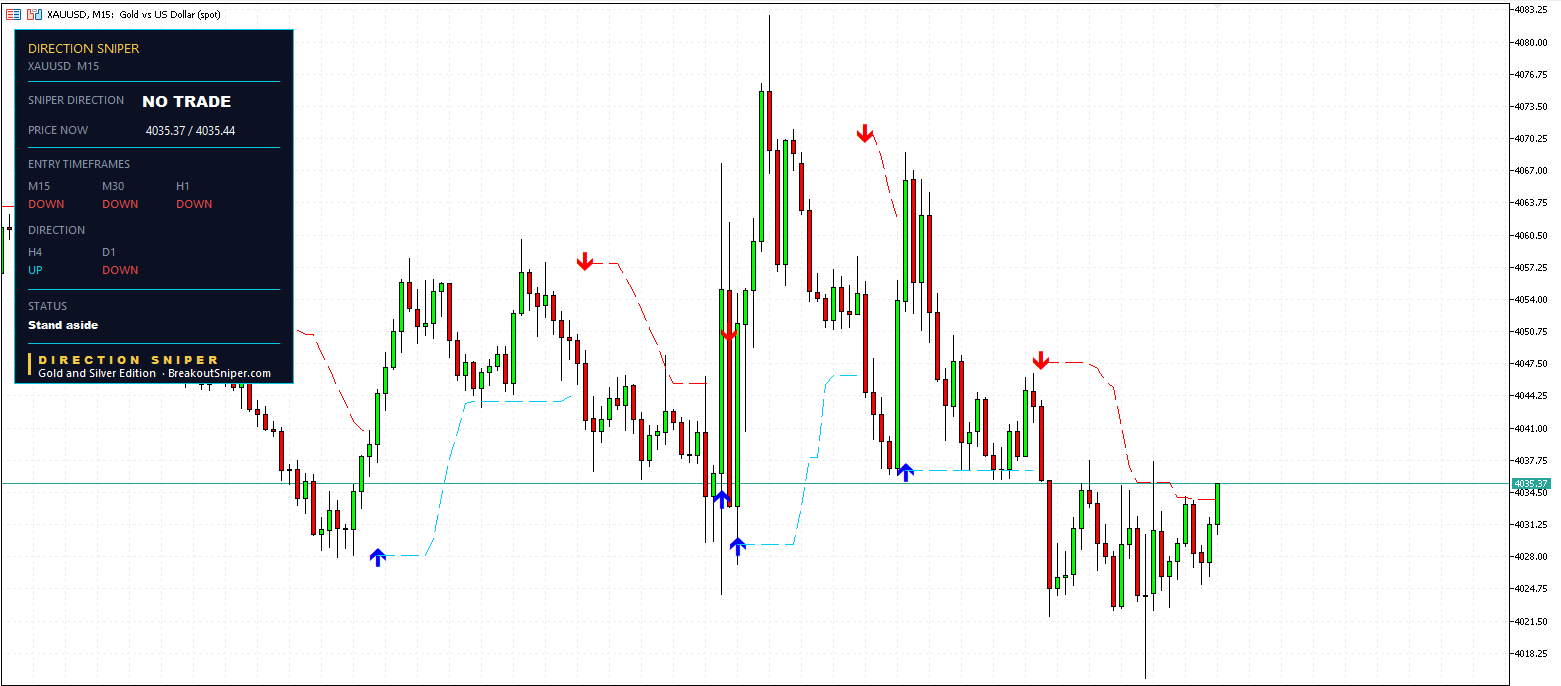
The 15 minute chart shows what standing aside keeps you out of. In one session gold spiked to around 4,083, fell back toward 4,025, then swung between roughly 4,018 and 4,047, with arrows printing in both directions. The latest sell arrow near 4,047 was followed by a drop to around 4,022, and price has since climbed back to 4,035.
That is the point. A fast chart can be right about the next few candles and still tell you nothing about where gold goes next. Without the 4 hour and daily behind it, every entry is a guess with a stop attached.
What would change the picture:
- If the 4 hour turns DOWN to join the daily, the verdict becomes SELL, and the fast charts already reading DOWN become the entry map.
- If the daily turns UP to join the 4 hour, the verdict becomes BUY, and the fast charts have to turn up before any ticket prints.
Either way, you wait for the bigger charts, not the fast ones. The panel ends the argument and tells you exactly what to watch next. That is what Direction Sniper is for.
When The Fast Charts Turn Against The Trend
Inside a real gold uptrend there are deep pullbacks where the 15 minute, 30 minute and 1 hour charts all turn down. The status line shrinks to something like Buy on H4, and the fast charts drop off the map.
To a trader watching the 15 minute chart alone, this looks like a reversal. Often it is a pullback. The direction only changes when the 4 hour and daily charts change.
This is one of the places Direction Sniper earns its place on your chart. It holds the verdict through the pullback and does not print tickets against it, so a bounce that looks like a reversal does not pull you onto the wrong side of the market.
6. Can You Trade The 15 Minute Gold Chart Alone?
You can place trades on it, but you cannot get direction from it. The 15 minute chart turns many times a day, and gold’s intraday swings make every turn look convincing.
The 15 minute chart works best as an entry chart inside a direction the 4 hour and daily have already confirmed. Used that way, its tight stops are an advantage. Used alone, its turns become a series of guesses.
7. Which Entry Chart Should You Use?
Every chart on the status line is a valid entry, but they are not the same trade.
| Entry chart | Stop | How often tickets print |
|---|---|---|
| 15 minute | Tight | Often |
| 1 hour | Medium | Steady |
| 4 hour | Wide | Less often |
In our own trading we find the 1 hour tickets the best balance between room and frequency, and we take 4 hour tickets at times. That is a preference, not a rule. Choose the entry chart that suits how often you can watch the screen, then size the trade for that chart’s stop.
8. Direction Points You The Right Way. Lot Size Keeps You In The Game.
Even with the 4 hour and daily in agreement, any single gold trade can reach its stop. Technical analysis is a game of probability, and there is no holy grail.
We risk at most 2 percent per trade, usually 0.5 percent. At 0.5 percent, a run of stops is uncomfortable, not dangerous.
The ticket shows you the stop before you enter, so you know your risk in advance. On gold, a $1 move on one standard lot of 100 ounces is $100. With a $5 stop and $50 of risk, that is 0.10 lots. Contract sizes can differ between brokers, so check the figure on your platform.
Work out your exact size in seconds with our free gold lot size calculator.
On a small account, a cent account makes sizes like that possible. For small balances we recommend a RoboForex Cent account or an XM Micro account. These are partner links, so we may receive a commission at no cost to you.
If you are worrying about every trade, your lot size is still too big.
9. The Five Second Checklist Before Any Gold Trade
- Do the 4 hour and daily charts agree? If not, no trade.
- Which way is the verdict? Only consider trades in that direction.
- Is your entry chart on the status line? If not, wait.
- Is there a ticket? No ticket means no trade.
- Is your lot size set from the stop, at a risk you can sit through calmly?
Direction Sniper answers the first four on one panel. The fifth is yours, and it matters most.
Direction First, Then Timing, Then Size
Put the whole method together.
The 4 hour and daily decide which way. The fast charts decide when. Your lot size decides how much. Get them in that order and most of the noise on a gold chart stops mattering.
That is Direction Sniper:
- Direction. One verdict from the 4 hour and the daily, and NO TRADE when they disagree.
- Bounces that are not reversals. When the fast charts turn against the trend, the verdict holds until the bigger charts change.
- The stop loss. Every ticket arrives with its stop and three targets marked, and the panel calculates and displays the trailing stop level as the trade develops, so you know where to move your own stop.
You can watch the rule at work on live charts in our Gold and Silver Price Forecast reads, including the trades that did not go our way.
See Direction Sniper for Gold and Silver
Want our daily read in your inbox? Join The Daily Sniper Read, free, every trading day.
More guides on reading direction, managing trades and sizing positions: Trading Guides.
Multi Timeframe Analysis For Gold: Frequently Asked Questions
1What is multi timeframe analysis for gold?+
Multi timeframe analysis for gold means reading more than one chart before you trade. The 4 hour and daily charts decide direction, and the faster charts, from 15 minute to 1 hour, time entries in that direction.
The Direction Sniper panel reads the 4 hour and daily for you and shows one verdict for gold.
2Which timeframe decides direction on gold?+
The 4 hour and daily charts decide direction together. When both read UP, the verdict is BUY. When both read DOWN, the verdict is SELL.
The faster charts do not decide direction. They only time entries in the direction the bigger charts have set.
3What should I do when the 4 hour and daily gold charts disagree?+
Stand aside. When one reads UP and the other reads DOWN, there is no clear direction, and the panel shows NO TRADE.
Standing aside is a decision too. It keeps your account ready for the days when the two charts line up again.
4Can I trade gold on the 15 minute chart alone?+
You can place trades on it, but you cannot get direction from it. The 15 minute chart turns many times a day, and gold’s swings make every turn look convincing.
It works best as an entry chart inside a direction the 4 hour and daily have already confirmed.
5Is it a reversal when the fast gold charts turn against the trend?+
Often it is a pullback, not a reversal. The direction only changes when the 4 hour and daily charts change.
Until then, Direction Sniper holds the verdict and does not print tickets against it, so a bounce does not pull you onto the wrong side of the market.
6Which entry chart should I use for gold?+
Any chart on the status line is a valid entry, but the stops differ. A 15 minute ticket has a tight stop and prints often, while a 4 hour ticket has more room and prints less often.
In our own trading we find the 1 hour tickets the best balance between room and frequency. That is a preference, not a rule.
7How much should I risk on a gold trade?+
We risk at most 2 percent per trade, usually 0.5 percent. On gold, a $1 move on one standard lot of 100 ounces is $100, so a $5 stop with $50 of risk works out at 0.10 lots.
Contract sizes can differ between brokers, so check your platform. These figures are arithmetic for illustration, not a recommendation about how much anyone should trade.
8Does Direction Sniper move my stop loss for me?+
No. Direction Sniper calculates the trailing stop level and shows it on your chart as the trade develops.
You move the stop on your own order to match it.
DIRECTION SNIPER GOLD AND SILVER EDITION
One verdict for gold, read from the 4 hour and the daily.
BUY, SELL or NO TRADE, with entry, stop and three targets on every ticket. MT4 or MT5.
Disclaimer: This guide explains how we read the Direction Sniper panel on gold. It is educational content, not financial advice and not a trade signal service. Screenshots show what the panel displayed at the time they were taken. Price reaching a published target level is not the same as a realised result. Pip values and lot sizes are arithmetic for illustration, depend on your broker’s contract size, and are not a recommendation about how much anyone should trade. Trading gold and other leveraged products carries risk, and you should only trade money you can afford to lose.

