EUR USD Forecast Today, 23 October 2026: Is The EURUSD Bounce Over?
Every Timeframe Just Turned Back To Sell
This EUR USD forecast today answers the question EURUSD traders have been asking all week.
In mid October EURUSD dropped to around 1.113. Then it bounced, for a whole week, to around 1.1265. On a fast chart that bounce looked a lot like a reversal.
This morning the Direction Sniper board reads Sell on M15, M30, H1, H4. Every entry chart and both direction charts agree on the same direction again. The 4 hour has printed a fresh sell, and the 1 hour sell from yesterday has already reached its first target.
This is a setup day, not a results day. Most of these tickets are only hours old. But how the panel handled the bounce, and why it is lined up again now, is one of the most useful things a EURUSD trader can see.
1. The Trap: A Week Long Bounce That Looks Like A Reversal
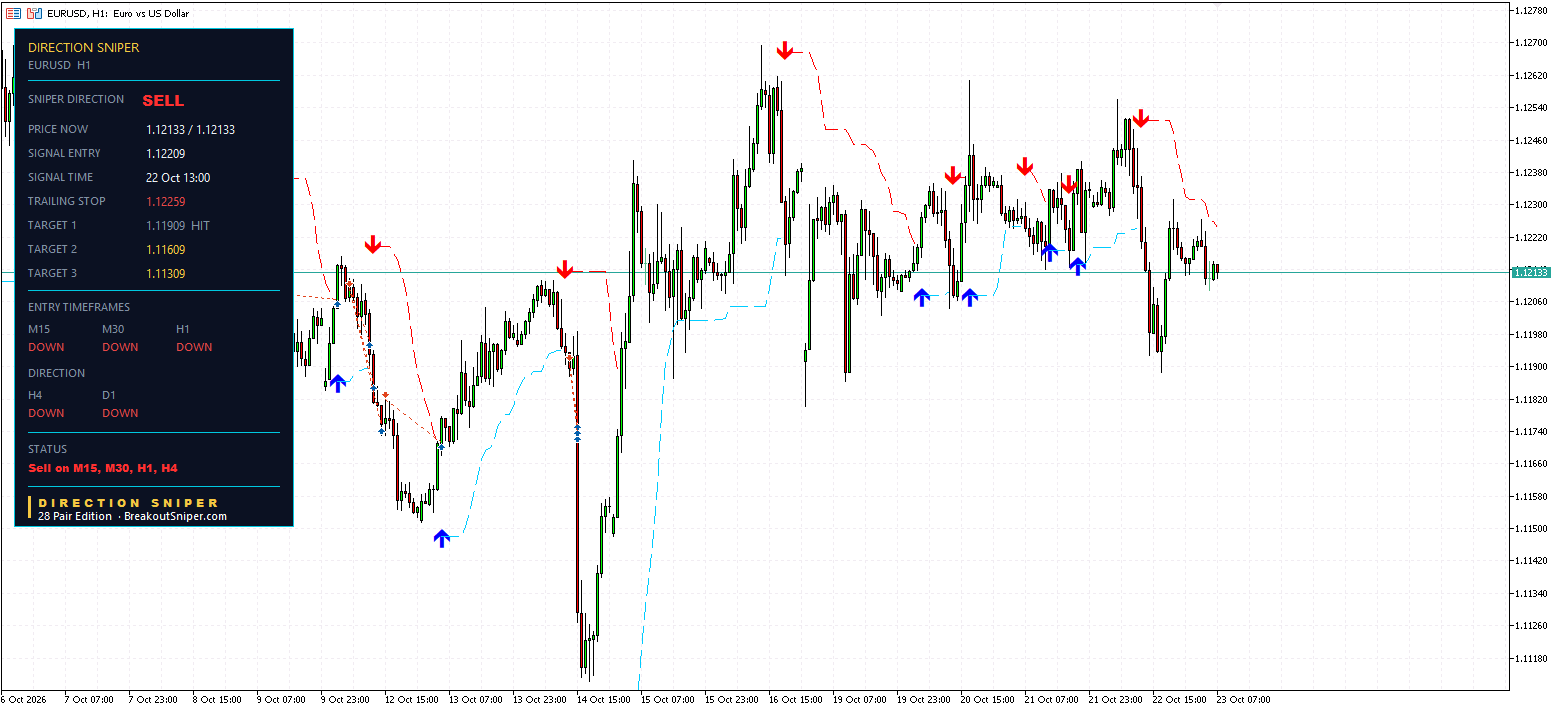
On 14 October every EURUSD chart pointed down, and EURUSD went on to trade down to around 1.113. You can read those posts in our EUR USD forecast archive.
Then the bounce came. EURUSD climbed roughly 140 pips over the following week, to around 1.1265. The 15 minute, the 30 minute and the 1 hour all turned up. On 15 October even the 4 hour turned UP.
To a trader watching a fast chart, this is the moment the trend “changed”. So they buy. Some of them buy near the top of the bounce, at exactly the point the bigger trend is getting ready to resume.
The trap is simple: a bounce turns the fast charts first. A reversal turns the big ones. A 4 hour chart turning up on its own is not the same as the daily turning up with it.
2. What The Panel Does During A Bounce
The Direction Sniper verdict comes from two charts: the 4 hour and the daily.
- When both point down, the verdict is SELL
- When both point up, the verdict is BUY
- When they disagree, the verdict is NO TRADE, and the panel stands aside
That last rule is the one that matters during a bounce. While the 4 hour points up and the daily points down, there is no BUY verdict, so there are no buy tickets. The panel does not try to trade the bounce against the daily, and it does not try to sell into it either. It waits.
Standing aside is a position. It costs nothing, it protects you from buying a bounce near its top, and it keeps you ready for the moment the big charts agree again.
On 22 October that moment came.
3. Every Timeframe Turns Back To Sell
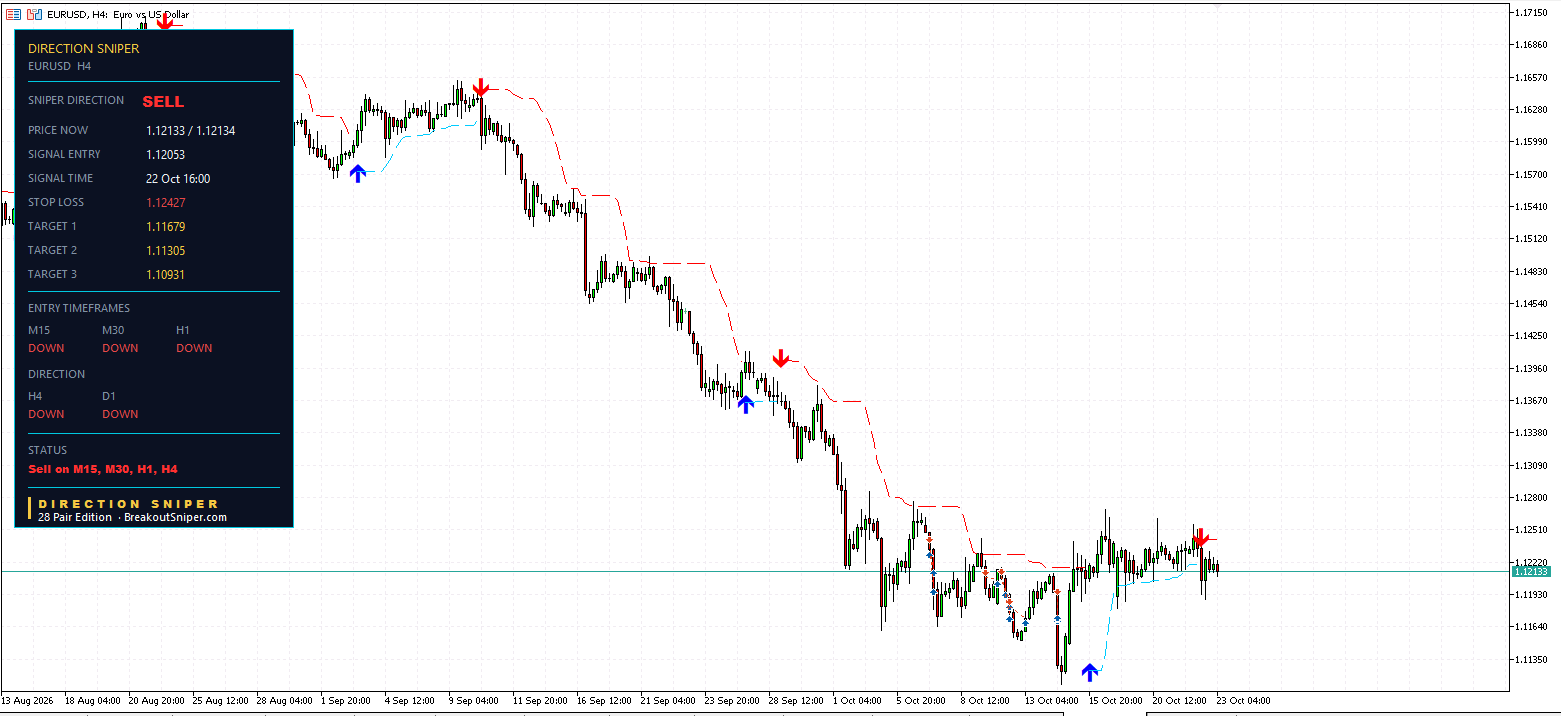
At 16:00 on 22 October the 4 hour turned back DOWN and joined the daily. The verdict became SELL, and the 4 hour printed its own ticket.
| Chart | Entry | Stop | Risk | Targets | State |
|---|---|---|---|---|---|
| H4 | 1.12053 (22 Oct 16:00) | 1.12427 | 37.4 pips | 1.11679, 1.11305, 1.10931 | Fresh, price 8.0 pips behind entry |
| H1 | 1.12209 (22 Oct 13:00) | trail 1.12259 | 30.0 pips | 1.11909 reached, 1.11609, 1.11309 | Target 1 reached, running |
| M30 | 1.12118 (23 Oct 05:00) | 1.12238 | 12.0 pips | 1.11998, 1.11878, 1.11759 | Fresh, 1.0 pip behind entry |
| M15 | 1.12118 (23 Oct 05:00) | trail 1.12196 | 13.2 pips | 1.11986, 1.11854, 1.11722 | Fresh, 1.4 pips behind entry |
Price is about 1.1213.
The 1 hour came first. It printed at 1.12209 on 22 October at 13:00, before the 4 hour had even turned. EURUSD dipped to around 1.1189 that afternoon, and Target 1 at 1.11909 was reached.
Then EURUSD bounced back, and it now sits about 7.6 pips below that entry, above where Target 1 sat. The 1 hour trailing level has tightened 25 pips, from 1.12509 to 1.12259, but it still sits 5.0 pips behind the entry. We show it as it is.
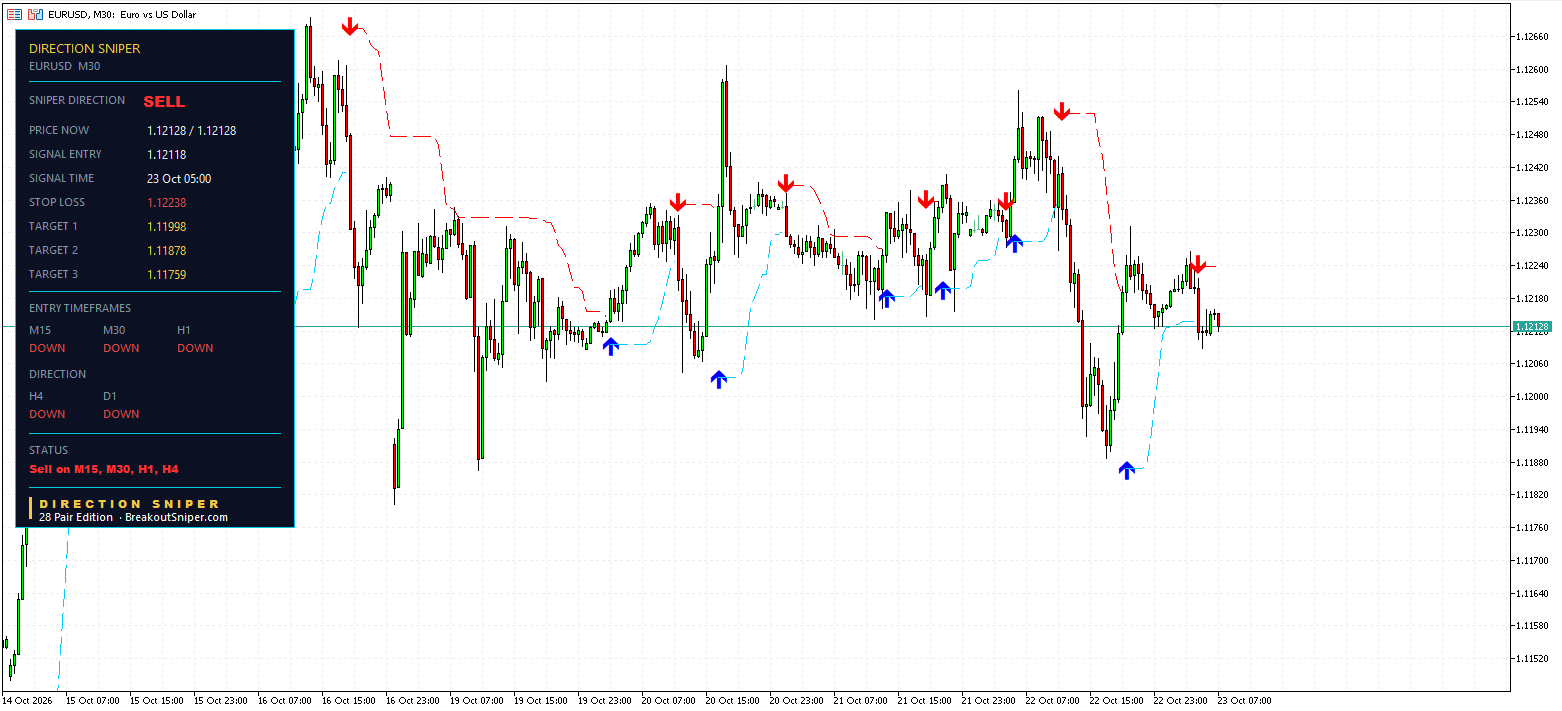
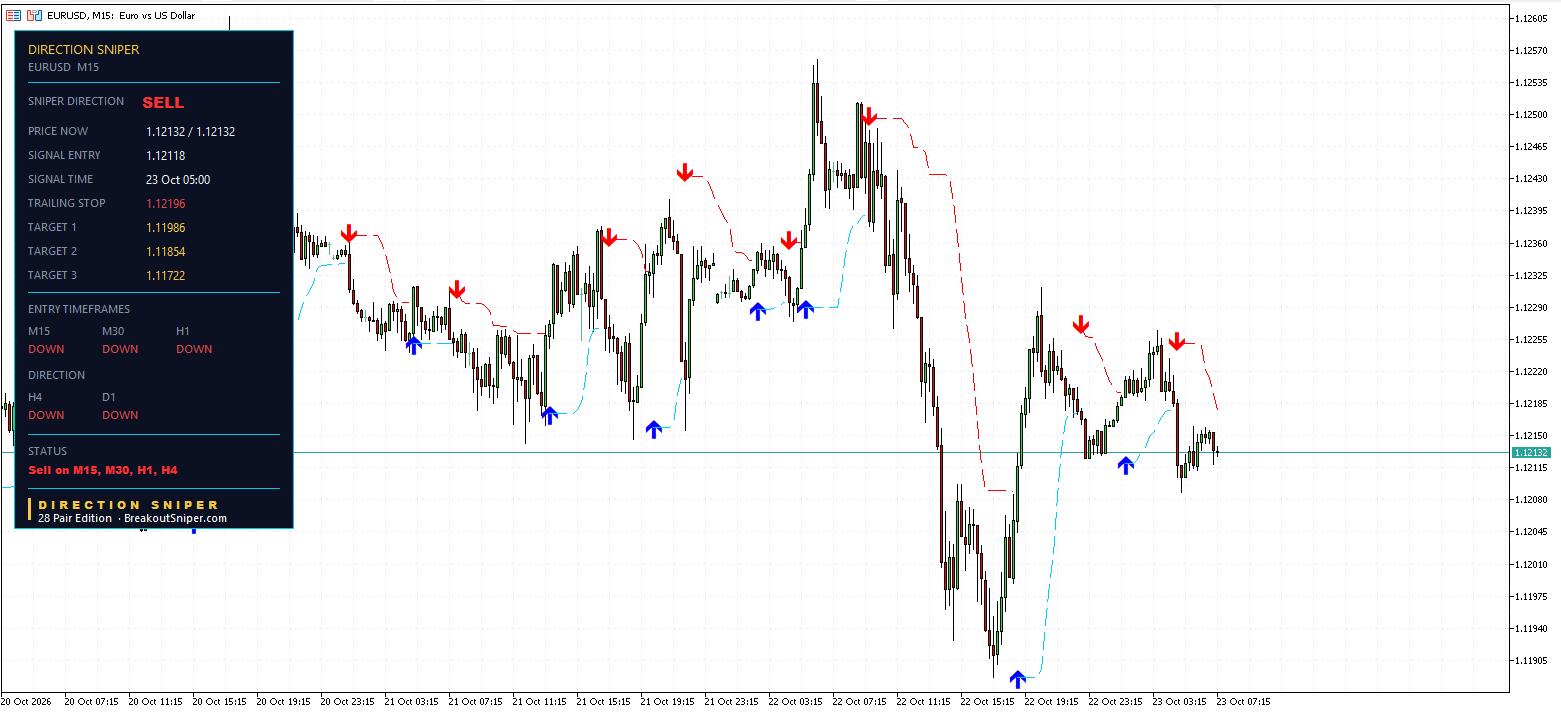
The 15 minute and 30 minute lined up together this morning at 05:00, both at 1.12118. At the time of writing they sit about a pip behind their entries, which is normal for tickets a few hours old.
4. Is The Bounce Over? What To Watch
Here is the honest answer: nobody knows yet. What the board shows is that every timeframe now agrees on DOWN, for the first time since the bounce began. That is the condition the panel waits for. It is not a promise of what comes next.
The levels that matter:
- The fast stops sit close together. The 15 minute trail at 1.12196, the 30 minute stop at 1.12238 and the 1 hour trail at 1.12259. A push back above about 1.1226 would close all three.
- The 4 hour stop sits higher, at 1.12427. That is the level that would close the main ticket.
- The first targets below: 1.11998 on the 30 minute, 1.11986 on the 15 minute, then 1.11679 on the 4 hour.
What would change the picture: if the 4 hour turned UP again while the daily stayed DOWN, the verdict would move back to NO TRADE, and the panel would stand aside once more. That is exactly what it did during the bounce, and it costs nothing.
Bounce or pullback, the rule never changes: the fast charts turn first, the big charts decide. We showed the same idea from the buy side in how to buy a pullback without catching a falling knife.
5. Fresh Tickets, Different Stops, The Same Risk
On a setup day, sizing is the part you control completely.
EURUSD is quoted in US dollars, so one pip on a standard lot is about $10. At 0.5 percent of a $10,000 account, which is $50 of risk:
| Chart | Stop distance | Lot size for $50 of risk |
|---|---|---|
| M30 | 12.0 pips | about 0.42 lots |
| M15 | 13.2 pips | about 0.38 lots |
| H1 | 30.0 pips | about 0.17 lots |
| H4 | 37.4 pips | about 0.13 lots |
The 30 minute ticket needs more than three times the lot size of the 4 hour ticket to risk the same $50. And because the fast stops all sit within a few pips of each other, a trader who takes the 15 minute, 30 minute and 1 hour tickets together is really taking one trade three times. If all three stops are reached by the same push, the risk adds up to $150, not $50. Size them as one.
On a $100 account, 0.5 percent is 50 cents. A 0.01 lot on the 4 hour ticket risks about $3.74, which is 3.7 percent of the account. A cent account makes the right size possible. For small balances we recommend a RoboForex Cent account or an XM Micro account. These are partner links, so we may receive a commission at no cost to you.
We risk at most 2 percent per trade, usually 0.5 percent. If you are worrying about every trade, your lot size is still too big.
Don’t Buy The Bounce. Wait For The Big Charts.
Put the fortnight together.
EURUSD fell. Then it bounced for a week, long enough to fool anyone watching a fast chart. The panel never treated that bounce as a reversal. It stood aside until the 4 hour and the daily agreed again, and now every timeframe reads SELL, with each ticket’s stop already marked.
That is what Direction Sniper does on every pair, every day:
- Direction. One verdict from the 4 hour and the daily, so a bounce on the fast charts never tricks you into buying against the bigger trend.
- Rallies that have not broken structure. When the two big charts disagree, the panel stands aside. No guessing whether a bounce is the real thing.
- The stop loss. When the charts line up again, every ticket arrives with its stop marked, so you size it before you enter.
The 28 Pair Edition puts this panel on EURUSD and 27 other pairs, MT4 or MT5, on one licence.
Only trade EURUSD? The EURUSD Edition is the easiest way to put the panel on your chart.
Want a read like this in your inbox? Join The Daily Sniper Read, free, every trading day.
EUR USD Forecast Today: Frequently Asked Questions
What is the EUR USD forecast today, 23 October 2026?
The Direction Sniper panel reads SELL on EURUSD, because the 4 hour and the daily charts both point down.
Every entry chart also reads DOWN, so the status shows Sell on M15, M30, H1, H4. Price was around 1.1213 at the time of writing, and most of the tickets were only hours old.
Is the EURUSD bounce over?
Nobody knows yet. EURUSD bounced roughly 140 pips over a week, from around 1.113 to around 1.1265. On 22 October at 16:00 the 4 hour turned back DOWN and joined the daily, so every timeframe now agrees on DOWN for the first time since the bounce began.
That alignment is the condition the panel waits for. It is not a promise of what comes next.
What does Direction Sniper do during a bounce?
The verdict comes from the 4 hour and the daily. When both point down it is SELL, when both point up it is BUY, and when they disagree it is NO TRADE and the panel stands aside.
While the 4 hour points up and the daily points down, there are no buy tickets against the daily. Standing aside costs nothing and protects you from buying a bounce near its top.
Did the EURUSD 1 hour ticket reach a target?
Yes. The 1 hour sell from 1.12209 on 22 October at 13:00 had a stop 30.0 pips above. EURUSD dipped to around 1.1189 that afternoon, and Target 1 at 1.11909 was reached. Its other targets are 1.11609 and 1.11309.
EURUSD then bounced back above that level. The trailing level has tightened to 1.12259, still 5.0 pips behind the entry. Price reaching a published target level is not the same as a realised result.
What are the EURUSD levels to watch now?
The fast stops sit close together: the 15 minute trail at 1.12196, the 30 minute stop at 1.12238 and the 1 hour trail at 1.12259. The 4 hour sell from 1.12053 has its stop at 1.12427 and targets at 1.11679, 1.11305 and 1.10931.
If the 4 hour turned UP again while the daily stayed DOWN, the verdict would move back to NO TRADE and the panel would stand aside.
Why is taking several EURUSD tickets at once risky?
The 15 minute, 30 minute and 1 hour stops all sit within a few pips of each other, around 1.1220 to 1.1226. One push higher could reach all three at once.
Taking all three is really one trade taken three times. If each risks $50, the combined risk is $150, not $50, so size them together as one trade.
What lot size goes with a 12 pip stop on EURUSD compared with a 37 pip stop?
One pip on a standard EURUSD lot is about $10. To risk $50, which is 0.5 percent of a $10,000 account, a 12.0 pip stop needs about 0.42 lots, while a 37.4 pip stop needs about 0.13 lots. The risk is the same; only the lot size changes.
On a small account, a cent or micro account lets you size small enough. We risk at most 2 percent per trade, usually 0.5 percent. These figures are arithmetic for illustration, not a recommendation about how much anyone should trade.
Disclaimer: This post reports what the Direction Sniper panel showed on EURUSD on 23 October 2026. It is educational analysis, not financial advice and not a trade signal service. All four tickets were still open at the time of writing, and three of them were only hours old. Price reaching a published target level is not the same as a realised result. High and low levels are approximate readings from the chart. Lot sizes are arithmetic for illustration and are not a recommendation about how much anyone should trade. Forex trading carries risk, and you should only trade money you can afford to lose.

