AUD USD Forecast Today, 21 October 2026: Is It Too Late To Buy AUDUSD Above 0.70? This AUD USD forecast today starts with a rally most traders noticed too late. On 15 October AUDUSD was trading below 0.6900. This morning it pushed above 0.7020. That is more than 120 pips in under a week, straight
AUDUSD Technical Analysis
This page carries the current AUDUSD technical analysis from the Direction Sniper panel, read across five timeframes. It is kept current rather than published once and left to age.
Everything here describes what the indicator shows. It is not a prediction of where price will go, and days with no trade appear exactly like days with one.

AUD USD Technical Analysis with Direction Sniper
New to these reads?
Start here: AUD USD Technical Analysis: How to Read the Daily Signal
Ask ten traders to run technical analysis on AUD USD and you will get ten different charts back.
One draws a descending trendline. One marks a support zone. One overlays Fibonacci levels from a swing that ended three weeks ago. One says the RSI is oversold. One says the same RSI reading means the sellers are in control. All ten are using real tools, and all ten are looking at the same candles, yet somehow four of them are buying while the other six are selling.
That is the problem with traditional technical analysis on the Aussie. It is not that the tools are wrong. It is that they are subjective, and subjective tools give you a second opinion instead of a decision.
Direction Sniper was built to remove the argument.
What the Tool Actually Does
Direction Sniper reads AUD USD across five timeframes at once and reports what each one is doing. The daily. The four hour. The one hour. The thirty minute. The fifteen minute.
It does not draw lines. It does not give an opinion. It reads price against a channel that moves with the market, and it reports one of two states on every timeframe: buying pressure, or selling pressure.
Then it does the part that matters most. It ranks them.
The Gatekeeper Idea
This is the single concept that separates Direction Sniper from an indicator that just paints arrows on your screen.
The daily and the four hour are not entry timeframes. They are gatekeepers. Their only job is to grant permission.
When both agree, you have permission to trade in that direction, and only that direction.
When they disagree, you have no permission at all, and the panel says so in plain words.
The fifteen minute, thirty minute and one hour are entry timeframes. Their job is timing, never permission. An entry timeframe flipping to buy while the gatekeepers are selling is not a signal. It is noise inside a larger move, and acting on it is how most traders lose money on this pair.
So the logic runs one way only. Permission first, timing second. A trade ticket builds only when an entry timeframe finally agrees with a verdict that has already been granted.
The Three Verdicts
Every AUD USD reading ends in one of three outcomes.
BUY. The daily and the four hour both show buying pressure. You are looking for long entries only. Short setups on the fifteen minute are ignored, no matter how clean they look.
SELL. Both gatekeepers show selling pressure. You are looking for short entries only.
NO TRADE. The gatekeepers disagree. The panel refuses to give you a direction.
Most traders skip straight past that third one. It is the most valuable output the tool produces.
NO TRADE is the reading that saves your account. When the daily and the four hour are fighting each other, AUD USD is usually chopping inside a range, and a range is where entry signals fire most often and fail most often. The fifteen minute will give you a beautiful looking breakout, take you in, and reverse forty minutes later. The panel is telling you that the market has not decided yet, so you should not decide either.
A tool that only ever tells you to buy or sell is not analysis. It is a slot machine with a nicer interface.
The Trade Ticket
When permission and timing finally line up, the panel builds a ticket, and the ticket is complete before you click anything.
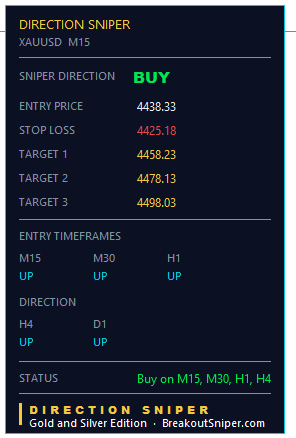
It gives you the entry price. It gives you the stop loss. It gives you three targets, calculated at one times, two times and three times the distance from your entry to your stop.
That last part is deliberate. Your risk is defined by the distance between the entry and the stop, and every target is a multiple of that same distance. So you always know what you are risking against what you are aiming for, before the trade starts, not while it is running and your judgement is compromised.
Once price moves far enough that the stop level leaves where it started, the label changes from STOP LOSS to TRAILING STOP. That is the panel telling you the trade is no longer defending your capital, it is defending your profit.
Why This Suits AUD USD in Particular
The Australian dollar is a follower, not a leader.
It reacts to the US dollar. It reacts to iron ore and commodity flows. It reacts to Chinese economic data. It reacts to the gap between what the Reserve Bank of Australia is doing and what the Federal Reserve is doing. And because it sits in the Asian session, it often drifts quietly for hours and then gets repriced the moment London opens.
That behaviour creates two specific traps.
The first is the false Asian session breakout. Thin volume pushes price through a level, the fifteen minute lights up, and London reverses the whole thing inside the first hour. Gatekeeper permission filters most of these out, because the four hour and the daily rarely shift on a thin session.
The second is the correlation trap. Traders who take an AUD USD trade alongside a NZD USD trade and a gold trade often believe they are holding three positions. They are frequently holding one position three times, because all three are really a bet on the US dollar. If the dollar turns, all three lose together.
What It Does Not Do
Honesty matters more than hype here, so let me be clear about the limits.
Direction Sniper does not predict. It reports what price has already done and what that gives you permission to do next.
It does not know the news. A Reserve Bank of Australia statement or a US inflation print can move AUD USD in seconds, and no indicator reads a headline before it prints.
It does not remove losses. Trades will hit the stop. You will see them on this site, reported openly, because a signal record with no losing trades in it is not a record worth reading.
What it does is take the arguing out of the chart, and give you a repeatable answer to the only question that matters before you risk money: what direction is this pair in, and am I allowed to trade it right now.
See It on Your Own Chart
Every AUD USD post on this site is produced with the same panel, on the same five timeframes, using the same rules you have just read.
You can run it on your own MetaTrader charts and read the Aussie yourself, live, without waiting for anyone to post an analysis.
Direction Sniper Reads Five Timeframes And Gives You One Verdict: BUY, SELL, or NO TRADE.
This Is The System Saying SELL!
Discover Our AUD USD Technical Analysis Post
New to these reads?
Start here: AUD USD Technical Analysis: How to Read the Daily Signal
AUD USD Forecast Today, 8 October 2026: The Trailing Stop Triggered. The Ticket Had Already Reached Two Targets. Executive Summary Every timeframe on AUD USD is pointing the same way. Daily down, four hour down, and all three entry charts down with them. Nothing is waiting. AUD USD is trading at 0.69394. Chart Entry Signal
AUD USD Forecast Today, 5 October 2026: Why Is My 15 Minute Chart Bullish When Everything Else Says Sell? Executive Summary AUD USD is in SELL mode. The daily and the four hour both point down, which sets the verdict for the pair. But the fifteen minute chart is pointing up. That is the whole
AUD USD Forecast Today: 30 September 2026 EXECUTIVE SUMMARY Verdict: SELL The daily and four hour both show selling pressure. All five timeframes now agree, which is the cleanest state the panel produces. Open and Closed Tickets Timeframe Direction Entry Stop Targets Status H4 SELL 0.71111 0.71343 3 of 3 All targets reached H1 SELL
AUD USD Forecast Today, 29 September 2026: Every Timeframe Has Turned Down Here is the aud usd forecast today, 29 September 2026, and one thing has changed since yesterday that changes everything else. Yesterday three of the five timeframes on the panel were pointing up. Today every single one points down. For the current reading
AUD USD Forecast Today, 28 September 2026: One Ticket Complete, Two Currently Losing Here is the aud usd forecast today, 28 September 2026, and I am going to give you the whole picture rather than the flattering half of it. Four tickets on the Aussie right now. One has reached all three targets and closed.

Why Trade AUD USD
Most new traders end up on gold or GBP JPY because those pairs move fast, and fast feels like opportunity. Then they spend a year wondering why a market that moves so much keeps taking their money.
AUD USD is the opposite trade. It is slower, more orderly, and far more forgiving of a trader who is still learning to read direction. That is exactly why it deserves a place in your rotation.
Here is the honest case for it.
It Moves for Reasons You Can Name
The Australian dollar is a commodity currency. Australia sells iron ore, coal, natural gas and gold, mostly to Asia, and China is by far its largest customer.
So when you ask why AUD USD moved, there is usually a real answer. Chinese manufacturing data came in weak. Iron ore prices dropped. The Reserve Bank of Australia signalled it was done cutting. The US Federal Reserve sounded more hawkish than expected. Global appetite for risk improved and money rotated out of the safety of the US dollar.
Compare that with a pair that lurches on flow nobody can explain. The Aussie has a story, and a market with a story is a market you can build a method around.
It Respects Structure
This is the part that matters most for technical analysis.
AUD USD tends to trend in reasonably clean channels and hold its levels rather than spiking through them and instantly reversing. It does not often produce the violent whipsaws you see on gold, where a fifty dollar move can appear and vanish inside twenty minutes and take out every stop in both directions on the way.
For a channel based tool, that behavior is close to ideal. Direction on the Aussie tends to establish itself and then persist for a while, which means a gatekeeper timeframe that flips to selling pressure often stays there long enough for the entry timeframes to give you two or three usable setups, not one lucky one.
Orderly markets reward patient systems. Chaotic markets reward nobody for long.
The Session Rhythm Is Predictable
AUD USD runs on a schedule you can almost set a watch by.
During the Asian session it often drifts inside a narrow range, building the day's structure quietly. When London opens, volume arrives and the pair frequently expands out of that range. When New York joins, the US dollar side of the pair takes over and the move either extends or gets reversed.
That rhythm is a gift. It tells you when to be at the screen and when to leave it alone. A trader who only ever checks AUD USD around the London open and the New York overlap will see most of the tradeable movement in far less screen time than someone staring at charts all day.
It also suits traders in Asian time zones, who get the London open at a civilized hour instead of the middle of the night.
The Costs Are Low
AUD USD is one of the most heavily traded currency pairs in the world, which means spreads are tight and liquidity is deep at almost every hour.
This is not a small detail. If you are trading the fifteen minute or thirty minute chart and targeting moves of twenty to forty pips, a wide spread can quietly eat a large share of what you make. On an exotic pair, the spread alone can turn a system that works on paper into a system that loses in practice.
On the Aussie, execution costs are about as low as retail trading gets, and slippage during normal hours is minimal. Your edge stays yours.
It Fits Smaller Accounts
Because AUD USD is priced well below parity rather than near it or above it, a standard lot carries a smaller cash value per pip than many alternatives, and position sizing on a modest account is straightforward.
The daily range is usually large enough to be worth trading and small enough that a sensible stop is not a huge dollar figure. That combination is unusual. Most markets give you one or the other.
If you are learning to trade with real money but small money, this pair lets you take the same setups a larger account takes, with the same structure, without a single trade being able to hurt you badly.
It Teaches You the US Dollar
Roughly half of every AUD USD move is not about Australia at all. It is about the US dollar.
Learning to read this pair teaches you to separate the two sides, and that skill transfers everywhere. Once you can tell the difference between the Aussie strengthening and the dollar weakening, you will read EUR USD, GBP USD and gold better than you did before, because all four are partly the same trade wearing different clothes.
That leads to the one warning that belongs in this section.
The Correlation Warning
AUD USD, NZD USD and gold frequently move together, because all three trade against the US dollar and all three respond to the same risk appetite.
A trader who is long AUD USD, long NZD USD and long gold at the same time usually believes they hold three positions with diversified risk. They hold one position three times. If the dollar turns against them, all three lose together, and the account takes triple the damage they thought they had exposed.
Check what else you are holding before you add an Aussie trade. Correlation is the quiet reason many accounts fall apart while every individual trade looked reasonable.
Where the Method Comes In
None of this makes AUD USD easy. An orderly market still hands out losses to anyone trading against the larger direction, and a pair that trends cleanly will trend cleanly against you for days if you picked the wrong side.
What it does mean is that AUD USD rewards a structured approach more reliably than a chaotic market does. If you have a repeatable way to establish direction first and time the entry second, this is one of the better pairs in the world to apply it to.
That is what Direction Sniper is for. Permission from the daily and four hour, timing from the fifteen minute, thirty minute and one hour, and a complete ticket with entry, stop and three targets before you risk anything.
When Every Timeframe Agrees,
You Get The Full Trade Ticket
This Is The System Saying YES!
Four Tickets From One Verdict
H4 Trade Ticket
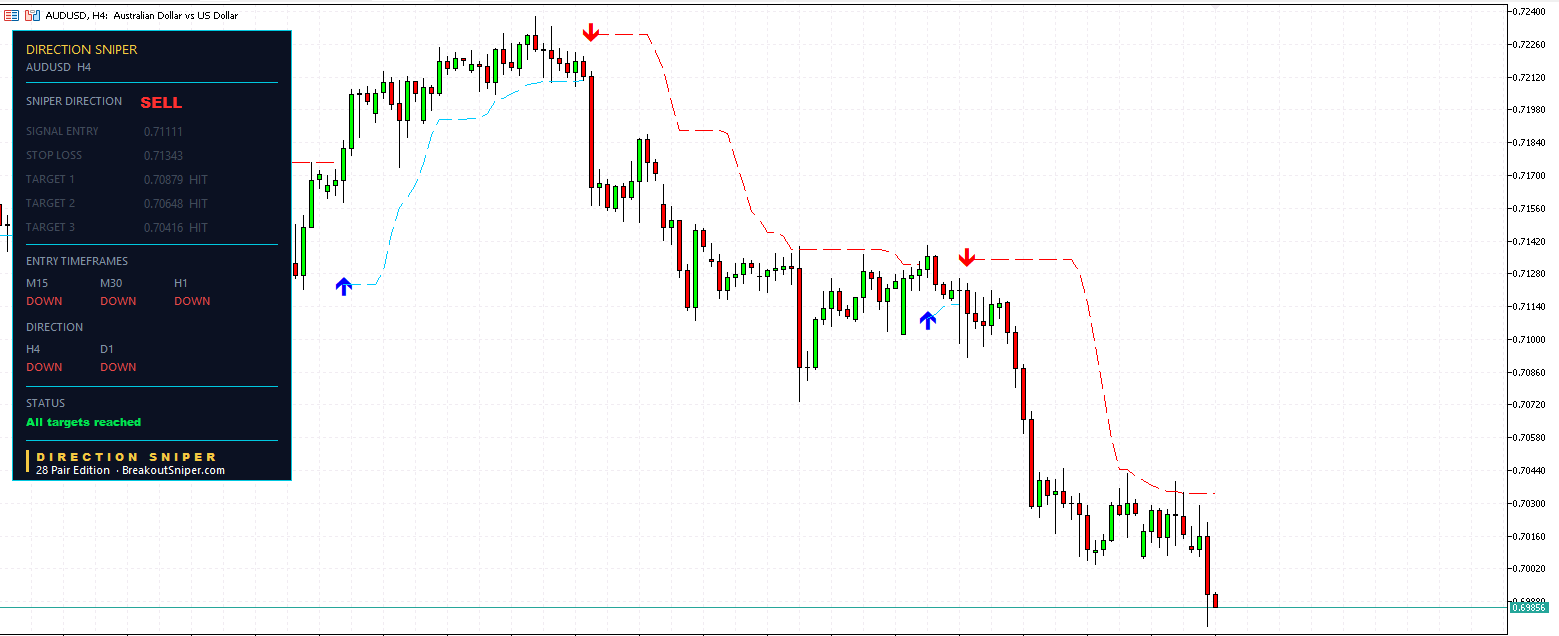
Read the panel from the bottom up, because that is the order the tool thinks in.
Direction row: H4 is DOWN. D1 is DOWN.
Both gatekeepers agree. The four hour and the daily are both showing selling pressure on AUD USD, so permission is granted in one direction only. Every long setup on this pair is off the table while those two rows stay red. Not weakened. Off the table.
Entry timeframes: M15 DOWN. M30 DOWN. H1 DOWN.
All three timing charts agree with the permission. This is full alignment, five timeframes reading the same direction at once, which is the cleanest state the panel can show you. It does not happen every day. When it does, it is telling you that the short term and the long term are not fighting, and the market has committed.
Sniper Direction: SELL.
Now the ticket.
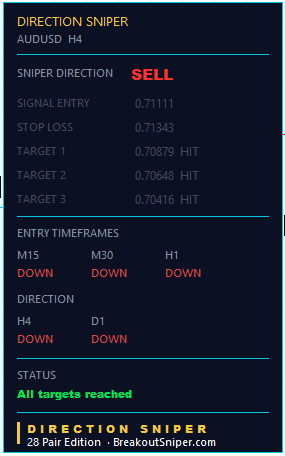
Signal entry 0.71111. Stop loss 0.71343.
That is a risk of 23.2 pips. Everything else on the ticket is built from that one number.
Target 1 at 0.70879, which is 23.2 pips, one times the risk.
Target 2 at 0.70648, which is 46.3 pips, two times the risk.
Target 3 at 0.70416, which is 69.5 pips, three times the risk.
All three show HIT.
Status line reads All targets reached.
That is a full ticket, from a defined entry, through a defined stop, to all three defined targets. A trader taking one third of the position off at each target closed the entire trade in profit, with the risk on the table never exceeding 23.2 pips from the moment of entry.
What the Chart Shows After That
Look at the right side of the chart. Price is now trading near 0.6985.
That is roughly 125 pips below the entry price, which is another 56 pips past Target 3.
Some traders will look at that and feel they left money on the table. I would rather frame it the way it should be framed. The ticket did its job. It defined a trade with 23.2 pips of risk and delivered three targets at a planned multiple of that risk. What the market does afterwards is a bonus for anyone who chose to trail a runner, and irrelevant to whether the trade was correct.
A system that tells you where to get out is worth more than a system that tells you to hold and hope. Targets are what turn a good read into closed profit.
Now Look at the Arrows
Follow the arrows across the middle of the chart. You can see where the H4 direction flipped up briefly before turning down again and continuing the fall.
That flip is the most instructive thing on this entire image.
That is the moment a trader without a gatekeeper structure gets picked off. Price rallies, the shorter timeframes light up green, it feels like the bottom is in, and the temptation to buy is enormous. Traders who took that bait bought into a pair that went on to fall another hundred pips.
The daily was never asked for its opinion by those traders. It should have been.
This is the entire argument for reading permission before timing, and this one chart makes it better than any explanation I could write.
This Is What the Tool Does Every Day
Everything on that panel was generated automatically on the chart. The direction rows. The entry timeframe rows. The entry price. The stop. Three targets calculated at one times, two times and three times the risk. The status line updating as each target was reached.
No lines drawn. No opinion. No waiting for someone to publish an analysis.
You get the same panel on your own MetaTrader charts, on AUD USD and on every other pair you follow, updating live while the market moves.
If you have been reading these AUD USD posts and thinking the reads look obvious after the fact, that is the point. They look obvious because the tool removes the part that makes them look complicated, which is the arguing.
H1 Trade Ticket
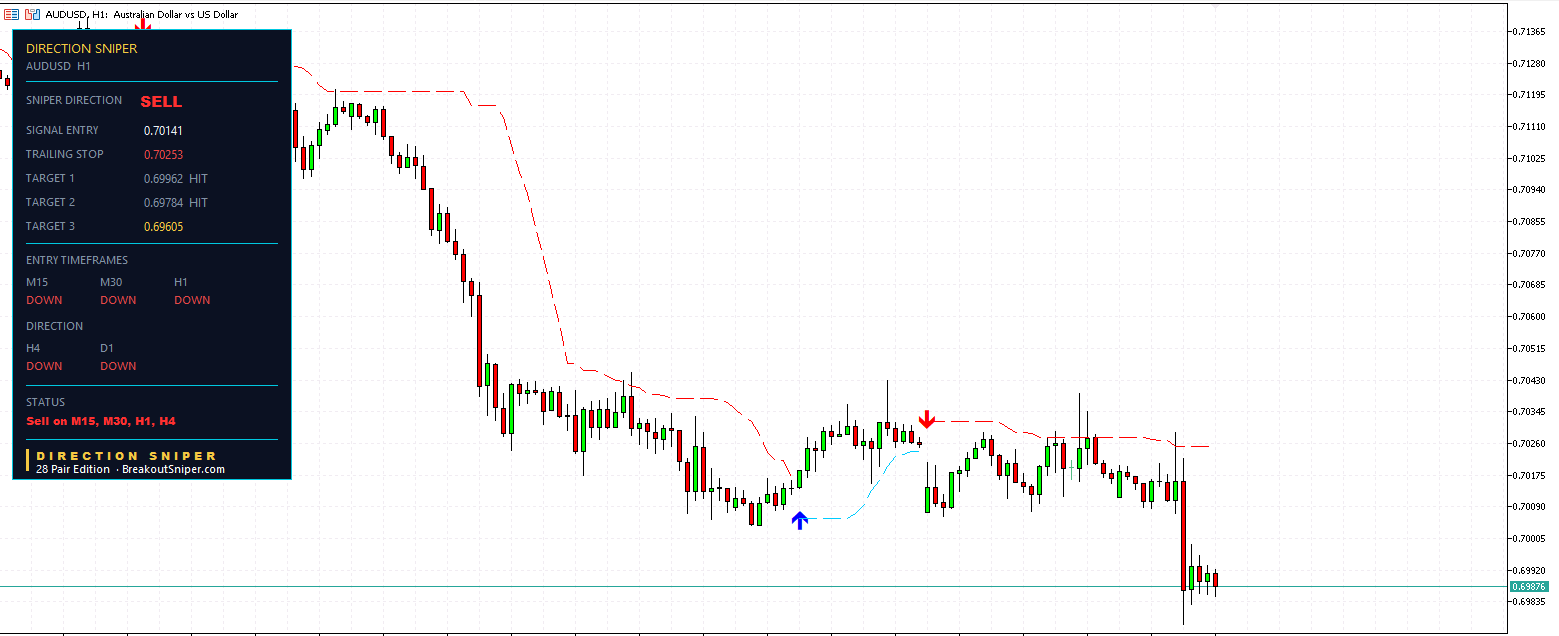
Look at the direction rows first. H4 DOWN. D1 DOWN.
Identical to the four hour chart you just saw. Same pair, same gatekeepers, same verdict. SELL.
This is the part most traders never set up properly, so it is worth saying plainly.
Once Direction Sniper Locks Into Sell Mode, Every Smaller Timeframe Goes Hunting for Sells
The permission granted by the daily and the four hour does not stay on the four hour chart. It flows down.
The one hour stops looking for opportunities. It starts looking for sell opportunities. So does the thirty minute. So does the fifteen minute. They are no longer asking which way the market might go. That question has already been answered upstairs. They are now asking one narrower question: where is the next good place to join the direction that has already been established.
That is the difference between a trader with a system and a trader with an indicator.
A trader with an indicator gets a signal on the fifteen minute and takes it, because the signal fired. A trader with a system checks whether the fifteen minute is even allowed to speak today, and only then looks at what it is saying.
When all five rows read the same way, as they do here, every entry timeframe is working for the same outcome. You are not taking five different trades. You are taking one direction, with five different opportunities to join it.
The Ticket This Produced
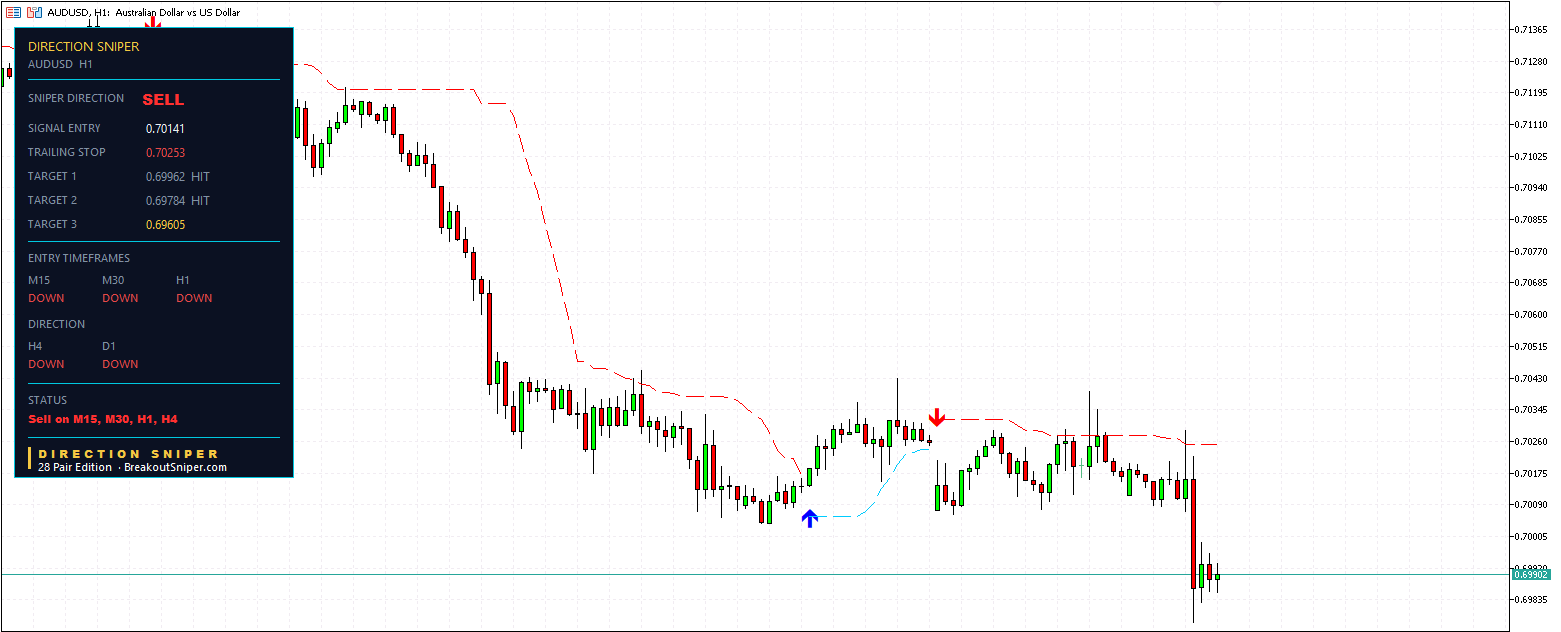
Signal entry 0.70141. Trailing stop 0.70253.
Target 1 at 0.69962, which is 17.9 pips.
Target 2 at 0.69784, which is 35.7 pips.
Target 3 at 0.69605, which is 53.6 pips.
Target 1 HIT. Target 2 HIT. Target 3 still pending.
Now compare that with the four hour ticket on the same pair, at the same time.
The four hour risked 23.2 pips for a third target 69.5 pips away. The one hour risked 17.9 pips for a third target 53.6 pips away.
Same direction. Same market. Different size of trade.
That is the practical value of having the entry timeframes work underneath the verdict rather than against it. You get to choose how much of the move you want to take and how much room you are willing to give it, without ever changing your view on direction.
Read the Stop Label Carefully
The four hour panel said STOP LOSS.
This one says TRAILING STOP.
That word change is not decoration. It means the stop has moved away from where it started.
The original stop on this ticket sat at 0.70320, giving the trade 17.9 pips of room. It now sits at 0.70253, which is 11.2 pips above entry. The trade has proven itself enough that the panel has pulled the stop in.
Once you see TRAILING STOP on a ticket, the job of that level has changed. It is no longer protecting your account from the entry. It is protecting the progress the trade has already made.
Most traders manage this by feel and get it wrong in both directions, moving the stop too early and getting shaken out, or never moving it at all and watching a winner turn into a loser. The panel does it the same way every time, with no emotion attached to the decision.
The Status Line
Sell on M15, M30, H1, H4.
That single line is telling you that four separate timeframes currently hold live sell tickets on AUD USD, all pointing the same way.
This is the state you want to see before you commit size. Not one signal on one chart. A stack of them, agreeing, underneath a verdict that came from above.
An Honest Note on This Trade
Target 3 has not been reached.
Price has pulled back off the low and is currently sitting around 0.69876, which is roughly 26 pips in profit from entry but still 27 pips short of the final target. It may get there. It may reverse and take out the trailing stop instead, closing the trade in profit but below its full potential.
I am showing you a trade in progress rather than a finished one on purpose, because this is what most of your screen time actually looks like. Tickets in flight, some targets hit, one still open, and a stop that has already moved to protect what you have.
The system does not need this trade to reach Target 3 to have done its job. It defined the risk before entry, it delivered two targets, and it has already moved the stop into profit protection. Everything after that is upside.
Get the Same Panel on Your Charts
Every number on this ticket was produced automatically. The entry, the original stop, the trailing stop as it moved, three targets at fixed multiples of risk, and a status line summarizing every timeframe at once.
It runs on AUD USD and on every other pair you trade, live, on your own MetaTrader platform.
M30 Trade Ticket
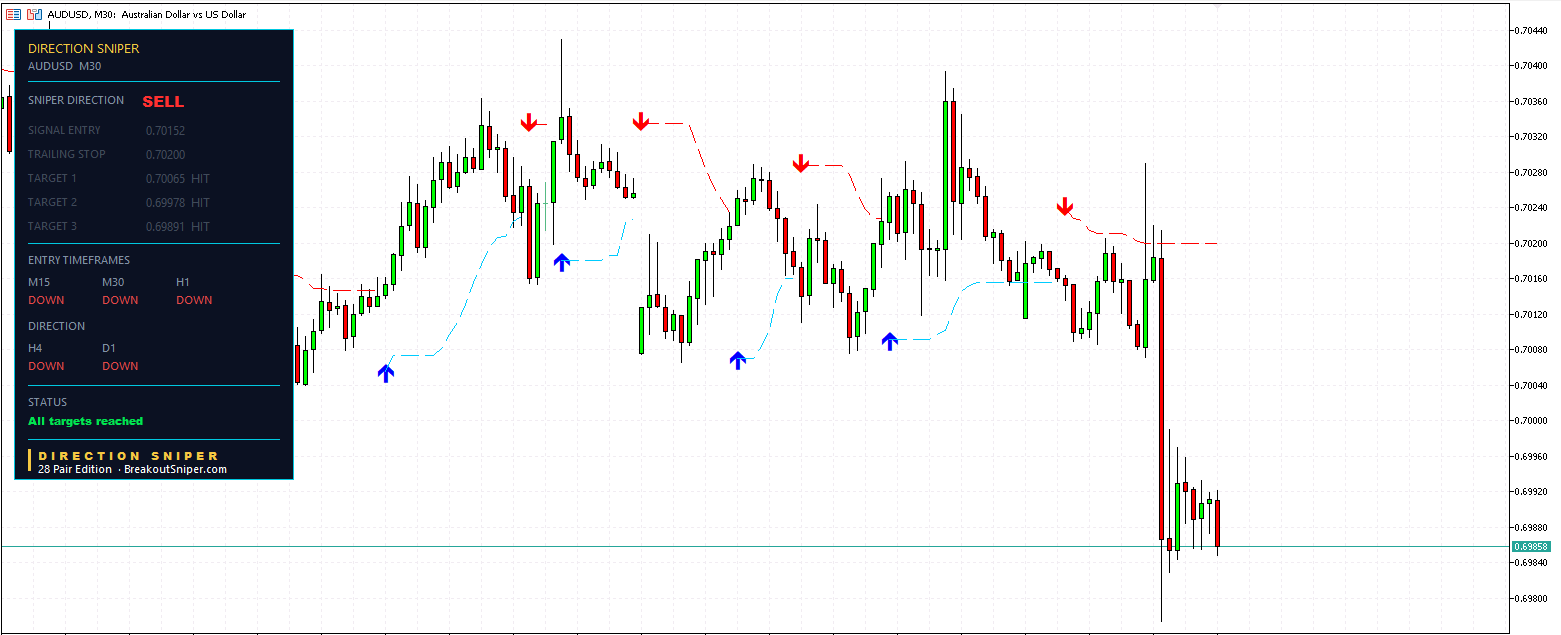
Direction rows again. H4 DOWN. D1 DOWN.
Third chart, same verdict. SELL.
But this chart has something the other two did not, and it is the single most useful thing on this entire page.
Count the Blue Arrows
Look across the middle of the chart. There are four blue up arrows on it.
Four separate moments where the thirty minute channel flipped to buying pressure. Four moments where price rallied and the short term picture genuinely looked like it was turning. Four moments where a trader watching only this chart would have had a clear, tempting, well formed reason to go long.
Every one of them was ignored.
Not because the arrows were wrong. They correctly showed what the thirty minute was doing. They were ignored because the daily and the four hour never gave permission for a buy, and the entry timeframes do not get a vote on direction.
Now look at where price finished. Down at 0.6985, well below every one of those blue arrows.
Four temptations. Four losses avoided. One direction held.
That is what "locked into sell mode" actually buys you. Not better signals. Fewer wrong ones.
The traders who lost money on AUD USD over these sessions were not using bad indicators. They were taking real signals from a real chart, with nothing above those signals telling them whether they were allowed to act.
The Ticket
Signal entry 0.70152. Trailing stop 0.70200.
Target 1 at 0.70065, which is 8.7 pips.
Target 2 at 0.69978, which is 17.4 pips.
Target 3 at 0.69891, which is 26.1 pips.
All three HIT. Status reads All targets reached.
The original stop sat at 0.70239, giving the trade 8.7 pips of room. It has since pulled in to 0.70200, which is 4.8 pips above entry.
Price is now trading near 0.69858, roughly 29 pips below the entry.
Now Put All Three Tickets Side by Side
Same pair. Same day. Same direction. Three different sized trades.
| Timeframe | Risk | Target 3 | Result |
|---|---|---|---|
| H4 | 23.2 pips | 69.5 pips | All targets reached |
| H1 | 17.9 pips | 53.6 pips | Two targets, third running |
| M30 | 8.7 pips | 26.1 pips | All targets reached |
Read that table slowly, because it answers the question every trader eventually asks, which is which timeframe should I trade.
The answer is that the timeframe does not change whether you are right. It changes the size of the bet.
The four hour asked you to risk 23.2 pips and offered 69.5. The thirty minute asked for 8.7 and offered 26.1. Both were correct about direction, because both were reading the same gatekeepers. What differed was how much room the trade needed and how long you had to sit in it.
A smaller account can take the M30 ticket and hold a sensible position size. A trader who cannot watch charts all day takes the H4 and checks in twice. Neither is trading a different market. They are trading the same direction with different patience.
That choice only becomes available once direction is settled. Before that, changing timeframe is not a strategy decision. It is just looking for a chart that agrees with you.
The Cost of the Smaller Timeframe
I will not sell you the M30 as free money, so here is the tradeoff in plain terms.
Eight point seven pips of stop is a very small amount of room. On AUD USD that is roughly one ordinary candle. The M30 will get you stopped out more often than the H4 will, and you will have sessions where the direction was completely right and the stop was simply too tight for the noise.
The four blue arrows on this chart are the visual proof of that. On the thirty minute, price does not move down in a straight line. It stair steps, rallies, pulls back, and rallies again. Tight stops live inside that noise.
What you buy for accepting more stop outs is position size and speed. Same dollar risk, larger position, faster resolution, more opportunities per week.
That is the trade you are making. Not better or worse. Different.
Everything on This Page Came From One Tool
Three charts. Three tickets. Three sets of entries, stops and targets, all calculated automatically at one, two and three times the risk. Stops that relabeled themselves to TRAILING STOP the moment they moved. A status line on every chart summarizing all five timeframes at once.
No lines drawn by hand. No opinions. No waiting for an analyst to publish something.
This is what your own AUD USD charts look like with Direction Sniper running on them, and it works the same way on every pair you follow.
M15 Trade Ticket
Direction rows one final time. H4 DOWN. D1 DOWN.
Fourth chart. Same verdict. SELL.
This Chart Has the Most Noise on the Page
Count the arrows again. On the thirty minute there were four blue up arrows. Here there are six, and six red ones to match.
Twelve direction changes on the fifteen minute inside the same window where the four hour had two.
That is not a fault in the tool. That is what the fifteen minute chart is. Zoom in far enough on any market and it looks like it is changing its mind every hour, because at that resolution it is. Price rallies forty pips, the channel flips, price falls fifty, it flips back.
A trader who only looks at this chart will feel like the market is random, because from where they are standing it is.
The daily and the four hour are what make this chart readable. They do not remove the noise. They tell you which half of it to ignore.
The Ticket
Signal entry 0.69912. Trailing stop 0.69941.
Target 1 at 0.69603, which is 30.9 pips.
Target 2 at 0.69295, which is 61.7 pips.
Target 3 at 0.68986, which is 92.6 pips.
No targets hit yet. Status reads Sell on M15, M30, H1, H4.
This one is fresh. Price is currently near 0.69857, about 5 pips below the entry, and the trade has barely started.
Something Here Should Surprise You
The fifteen minute ticket has the widest risk on the page.
Thirty point nine pips, against 23.2 on the four hour, 17.9 on the one hour and 8.7 on the thirty minute. The smallest timeframe produced the biggest stop.
If you expected the opposite, so would most traders, and this is worth understanding properly because it is where a lot of people get their position sizing wrong.
The stop is not set by the timeframe. It is set by how wide the market's structure is at the moment the signal fires.
This signal fired immediately after a large impulsive drop. When price moves that hard and that fast, the channel expands, and the tool respects that expansion rather than pretending the market is calmer than it is. A tight stop placed inside a violent move is not disciplined risk management. It is a donation.
So the honest version of the timeframe rule is this. Smaller timeframes usually give smaller stops. They do not always. Check the actual number on the ticket before you size the position, every single time, because the ticket is telling you what this specific trade needs, not what its timeframe normally needs.
That is why the panel prints the numbers rather than leaving you to guess them.
Watch What the Trailing Stop Has Already Done
The original stop on this ticket sat at 0.70221, a full 30.9 pips above entry.
It now sits at 0.69941, which is 2.9 pips above entry.
The trade has not reached a single target yet, and the tool has already cut the risk on the table from 30.9 pips down to 2.9. Worst case on this position is now close to a breakeven exit.
That is the part of trading that most people do worst and that costs them the most. They enter with a plan and then manage the exit with their feelings. The panel moves the stop on a rule, at the same speed, whether the trader is watching or asleep.
This Is What Tomorrow Morning Looks Like
The other three tickets on this page are finished or nearly finished. This one is not, and that is deliberate.
When you open your charts tomorrow, most of what you see will look like this. Not a neat completed example with three green HIT labels. A live ticket, a stop that has moved, targets still ahead of it, and a decision to make about whether to take it.
The panel does not make that decision easier by promising it will work. It makes it easier by having already answered everything except the decision itself. Direction, permission, entry, risk, three targets, and a stop that manages itself from there.
Enter your text here...
AUD USD Trailing Stop Loss Strategy
Stops behave differently on AUD USD than on most pairs, and the reason is the clock.
The Australian dollar spends the Asian session drifting inside a narrow range. Volume is thin, candles are small, and a tight stop sits comfortably untouched for hours. Then London opens, volume arrives, the range expands, and the same stop that looked generous at three in the morning is suddenly inside normal market noise.
A trader who sets a stop during the quiet hours and walks away has set it for a market that no longer exists by lunchtime.
This is where a stop that manages itself earns its place.
Look at What Happened Across the Four Tickets Above
Scroll back up and compare the stop levels on the four panels. Three of them say TRAILING STOP. One still says STOP LOSS.
H4 ticket. Stop still reads STOP LOSS at 0.71343, and the trade reached all three targets anyway. The level never moved from where it started.
H1 ticket. Opened with 17.9 pips of risk. Now trailing at 11.2 pips.
M30 ticket. Opened with 8.7 pips of risk. Now trailing at 4.8 pips.
M15 ticket. Opened with 30.9 pips of risk. Now trailing at 2.9 pips, and not one target has been reached yet.
That last one is the clearest example on the page. A trade with no targets hit has already had its worst case cut by 28 pips.
And notice the one that did not move. The four hour ran all the way to Target 3 with the stop sitting exactly where it began.
That is the point most people miss about trailing stops. The level does not move on a timer, and it does not move because time has passed or because you are feeling nervous. It moves when the market's own structure moves it. Three tickets earned a trail. One did not need one, and the tool did not invent a reason to give it one.
What the Label Change Actually Means
STOP LOSS means the level is still sitting where it started. Your full original risk is on the table.
TRAILING STOP means the level has left its origin. The risk on the table is now smaller than what you signed up for, and the level has switched jobs from protecting your account to protecting your progress.
You do not have to calculate anything or decide anything. The word on the panel tells you which state you are in.
The Honest Tradeoff
A trailing stop will take you out of trades that would have worked.
That is not a flaw to hide. On a pair like AUD USD that stair steps down rather than falling in a straight line, a stop pulled in tight will sometimes get clipped by an ordinary pullback, and you will watch the move continue without you. It happens, it stings, and any tool that tells you otherwise is not being straight with you.
What you buy for that cost is the thing that actually kills accounts, which is the winning trade that reverses all the way through entry and closes as a loss. The trailing stop makes that outcome far less likely, and it does it without you having to be at the screen.
Slippage and weekend gaps are the other limit worth knowing. A stop level is where the order sits, not a guarantee of the price you get if the market jumps past it.
Want the Full Method
Trailing stops are a bigger subject than one section on one page can cover properly, including how to set them up on MetaTrader and when to use one at all.
How We Do Our AUD USD Technical Analysis
Everything above followed one process, and it is the same process behind every AUD USD post on this site.
Step one. Ask the daily and the four hour for permission.Both agree, you have a direction. They disagree, the verdict is NO TRADE and the day is over before it started.
Step two. Lock every smaller timeframe to that direction.Once the verdict is SELL, the fifteen minute, thirty minute and one hour stop hunting for opportunities and start hunting for sell opportunities only. The twelve arrows on the chart above included six buy signals. All six were correctly ignored.
Step three. Take the ticket the entry timeframe gives you.Entry, stop, and three targets at one, two and three times the risk, all printed before you commit anything.
Step four. Choose your size from the ticket, not from the timeframe.This page has four tickets on the same pair with risk ranging from 8.7 pips to 30.9 pips. Read the number.
Step five. Let the stop do the managing.When it relabels from STOP LOSS to TRAILING STOP, the trade has moved past its starting risk and the level is now protecting progress instead of capital.
That is the whole method. Five steps, repeated the same way every day, on every pair.
Four Tickets, One Direction
| Timeframe | Risk | Target 3 | Status |
|---|---|---|---|
| H4 | 23.2 pips | 69.5 pips | All targets reached |
| H1 | 17.9 pips | 53.6 pips | Two targets, third running |
| M30 | 8.7 pips | 26.1 pips | All targets reached |
| M15 | 30.9 pips | 92.6 pips | Fresh signal, stop already trailed |
Four separate tickets. Four different risk profiles. One direction, granted once, at the top.
This is what AUD USD technical analysis looks like when the direction question is settled before the entry question is asked, instead of after.
Run It on Your Own Charts
Every panel on this page was produced automatically on a standard MetaTrader chart. No lines drawn. No indicators stacked on top of each other. No waiting for someone to publish an analysis before you know what the Aussie is doing.
Direction Sniper reads five timeframes, grants or refuses permission, and builds the complete ticket for you, live, while the market moves.
Frequently Asked Questions
What is AUD USD technical analysis?
AUD USD technical analysis is the study of price movement on the Australian dollar against the US dollar, using the chart itself rather than economic forecasts. Traditional methods rely on trendlines, support zones and indicators that different analysts read differently. Direction Sniper takes a structured approach instead, reading five timeframes automatically and producing one verdict: BUY, SELL or NO TRADE.
Which timeframes should I use to trade AUD USD?
Direction Sniper uses five. The daily and four hour charts act as gatekeepers and decide direction. The fifteen minute, thirty minute and one hour charts handle entry timing only. The gatekeepers decide whether you are allowed to trade at all, and the entry timeframes decide when. Using entry timeframes without that permission layer is the most common reason traders lose on this pair.
What is the best time of day to trade AUD USD?
The London open and the New York overlap produce most of the tradeable movement. During the Asian session the Australian dollar often drifts inside a narrow range with thin volume, which produces breakouts that reverse once real volume arrives. Many false signals on AUD USD appear in quiet Asian hours and get undone within the first hour of London.
What does NO TRADE mean on the Direction Sniper panel?
NO TRADE means the daily and four hour charts disagree, so no direction has been established. When the gatekeepers conflict, AUD USD is usually ranging, and ranges are where entry signals fire most often and fail most often. The panel refuses to give a verdict rather than guessing. It is the reading that protects your account most.
What is the difference between STOP LOSS and TRAILING STOP on the panel?
STOP LOSS means the level is still sitting where the trade started, so your full original risk is on the table. TRAILING STOP means the level has moved away from its origin, so the risk is now smaller than you began with. The label change tells you the level has switched from protecting your capital to protecting your progress.
How are the three targets calculated?
Every target is a multiple of the trade's own risk, which is the distance from the entry price to the stop loss. Target 1 sits at one times that distance, Target 2 at two times and Target 3 at three times. Because the calculation is fixed, you know exactly what you are risking against what you are aiming for before the trade starts.
Does Direction Sniper predict where AUD USD will go?
No. It reports what price has already done across five timeframes and what that gives you permission to do next. It does not forecast, and it does not read news. A Reserve Bank of Australia statement or a US inflation release can move the Aussie in seconds, and no indicator sees a headline before it prints. Trades will be stopped out.
Can I use Direction Sniper on pairs other than AUD USD?
Yes. The same five timeframe logic runs on every pair the edition covers, and the panel works identically on each one. The rules do not change with the market. What changes is the size of the stop and the targets, because those are calculated from each pair's own price structure at the moment the signal fires.
RISK WARNING
Trading foreign exchange, gold, silver and other leveraged products carries a high level of risk and is not suitable for everyone. You can lose some or all of your invested capital. Do not trade with money you cannot afford to lose. Past performance, whether shown in screenshots, examples or descriptions, is not an indication of future results. Before trading, consider your experience, your financial situation and your risk tolerance. If you are unsure, seek advice from an independent financial adviser.
PERFORMANCE DISCLAIMER
The charts and screenshots on this page show real examples of the Direction Sniper indicator on historical and live market data. They are shown to demonstrate how the indicator works. They are not a promise of results. Trading involves losing trades. This page deliberately includes a losing example because losses are a normal part of trading with any system. No indicator, including Direction Sniper, can predict the market or prevent losses. The indicator provides information. All trading decisions, and their results, are yours.
NO FINANCIAL ADVICE
Direction Sniper is a software tool and an educational product. Nothing on this page, in the indicator, in the trading manual or in our emails is financial advice, investment advice or a recommendation to buy or sell any financial instrument. BreakoutSniper.com is not a broker, financial adviser or investment company.
HYPOTHETICAL PERFORMANCE NOTICE
CFTC RULE 4.41: Hypothetical or simulated performance results have certain limitations. Unlike an actual performance record, simulated results do not represent actual trading. Also, since the trades have not been executed, the results may have under or over compensated for the impact, if any, of certain market factors, such as lack of liquidity. Simulated trading programs in general are also subject to the fact that they are designed with the benefit of hindsight. No representation is being made that any account will or is likely to achieve profit or losses similar to those shown.
REFUND POLICY
All sales are final. There are no refunds. The full details of what you receive, including platform requirements, MetaTrader 4 desktop only, and licensing terms, one license per MT4 account number, are stated on this page. By purchasing, you confirm that you have read this page and accept these terms.
PURCHASES AND DELIVERY
Payments are processed securely by JVZoo. Product delivery and license activation are handled by email. License activation requires you to provide your MetaTrader 4 account number and is normally completed within 24 hours.
AFFILIATION
This site and the products offered are not affiliated with, endorsed by or sponsored by MetaQuotes Software Corp., any broker, JVZoo, Google, Facebook or Meta Platforms. MetaTrader 4 is a trademark of MetaQuotes Software Corp.Disclaimer: Please note that this product does not provide any guarantee of income or success. The results achieved by the product owner or any other individuals mentioned are not indicative of future success or earnings. This website is not affiliated with FaceBook or any of its associated entities. Once you navigate away from FaceBook, the responsibility for the content and its usage lies solely with the user. All content on this website, including but not limited to text, images, and multimedia, is protected by copyright law and the Digital Millennium Copyright Act. Unauthorized copying, duplication, modification, or theft, whether intentional or unintentional, is strictly prohibited. Violators will be prosecuted to the fullest extent of the law.
We want to clarify that JVZoo serves as the retailer for the products featured on this site. JVZoo® is a registered trademark of BBC Systems Inc., a Florida corporation located at 1809 E. Broadway Street, Suite 125, Oviedo, FL 32765, USA, and is used with permission. The role of JVZoo as a retailer does not constitute an endorsement, approval, or review of these products or any claims, statements, or opinions used in their promotion.