AUD USD Forecast Today, 21 October 2026: Is It Too Late To Buy AUDUSD Above 0.70?
This AUD USD forecast today starts with a rally most traders noticed too late.
On 15 October AUDUSD was trading below 0.6900. This morning it pushed above 0.7020. That is more than 120 pips in under a week, straight through the 0.70 round number.
By now, a trader who only just looked at the chart is asking one question: is it too late to buy?
The Direction Sniper panel never had to ask it. Over the last two days it reached six targets on AUDUSD, and it did it without chasing a single candle. Even the one ticket that reached no target at all closed in front of its entry.
Today every timeframe reads UP, from the 15 minute to the daily. Here is how the panel handled the whole rally, and what it tells you about joining a trend that is already moving.
1. The Trap: Chasing A Rally You Missed
When a pair runs 120 pips without you, two things usually happen.
Some traders chase. They buy wherever price is, usually after a big green candle, with a stop placed wherever it feels safe. A guessed stop means a guessed lot size, and that is how a good direction still turns into a bad trade.
Other traders fight it. They decide the move has gone too far and sell into a rising market, against a 4 hour and daily chart that both point up.
Both mistakes come from the same place. The trader is reacting to how far price has already moved, instead of to what the charts are saying right now.
Direction Sniper reads the 4 hour and the daily first. On AUDUSD both say UP, so the verdict is BUY, and the panel only looks for buy tickets. Then it waits for a faster chart to line up with that verdict before it prints one.
That is the whole difference. The panel does not chase the move. It waits for the move to pause, then prints a fresh ticket with the stop already marked.
2. Six Targets Reached In Two Days
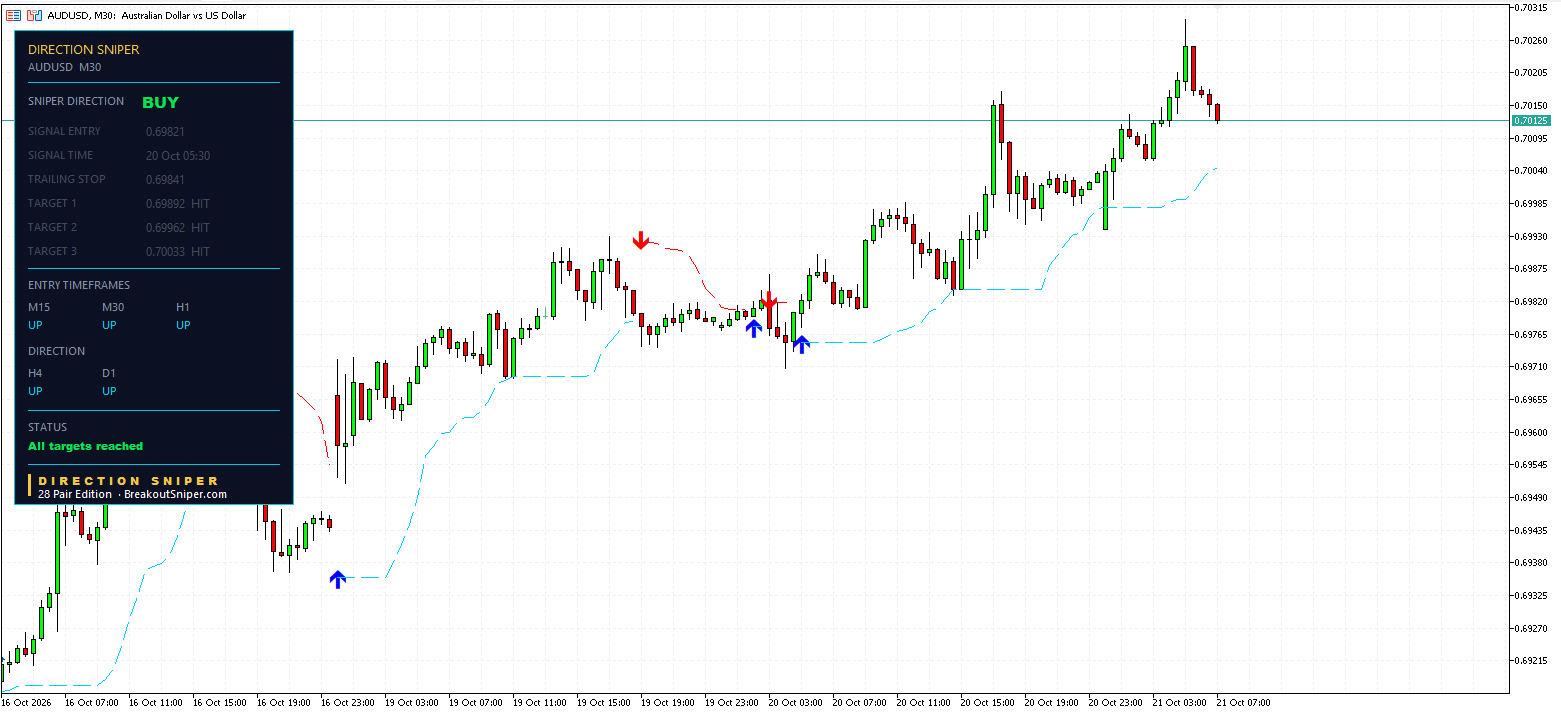
The 30 minute. On 20 October at 05:30 the 30 minute printed a buy at 0.69821, with a stop 7.1 pips below.
- Target 1 at 0.69892: reached
- Target 2 at 0.69962: reached
- Target 3 at 0.70033: reached
Status: All targets reached. Its trailing level finished at 0.69841, which is 2.0 pips in front of the entry.
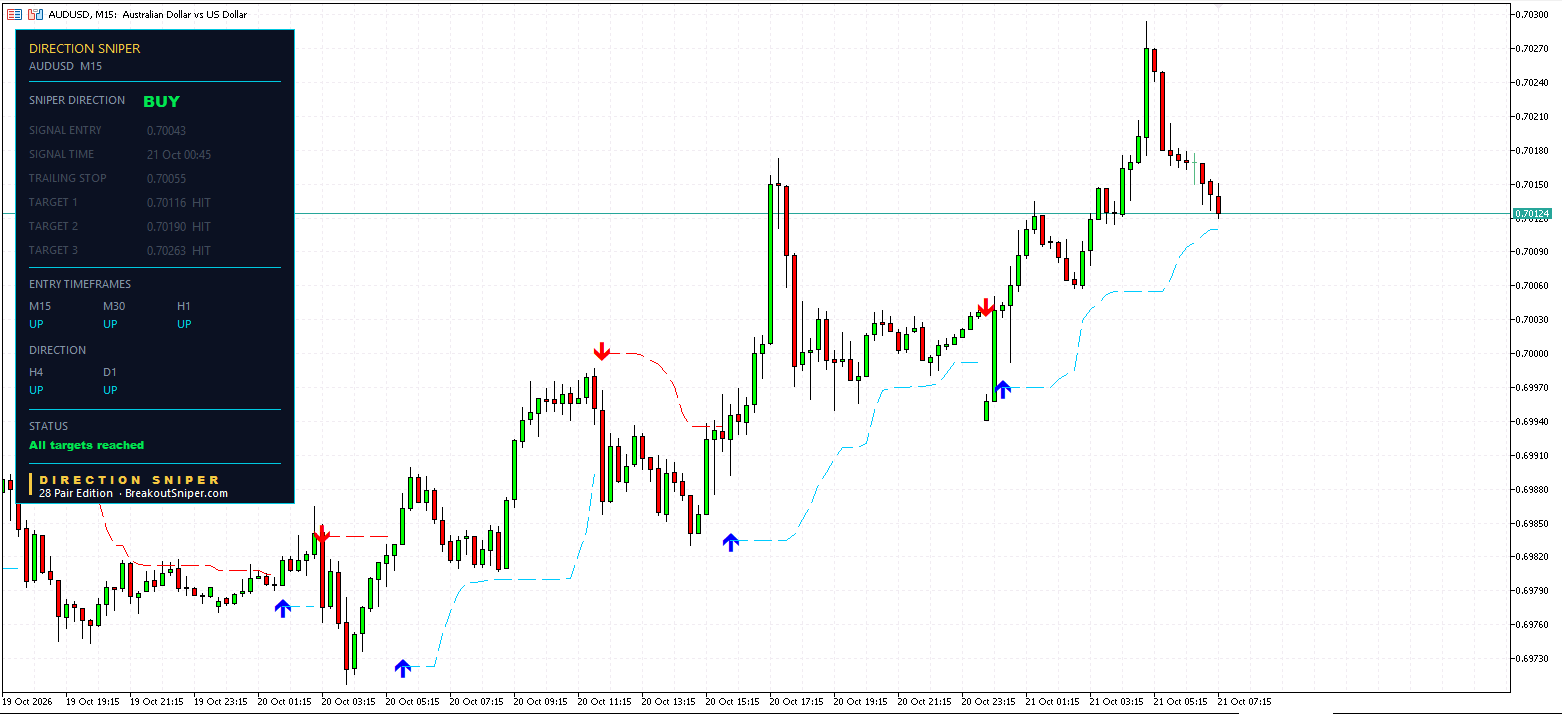
The 15 minute. Overnight AUDUSD paused just above 0.70. At 00:45 on 21 October the 15 minute printed a fresh buy at 0.70043, with a stop 7.3 pips below.
- Target 1 at 0.70116: reached
- Target 2 at 0.70190: reached
- Target 3 at 0.70263: reached
Status: All targets reached. Its trailing level finished at 0.70055, 1.2 pips in front of the entry.
Look at where that 15 minute ticket printed. Above 0.70. Exactly the place where a trader without the panel would be asking whether it was too late. The panel did not answer that question with an opinion. It answered it with a ticket: the stop, three targets, and a clear risk before entry.
So is it too late to buy a strong trend? Not if you wait for the pause. A strong trend hands you a fresh ticket every time it stops to breathe.
3. The Ticket That Missed Every Target, And Still Closed In Front
Now the ticket most posts would hide.
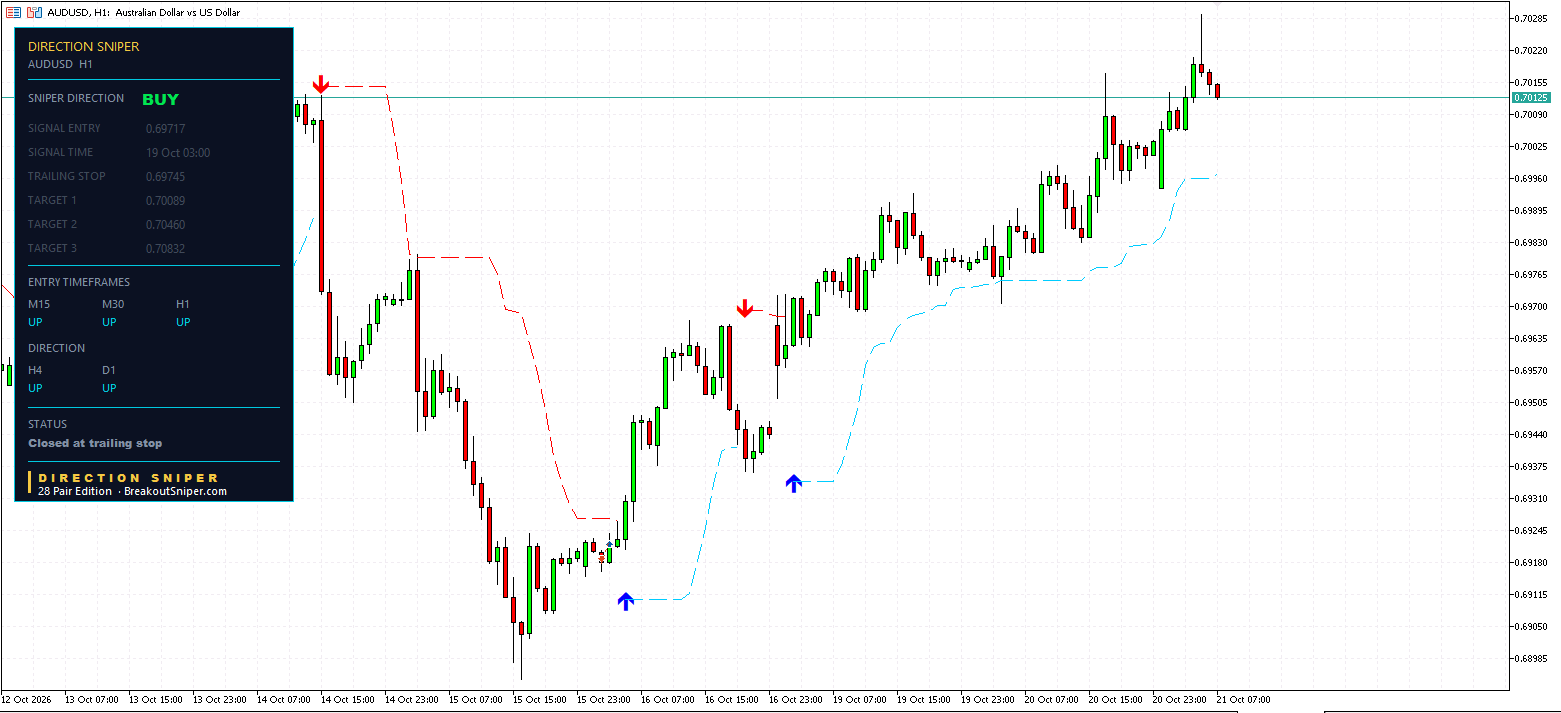
On 19 October at 03:00 the 1 hour printed a buy at 0.69717. Its stop sat 37.2 pips below, at about 0.69345. Its targets were 0.70089, 0.70460 and 0.70832.
It reached none of them.
But look at what the trailing level did while the trade was open. It tightened from about 0.69345 up to 0.69745, which is 40 pips of tightening on a 37.2 pip stop. By the time AUDUSD dipped back, the level had already crossed 2.8 pips in front of the entry.
Status: Closed at trailing stop.
Then AUDUSD carried on higher without it, and traded through the level where that ticket’s Target 1 had sat.
Here is why this matters. A trader without a trailing level would have done one of two things:
- Left the original stop 37 pips away and watched the trade swing back toward it, or
- Moved the stop to break even on a guess, too early, and been shaken out anyway
The panel showed a third path. The level moved with the structure of the chart, so when the dip came, the ticket that missed every target closed in front of its entry instead of at its full stop.
And here is the part that answers today’s question. When the 1 hour closed, the move did not leave without you. The 30 minute and the 15 minute picked it straight back up with new tickets, and all six of their targets were reached.
A trailing stop that closes in front of entry is not a missed trade. It frees you for the next ticket.
If you want the full picture of how a trailing level crosses entry, we walk through five real panels in our guide on when to move stop loss to break even.
4. The 4 Hour: Still Running, Most Of Its Risk Already Removed
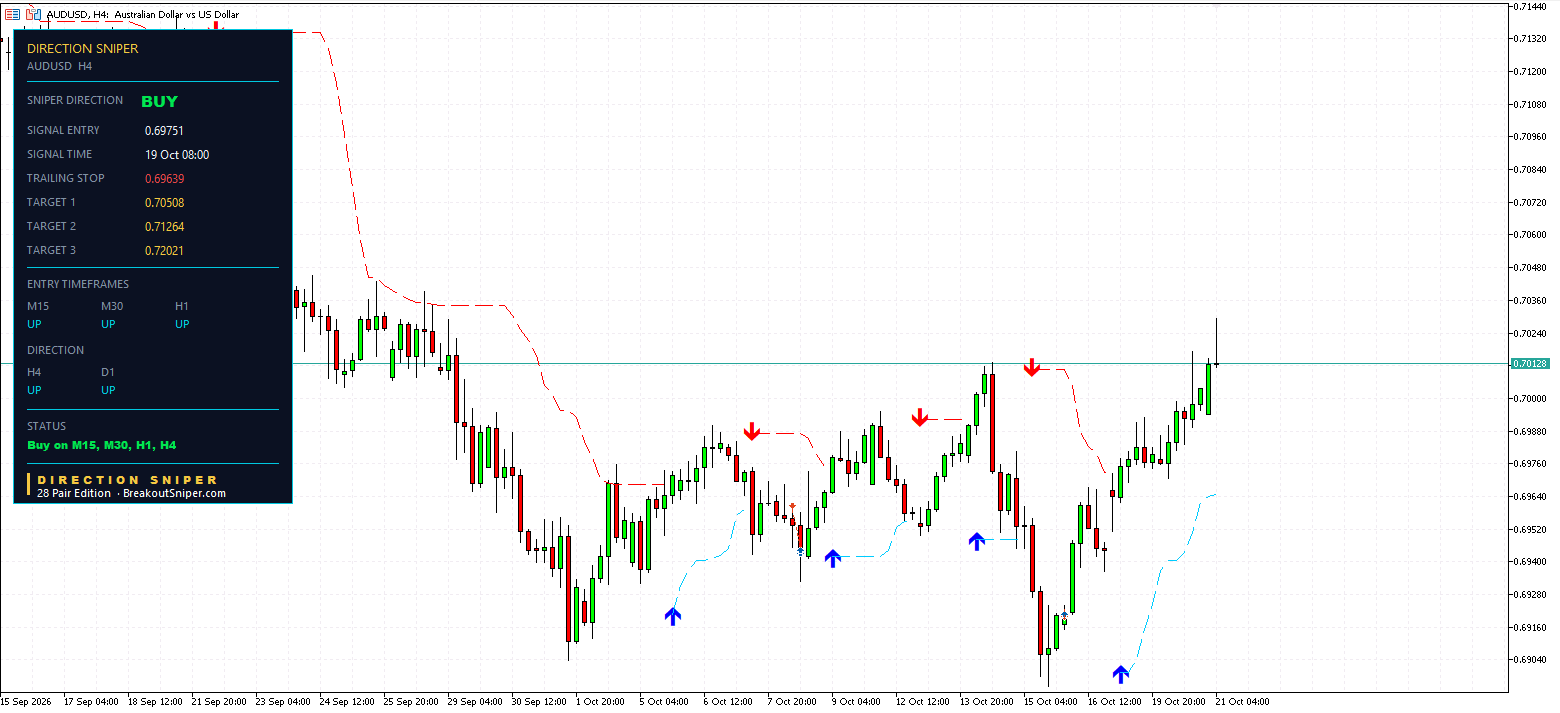
Underneath all of this, the 4 hour has been running since 19 October at 08:00.
| Level | |
|---|---|
| Entry, buy | 0.69751 |
| Original stop | about 0.68994, so 75.7 pips of risk |
| Target 1 | 0.70508 |
| Target 2 | 0.71264 |
| Target 3 | 0.72021 |
| Trailing stop now | 0.69639 |
The trailing level has tightened by about 64.5 pips. That means about 85 percent of the original risk has already been removed, while price sits about 37 pips above the entry, roughly halfway to Target 1.
The label on the panel now reads TRAILING STOP, not STOP LOSS. Direction Sniper calculates and shows that level; the trader adjusts the order on the platform.
The status line reads Buy on M15, M30, H1, H4. Every entry chart and both direction charts agree.
5. With A BUY Verdict, This Is A Pullback Play: Buy Into Weakness
Here is the answer to today’s question in one line. With AUDUSD on a BUY verdict, you do not buy strength. You buy weakness.
The 4 hour and the daily both point up, so the panel only looks for buy tickets. That changes what a good entry looks like. The big green candle that makes everyone excited is not the moment. The dip that makes everyone nervous is.
Look at where today’s two tickets came from:
- The 30 minute printed its buy at 0.69821 after AUDUSD had dipped to around 0.6972 earlier that morning.
- The 15 minute printed its buy at 0.70043 after AUDUSD pulled back from around 0.7017 to below 0.70.
Both tickets came out of a pullback. Neither came from chasing a candle.
But buying weakness does not mean catching a falling knife. The panel does it in three steps:
- The trend. The 4 hour and the daily agree on UP. That is the verdict.
- The pullback. A faster chart turns DOWN for a while. That is the weakness, and the panel waits through it.
- The trigger. That faster chart turns back UP and lines up with the verdict. Only then does a ticket print, with the stop already marked below the pullback.
So you buy into weakness, and you let the panel tell you when the weakness is over.
We walked through the same method on GBPUSD in how to buy a pullback without catching a falling knife. Different pair, identical rule: the fast charts turn first, the big charts decide.
6. What To Watch Next
Today’s board is as aligned as a board gets. But alignment is a description of now, not a promise about what comes next.
The levels that matter:
- The 15 minute trailing line sits closest to price, at about 0.7011. It is the chart most likely to react first to the next pause.
- The 30 minute line sits at about 0.7005, just above the 0.70 round number.
- The 1 hour line sits lower, at about 0.6997.
- The 4 hour trailing stop is at 0.69639. That is the level that would close the main ticket.
A fresh buy ticket needs a pullback first, then a faster chart turning back up to line up with the BUY verdict again. Nobody knows whether price pauses at 0.7011, at 0.70, or keeps going first. What the panel gives you is the map: where the next ticket would come from, and where the current one would end.
What would change the picture: if the 4 hour turned DOWN while the daily stayed UP, the verdict would move to NO TRADE and the panel would stop looking for buys. That is not what the board shows today.
For a longer view of how this pair behaves, see our AUDUSD technical analysis page.
7. Two Seven Pip Tickets And A 75 Pip Ticket: Same Risk, Different Lots
Today’s board has tickets with stops of 7.1, 7.3, 37.2 and 75.7 pips. If every one of them risks the same 0.5 percent of a $10,000 account, which is $50, the lot sizes are very different.
AUDUSD is quoted in US dollars, so one pip on a standard lot is about $10.
| Chart | Stop distance | Lot size for $50 of risk |
|---|---|---|
| M15 | 7.3 pips | about 0.68 lots |
| M30 | 7.1 pips | about 0.70 lots |
| H1 | 37.2 pips | about 0.13 lots |
| H4 | 75.7 pips | about 0.066 lots |
The 15 minute ticket needs ten times the lot size of the 4 hour ticket to risk the same $50. That is not more risk. It is the same risk, measured properly.
This is exactly why the panel prints the stop before you enter. When the stop is marked, the lot size stops being a guess.
What if your account is small? On a $100 account, 0.5 percent is 50 cents. A 0.01 lot on the 4 hour ticket risks about $7.57, which is 7.6 percent of the account on one trade. That is far too much.
A cent account solves this. On a cent account, lots are measured in hundredths of a standard lot, so the size you need becomes something your broker can actually accept. For small balances we recommend a RoboForex Cent account or an XM Micro account. These are partner links, so we may receive a commission at no cost to you.
We risk at most 2 percent per trade, usually 0.5 percent. If you are worrying about every trade, your lot size is still too big.
Stop Asking Whether It Is Too Late
The Direction Sniper 28 Pair Edition puts this exact panel on AUDUSD and 27 other pairs.
- Direction. One verdict from the 4 hour and the daily. Today on AUDUSD it says BUY, so you never find yourself selling into a rising market.
- Pullbacks that have not broken structure. On a BUY verdict you buy weakness, not strength. The panel waits through the dip and prints the ticket when a faster chart turns back up. Today that pullback came just above 0.70, and three targets were reached from it.
- The stop loss. Every ticket arrives with its stop marked, and the trailing level shows when it has crossed in front of entry. Today it turned the one ticket that reached no target into one that closed in front.
28 pairs, one licence, MT4 or MT5.
Want a read like this in your inbox? Join The Daily Sniper Read, free, every trading day.
AUD USD Forecast Today: Frequently Asked Questions
What is the AUD USD forecast today, 21 October 2026?
The Direction Sniper panel reads BUY on AUDUSD, because the 4 hour and the daily charts both point up.
All three entry charts, the 15 minute, 30 minute and 1 hour, also read UP, so the status line shows Buy on M15, M30, H1, H4. Price was trading around 0.7012 at the time of writing.
Is it too late to buy AUDUSD above 0.70?
The panel does not answer that question with an opinion. It waits for the rally to pause, then prints a fresh ticket with the stop already marked.
On 21 October at 00:45 the 15 minute printed a buy at 0.70043, above the 0.70 round number, with a stop 7.3 pips below. All three of its targets were reached.
Whether the next pause brings another ticket depends on a faster chart lining up with the BUY verdict again. Nobody knows in advance when that will happen.
Should you buy AUDUSD on strength or on a pullback?
With AUDUSD on a BUY verdict, the panel treats it as a pullback play: buy into weakness, not strength.
It waits for a faster chart to turn down in a pullback, then prints a buy ticket only when that chart turns back up and lines up with the verdict. On 21 October the 15 minute ticket at 0.70043 printed after AUDUSD pulled back from around 0.7017 to below 0.70.
How many AUDUSD targets were reached on 20 and 21 October 2026?
Six. The 30 minute ticket from 0.69821 reached 0.69892, 0.69962 and 0.70033. The 15 minute ticket from 0.70043 reached 0.70116, 0.70190 and 0.70263.
Price reaching a published target level is not the same as a realised result.
Why did the AUDUSD 1 hour ticket close while the trend kept going up?
The 1 hour printed a buy at 0.69717 on 19 October at 03:00, with a stop 37.2 pips below. While the trade was open, its trailing level tightened to 0.69745, which is 2.8 pips in front of the entry.
When AUDUSD dipped back, price touched that level and the ticket closed at its trailing stop, in front of its entry, before any target was reached. The faster charts then printed new tickets as the rally continued.
Where is the AUDUSD 4 hour trailing stop now?
The 4 hour buy from 0.69751 on 19 October at 08:00 started with a stop at about 0.68994, which is 75.7 pips of risk. Its trailing level now sits at 0.69639, so about 85 percent of the original risk has been removed.
Its targets are 0.70508, 0.71264 and 0.72021. Direction Sniper calculates and shows the trailing level; the trader adjusts the order on the platform.
What would change the AUD USD forecast?
If the 4 hour chart turned DOWN while the daily stayed UP, the verdict would move to NO TRADE and the panel would stop looking for buy tickets.
The 4 hour trailing stop at 0.69639 is the level that would close the main ticket. The faster trailing lines sit at about 0.7011 on the 15 minute, 0.7005 on the 30 minute and 0.6997 on the 1 hour.
What lot size goes with a 7 pip stop on AUDUSD compared with a 75 pip stop?
One pip on a standard AUDUSD lot is about $10. To risk $50, which is 0.5 percent of a $10,000 account, a 7.3 pip stop needs about 0.68 lots, while a 75.7 pip stop needs about 0.066 lots. The risk is the same; only the lot size changes.
On a small account, a cent or micro account lets you size small enough. We risk at most 2 percent per trade, usually 0.5 percent. These figures are arithmetic for illustration, not a recommendation about how much anyone should trade.
Disclaimer: This post reports what the Direction Sniper panel showed on AUDUSD on 21 October 2026. It is educational analysis, not financial advice and not a trade signal service. The 4 hour ticket was still open at the time of writing. The trailing line levels are approximate readings from the chart. Price reaching a published target level is not the same as a realised result, and passing a level where a closed ticket’s target sat is not a result for that ticket. Lot sizes are arithmetic for illustration and are not a recommendation about how much anyone should trade. Forex trading carries risk, and you should only trade money you can afford to lose.

