AUD USD Forecast Today: 30 September 2026
EXECUTIVE SUMMARY
Verdict: SELL
The daily and four hour both show selling pressure. All five timeframes now agree, which is the cleanest state the panel produces.
Open and Closed Tickets
| Timeframe | Direction | Entry | Stop | Targets | Status |
|---|---|---|---|---|---|
| H4 | SELL | 0.71111 | 0.71343 | 3 of 3 | All targets reached |
| H1 | SELL | 0.70141 | 0.69979 trailing | 3 of 3 | All targets reached |
| M30 | SELL | 0.69671 | 0.69782 trailing | 0 of 3 | Running |
| M15 | SELL | 0.69691 | 0.69735 trailing | 0 of 3 | Running |
What the Panel Says
Sells only. Every row on every chart is red.
The H4 and H1 tickets are finished. Both reached all three targets.
The M30 and M15 tickets are fresh. Both have already trailed their stops, so neither is carrying its full original risk any more.
Nothing to chase today. Two trades have paid out and two are working.
This is what the indicator is showing, not a recommendation. Trading involves risk.
New to these reads? Here is how the panel works, explained step by step: How to Read the AUD USD Panel
Yesterday I Said It Might Not Get There
Let me start with the part I owe you.
Yesterday I published the H1 ticket on this pair with two targets reached and the third still ahead at 0.69605. I wrote this, and you can go back and check the wording:
Target 3 has not been reached. It may get there. It may reverse and take out the trailing stop instead, closing the trade in profit but below its full potential.
It got there.
The H1 panel now reads Target 1 HIT, Target 2 HIT, Target 3 HIT, and the status line says all targets reached.
I am opening with that for one reason. Anyone can publish a chart after the move and point at it. The only thing that means anything is publishing the uncertain part while it is still uncertain, and then reporting what happened either way.
If that trade had stopped out instead, you would be reading that this morning, with the same numbers and the same detail.
Permission First
H4: DOWN. D1: DOWN.
Both gatekeepers agree, so permission runs in one direction only. SELL.
And today every entry timeframe agrees with them. M15 down, M30 down, H1 down.
That is full alignment across all five charts. It does not happen every day, and when it does it means the short term and the long term have stopped arguing. The market has committed.
The status line on the shorter charts says it plainly: Sell on M15, M30, H1, H4. Four separate timeframes holding live sell tickets on the same pair, all pointing the same way.
H4 Trade Ticket
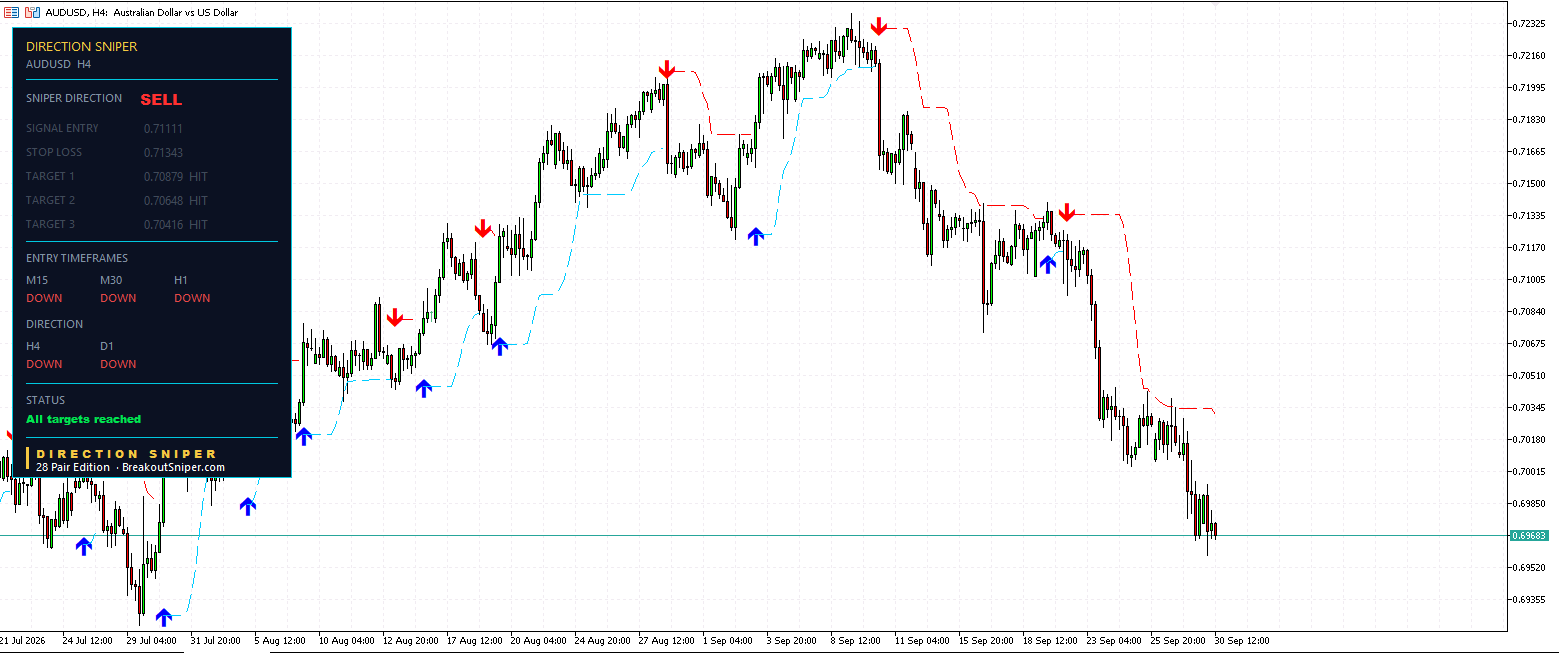
Signal entry 0.71111. Stop loss 0.71343.
Risk of 23.2 pips, and every target built from that one number.
Target 1 at 0.70879, hit.
Target 2 at 0.70648, hit.
Target 3 at 0.70416, hit.
All targets reached.
A complete ticket from a defined entry, through a defined stop, to all three targets. A trader taking a third off at each level closed the whole position in profit, with never more than 23.2 pips exposed from the moment of entry.
Now look at where price is. Around 0.69683.
That is 142.8 pips below the entry, and 73.3 pips beyond Target 3.
I know how that looks. It looks like money left behind.
Here is the better way to read it. The ticket was correct about direction and it delivered three targets at a planned multiple of the risk. What the market does afterwards is a bonus for anyone who chose to trail a runner, and it has no bearing on whether the trade was right.
A system that tells you where to get out is worth more than a system that tells you to hold and hope. Targets are what turn a good read into closed profit.
H1 Trade Ticket
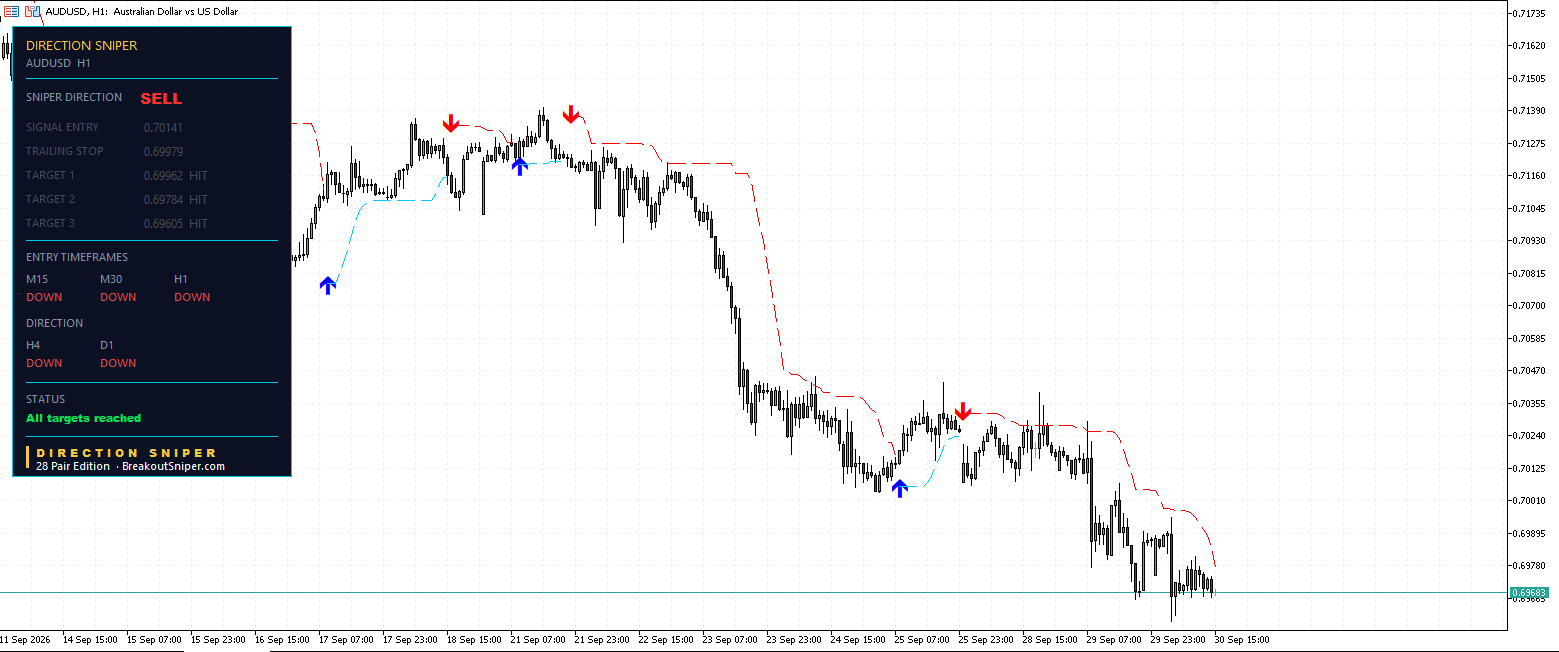
Signal entry 0.70141. Trailing stop 0.69979.
Target 1 at 0.69962, hit.
Target 2 at 0.69784, hit.
Target 3 at 0.69605, hit.
This is the ticket from yesterday’s post, now complete.
Risk when it opened was 17.9 pips, which puts the original stop at 0.70320.
Read the stop now. It says 0.69979.
That is 16.2 pips below the entry price. On a sell, that means the stop crossed the entry and went into profit some time ago. Long before Target 3 was reached, this trade could no longer lose money.
Price is currently near 0.69683, roughly 45.8 pips in profit from entry.
Two things worth taking from this one.
The word on the stop line told you the state of the trade without you having to calculate anything. STOP LOSS means full original risk still on the table. TRAILING STOP means the level has left its origin and switched from protecting your account to protecting your progress.
And the trade needed no decisions from you after entry. No moving the stop by feel, no deciding whether to take profit early, no watching the screen at three in the morning. Entry, stop, three targets, and a level that manages itself.
M30 Trade Ticket
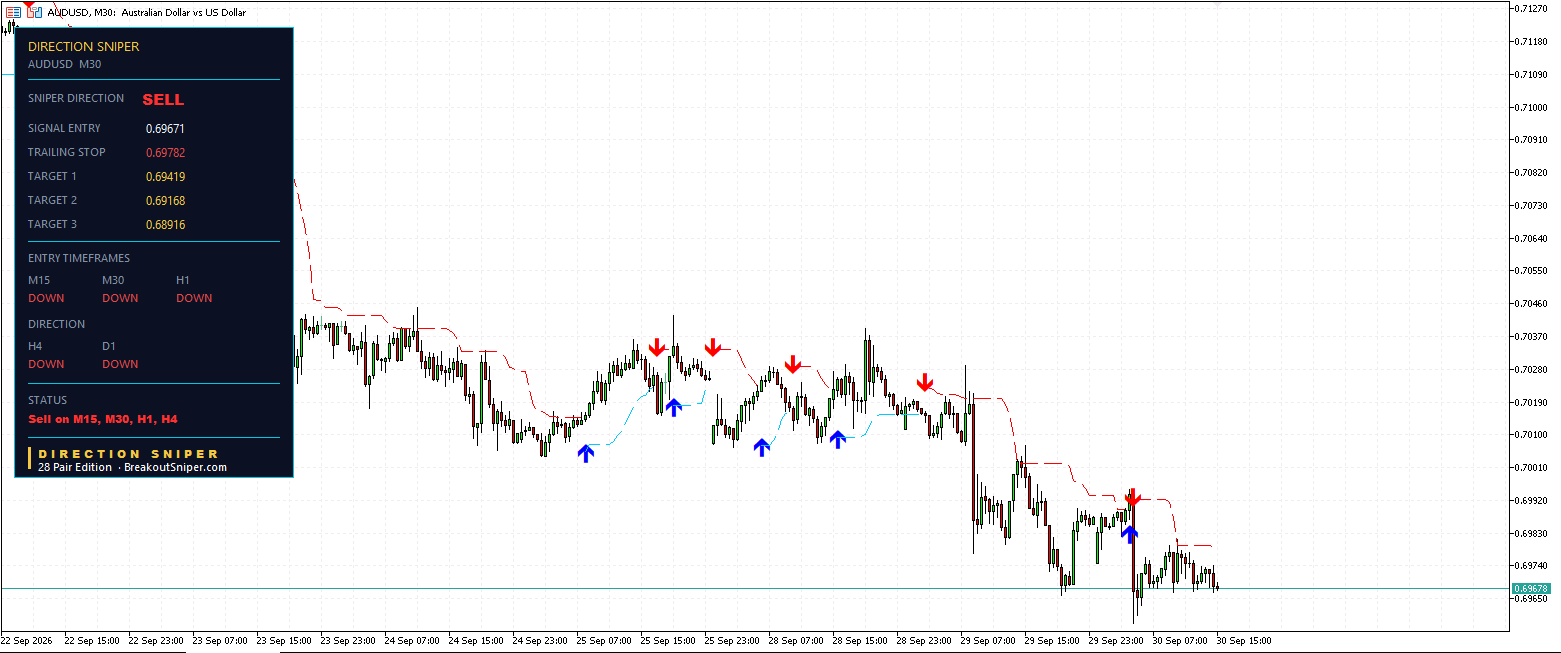
Signal entry 0.69671. Trailing stop 0.69782.
Target 1 at 0.69419, which is 25.2 pips.
Target 2 at 0.69168, which is 50.3 pips.
Target 3 at 0.68916, which is 75.5 pips.
No targets yet. This one is new.
The original stop sat at 0.69923, giving the trade 25.2 pips of room. It has already pulled in to 0.69782, which is 11.1 pips above entry. Worst case on this position has dropped by more than half before a single target has been reached.
Price is around 0.69678, which is essentially flat against the entry.
So this is a ticket doing nothing yet, with its risk already cut, sitting underneath a verdict that two other timeframes have just proved out. That is the most ordinary state a working system produces and it is the one nobody screenshots.
M15 Trade Ticket
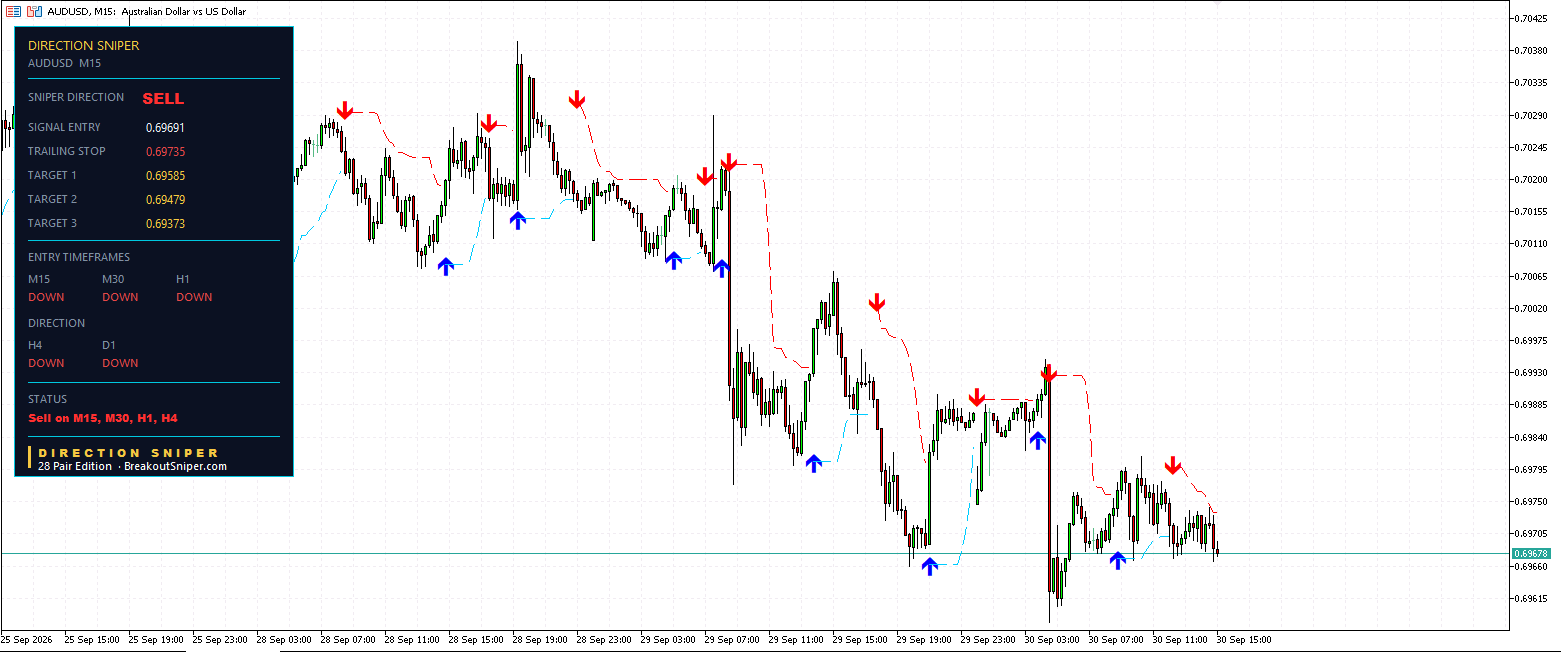
Signal entry 0.69691. Trailing stop 0.69735.
Target 1 at 0.69585, which is 10.6 pips.
Target 2 at 0.69479, which is 21.2 pips.
Target 3 at 0.69373, which is 31.8 pips.
Risk when it opened was 10.6 pips. The tightest on the page by a distance.
The original stop sat at 0.69797. It is now at 0.69735, only 4.4 pips above entry.
Price is near 0.69678, about 1.3 pips in profit.
Four Tickets, One Direction
| Timeframe | Risk | Target 3 | Result |
|---|---|---|---|
| H4 | 23.2 pips | 69.5 pips | All targets reached |
| H1 | 17.9 pips | 53.6 pips | All targets reached |
| M30 | 25.2 pips | 75.5 pips | Running |
| M15 | 10.6 pips | 31.8 pips | Running |
Read that table slowly, because it answers the question every trader eventually asks, which is which timeframe to trade.
The timeframe does not decide whether you are right. It decides the size of the bet.
The M15 asked for 10.6 pips of risk and offered 31.8. The M30 asked for 25.2 and offered 75.5, on the same pair, at almost the same moment, in the same direction.
And notice the M30 carries more risk than the H4 did. Smaller timeframes usually give smaller stops. They do not always. The stop is set by how wide the market’s structure is when the signal fires, not by which chart it fired on.
That is why the panel prints the number rather than leaving you to assume it. Read the ticket before you size the position, every single time.
Where the Next Trade Comes From
Today there is nothing to wait for, which is its own kind of answer.
All four timeframes are already holding tickets. Two have paid out in full and two are running with their stops already trailed. There is no missing piece and nothing worth chasing.
So the only thing worth watching is upstairs.
If the daily or the four hour turns, the verdict changes and everything underneath it changes with it. Until one of those two rows goes from DOWN to UP, the Australian dollar stays in a sell only regime and the shorter charts keep hunting in that direction.
The next decision point is therefore not an entry. It is whether the M30 and M15 tickets reach their targets or get taken out by their trailing stops. Both outcomes are fine. One banks the planned result and the other closes near breakeven, which is exactly what the trailing stop is there to arrange.
The hardest skill in trading is doing nothing while positions work. The panel makes that easier by simply not offering you anything new to do.
The Method in Brief
Five steps, the same every day, on every pair.
One. The daily and four hour decide direction. They grant permission or refuse it.
Two. Once a verdict exists, every shorter timeframe hunts only in that direction.
Three. When an entry timeframe agrees, the panel builds a complete ticket: entry, stop, and three targets at one, two and three times the risk.
Four. Size the position from the ticket’s own risk number, not from the timeframe.
Five. When the label changes to TRAILING STOP, the trade has passed its starting risk and the level manages itself from there.
That is the entire system. There is nothing else to learn.
Get the Same Panel on Your Charts
Everything in this post came off four screenshots, and every number on them was generated automatically.
The verdict. The permission rows. Four entry prices. Four stops, three of which have moved themselves into better positions since entry. Twelve targets calculated from the risk on each ticket. Six of them marked HIT without anyone having to check.
No lines drawn by hand. No indicators stacked on top of each other. No waiting for someone to publish an analysis before you know what the Aussie is doing.
You are reading this after the fact. Direction Sniper puts the same panel on your own MetaTrader charts, live, while the market is still moving, on AUD USD and on every other pair you follow.
One more thing, because it matters more than any feature.
Tickets get stopped out. The M30 and M15 trades above may well be two of them. When that happens you will see it on this site with the same numbers and the same honesty as the six targets reported today, because a record with no losses in it is not a record, it is marketing.
The reason a stop sits on every ticket is that some of them will be hit. That is the deal, and any tool that pretends otherwise is selling you something that does not exist.
Trading involves risk. Past performance does not guarantee future results. This post illustrates how the Direction Sniper indicator displays trades and is not a recommendation to trade. Nothing here is financial advice.

