EUR USD Forecast Today: 30 September 2026
EXECUTIVE SUMMARY
Verdict: SELL
The daily and four hour both show selling pressure. But all three entry timeframes are pointing the other way, so only one ticket exists today.
Open and Closed Tickets
| Timeframe | Direction | Entry | Stop | Targets | Status |
|---|---|---|---|---|---|
| H4 | SELL | 1.13662 | 1.13806 trailing | 1 of 3 | Running |
| H1 | SELL | No ticket | Waiting for alignment | ||
| M30 | SELL | No ticket | Waiting for alignment | ||
| M15 | SELL | No ticket | Waiting for alignment |
What the Panel Says
Sells only. The daily and four hour decided that and the shorter charts do not get a vote.
The H4 ticket has reached Target 1 and its stop has already trailed from 1.14028 down to 1.13806, so the risk on the table has dropped from 36.6 pips to 14.4.
H1, M30 and M15 have all produced nothing. All three are showing UP while the verdict is SELL, so no ticket was built on any of them.
Three of four charts issued nothing this morning. That is the point of the tool, not a gap in it.
This is what the indicator is showing, not a recommendation. Trading involves risk.
New to these reads? Here is how the panel works, explained step by step: How to Read the Direction Sniper Panel
Permission First
H4: DOWN. D1: DOWN.
Both gatekeepers agree. Verdict is SELL, and that verdict governs every shorter chart on the pair.
Now read the entry timeframe row on any of the four panels below.
M15: UP. M30: UP. H1: UP.
Every single entry chart is pointing the opposite way to the verdict.
This is the situation that separates a system from an indicator, and it is worth sitting with for a moment. Three charts are showing buying pressure right now. A trader watching any one of them this morning had a clean, well formed reason to go long on the euro.
The status line answers them in three words: Sell on H4.
One ticket. On the only timeframe that agrees with the direction that was granted upstairs.
H4 Trade Ticket
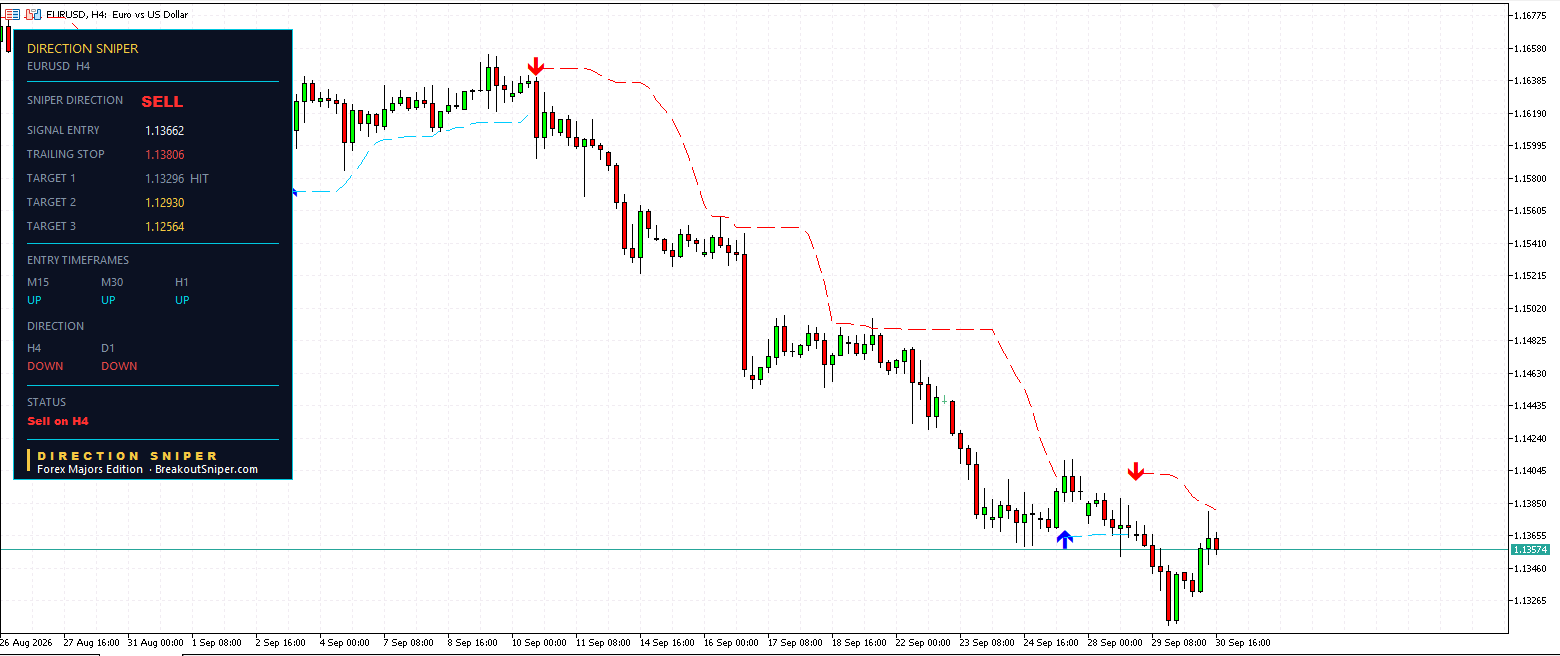
Signal entry 1.13662. Trailing stop 1.13806.
Risk when this opened was 36.6 pips, which puts the original stop at 1.14028.
Target 1 at 1.13296, hit.
Target 2 at 1.12930, which is 73.2 pips.
Target 3 at 1.12564, which is 109.8 pips.
Read the stop line again. It says TRAILING STOP, not STOP LOSS.
That word change means the level has left where it started. It has come in from 1.14028 to 1.13806, which cuts the risk on this position from 36.6 pips to 14.4. More than half the original exposure has been taken off the table, and the trade did not need you to do it.
Price is currently near 1.13574, about 8.8 pips in profit from the entry.
So this is a trade that has banked one target, cut its own risk by more than half, and is now sitting in a small profit while the shorter charts rally against it. That last part is the interesting bit.
Look at the right side of the chart. Price has pushed up off the lows over the last day. On the four hour that is a pullback inside a downtrend that has been running since early September, from above 1.1650 down to the mid 1.13s. The dashed red channel above price has stepped down the whole way.
The ticket is intact. The pullback is the reason three other charts are currently showing up.
Why H1, M30 and M15 Have No Ticket
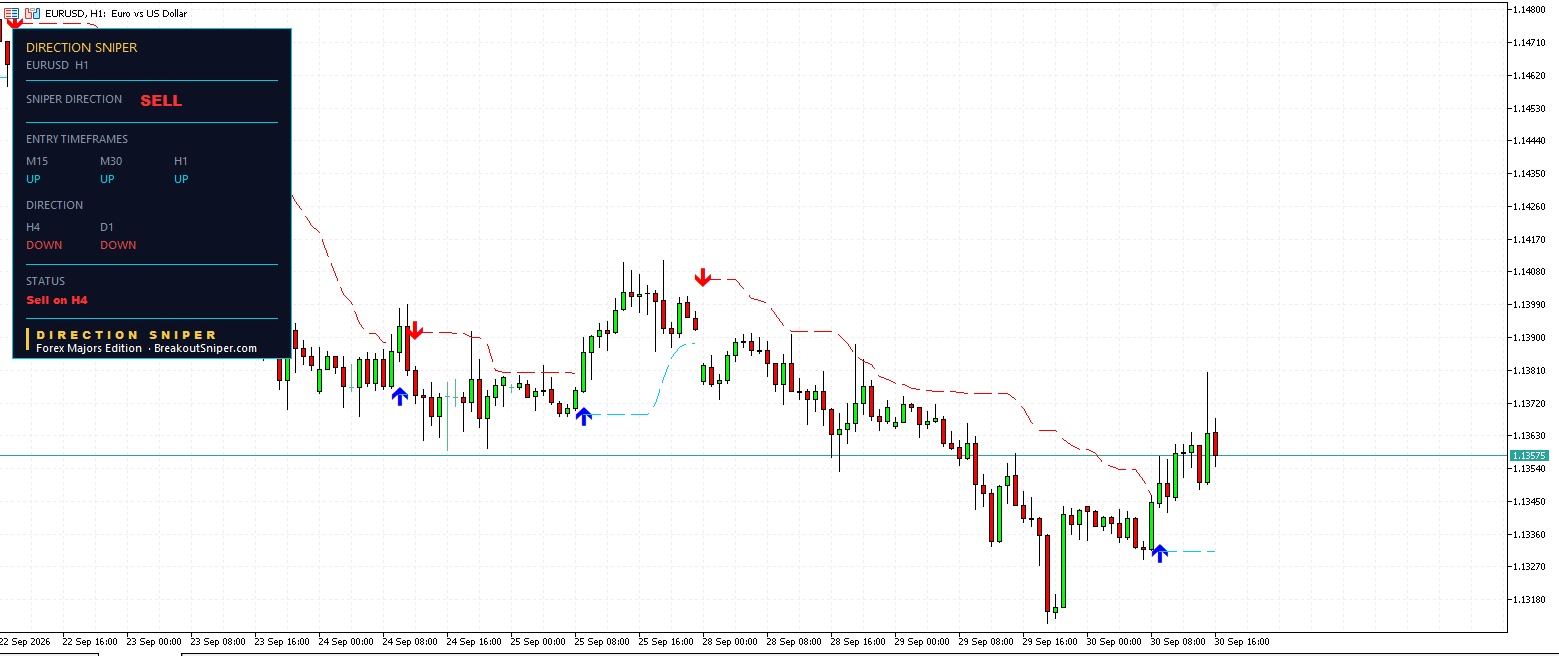
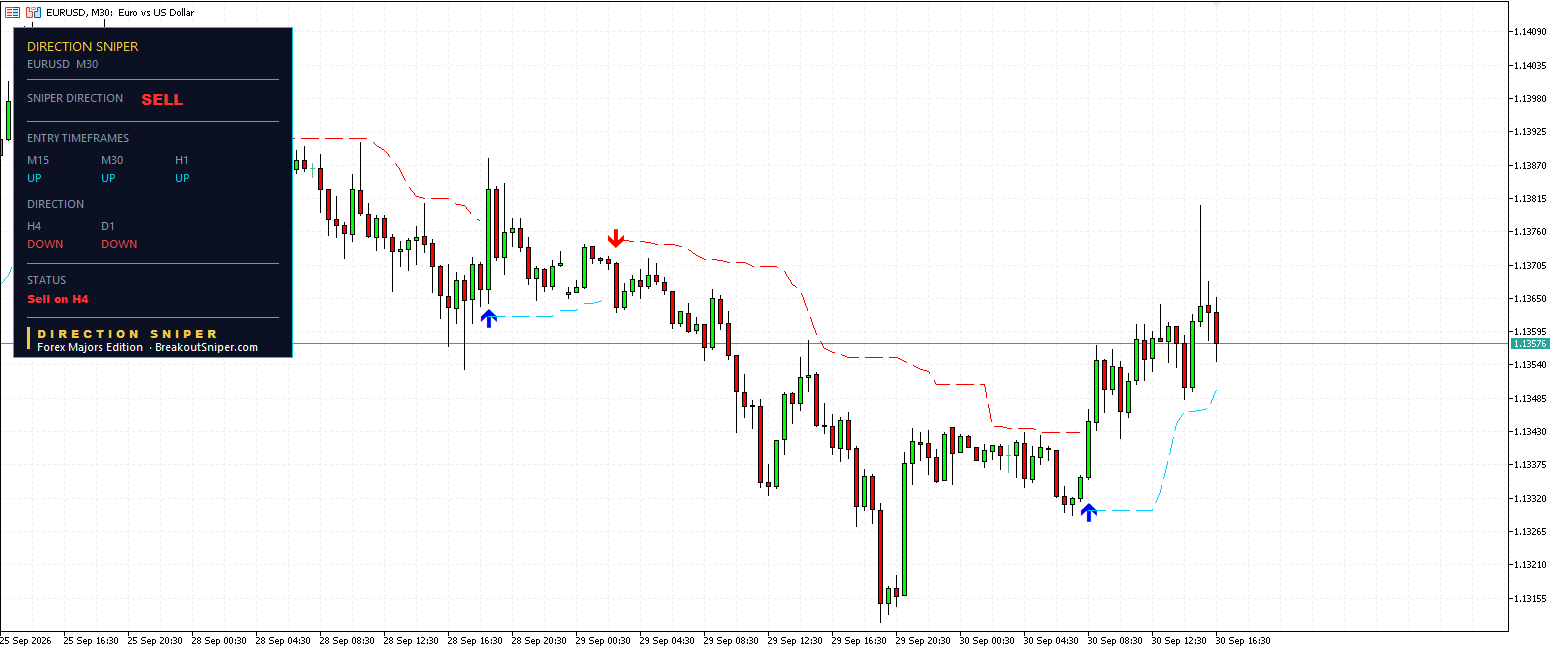
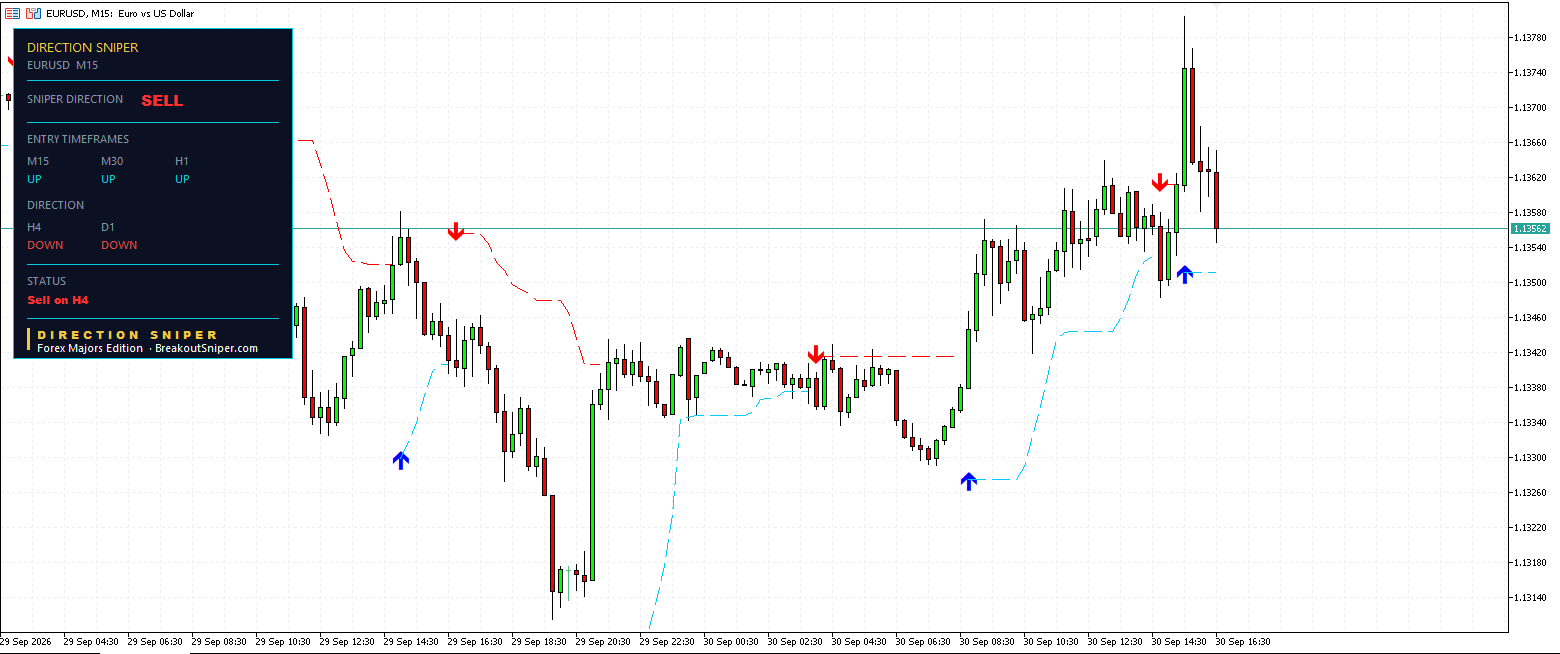
Look at those three panels carefully. Each one has a verdict at the top in red. SELL.
And then nothing.
No entry price. No stop. No targets. The ticket area is empty on all three.
Here is why. Every one of them reads M15 UP, M30 UP, H1 UP. All three disagree with the verdict, so none of them was allowed to build a ticket.
Not a weaker ticket. Not a ticket with a caution attached. Nothing at all.
This is the entire method, working in front of you, on three charts at once.
Think about what a trader without this structure sees this morning. The euro has rallied off the lows. The fifteen minute looks like a bottom forming. The thirty minute agrees. The one hour agrees. Three independent charts, all pointing up, all telling the same story.
And every one of those signals is sitting underneath a daily and a four hour that are still falling, inside a downtrend that has been running for three weeks.
The panel did not need to be clever to avoid that. It asked the questions in the right order. Permission first, timing second. Because the gatekeepers said sell, the buy signals underneath were never eligible to speak.
Three charts produced nothing today. That is not the tool failing. That is the tool doing the single most valuable thing it does.
The Same Morning, A Different Pair
Here is something worth seeing side by side.
This morning on AUD USD, every one of the five timeframes agreed. Daily, four hour, one hour, thirty minute and fifteen minute, all selling. Four separate tickets, two of them already reaching all three targets.
This morning on EUR USD, the two gatekeepers agree and every entry chart disagrees. One ticket, three refusals.
Same tool. Same rules. Same moment in time. Two completely different answers.
That is what a system does that an opinion cannot. It is not deciding that the euro is weak and the Aussie is weak and therefore both should be sold. It is reading each pair on its own terms and reporting what each one currently permits.
One pair is offering you four ways in. The other is offering you one, and telling you plainly to leave the other three alone.
Where the Next Trade Comes From
The gatekeepers are unlikely to turn quickly. Daily and four hour trends do not reverse in a session, and this one has been falling for three weeks.
So the next EUR USD ticket comes from M15, M30 and H1, and only when they finish rallying and turn back down.
Here is the sequence to watch.
Right now all three are up, inside a pullback against the larger downtrend. That pullback either runs out of steam or it does not. When it runs out, the shorter charts flip back to selling pressure, they agree with a verdict that is already in place, and tickets build automatically.
The fifteen minute usually turns first because it reacts fastest. The thirty minute confirms. The one hour follows. When all three rows go red while H4 and D1 are still red, you have the full alignment that AUD USD is showing today.
So the watchlist is short.
Watch the M15 row. When it turns from UP to DOWN, the next entry is close.
Watch the H4 ticket. Target 2 sits at 1.12930, another 64 pips below current price, and the trailing stop at 1.13806 is protecting most of what the trade has made.
Until then there is nothing to chase. One trade is working and three charts have been told to wait.
The Method in Brief
Five steps, the same every day, on every pair.
One. The daily and four hour decide direction. They grant permission or refuse it.
Two. Once a verdict exists, every shorter timeframe hunts only in that direction.
Three. When an entry timeframe agrees, the panel builds a complete ticket: entry, stop, and three targets at one, two and three times the risk.
Four. Size the position from the ticket’s own risk number, not from the timeframe.
Five. When the label changes to TRAILING STOP, the trade has passed its starting risk and the level manages itself from there.
That is the entire system. There is nothing else to learn.
Get the Same Panel on Your Charts
Everything in this post came off four screenshots, and every number on them was generated automatically.
The verdict. The permission rows. One entry price. One stop that has already moved itself from 1.14028 to 1.13806 without anyone touching it. Three targets calculated from the risk. And three charts where the tool looked at a rising market and issued nothing at all.
No lines drawn by hand. No indicators stacked on top of each other. No waiting for someone to publish an analysis before you know what the euro is doing.
You are reading this after the fact. Direction Sniper puts the same panel on your own MetaTrader charts, live, while the market is still moving, on EUR USD and on every other pair you follow.
One more thing, because it matters more than any feature.
Tickets get stopped out. The H4 trade above may well be one of them, and the trailing stop at 1.13806 is only 14.4 pips above where it entered. When that happens you will see it on this site with the same numbers and the same honesty as the targets reported today, because a record with no losses in it is not a record, it is marketing.
The reason a stop sits on every ticket is that some of them will be hit. That is the deal, and any tool that pretends otherwise is selling you something that does not exist.
Trading involves risk. Past performance does not guarantee future results. This post illustrates how the Direction Sniper indicator displays trades and is not a recommendation to trade. Nothing here is financial advice.

