AUD USD Forecast Today, 2 October 2026: Why Sell Into Strength?
EXECUTIVE SUMMARY
Verdict: SELL
The daily and four hour are both still selling. All three entry timeframes have turned up, so no new tickets have been built.
Open and Closed Tickets
| Timeframe | Direction | Entry | Stop | Targets | Status |
|---|---|---|---|---|---|
| H4 | SELL | 0.71111 | 0.71343 | 3 of 3 | All targets reached |
| H1 | SELL | No ticket | Waiting for alignment | ||
| M30 | SELL | No ticket | Waiting for alignment | ||
| M15 | SELL | No ticket | Waiting for alignment |
What the Panel Says
Sells only. The daily and four hour have not moved.
The H4 ticket is finished. It entered at 0.71111 with 23.2 pips of risk and reached all three targets. Price is now around 0.69407, which is 170 pips below that entry and 100 pips below Target 3.
M15, M30 and H1 have all turned up this morning. None of them has produced a ticket, because up disagrees with the verdict.
The Aussie is rallying. The structure has not changed.
This is what the indicator is showing, not a recommendation. Trading involves risk.
New to these reads? Here is how the panel works, explained step by step: How to Read the AUD USD Panel
The Aussie Went Up This Morning. That Is Not the Same as Going Up.
Open the fifteen minute chart and the Australian dollar looks like it has turned. Price has lifted off the lows, the candles are green, and the thirty minute and one hour agree with it.
Three charts, all up, all at once.
Now open the daily or the four hour. Both are still selling, and they have been since early September, when the pair traded above 0.7230 and began a decline that has taken it to 0.6940.
So you have a rally inside a downtrend that has run for a month and has not shown any sign of ending.
This is the moment where most traders lose money on this pair, and they do not lose it by being stupid. They lose it by being right about the last four hours and wrong about the last four weeks.
Permission First
H4: DOWN. D1: DOWN.
Both gatekeepers still selling. Verdict unchanged. SELL.
M15: UP. M30: UP. H1: UP.
Every entry chart is pointing the other way.
The status line reads Sell on H4, which refers to the completed ticket. No new tickets exist, because no entry timeframe currently agrees with the direction above it.
That split is what a counter trend rally looks like on a panel. The big charts have not moved. The small charts have.
The H4 Ticket That Just Finished
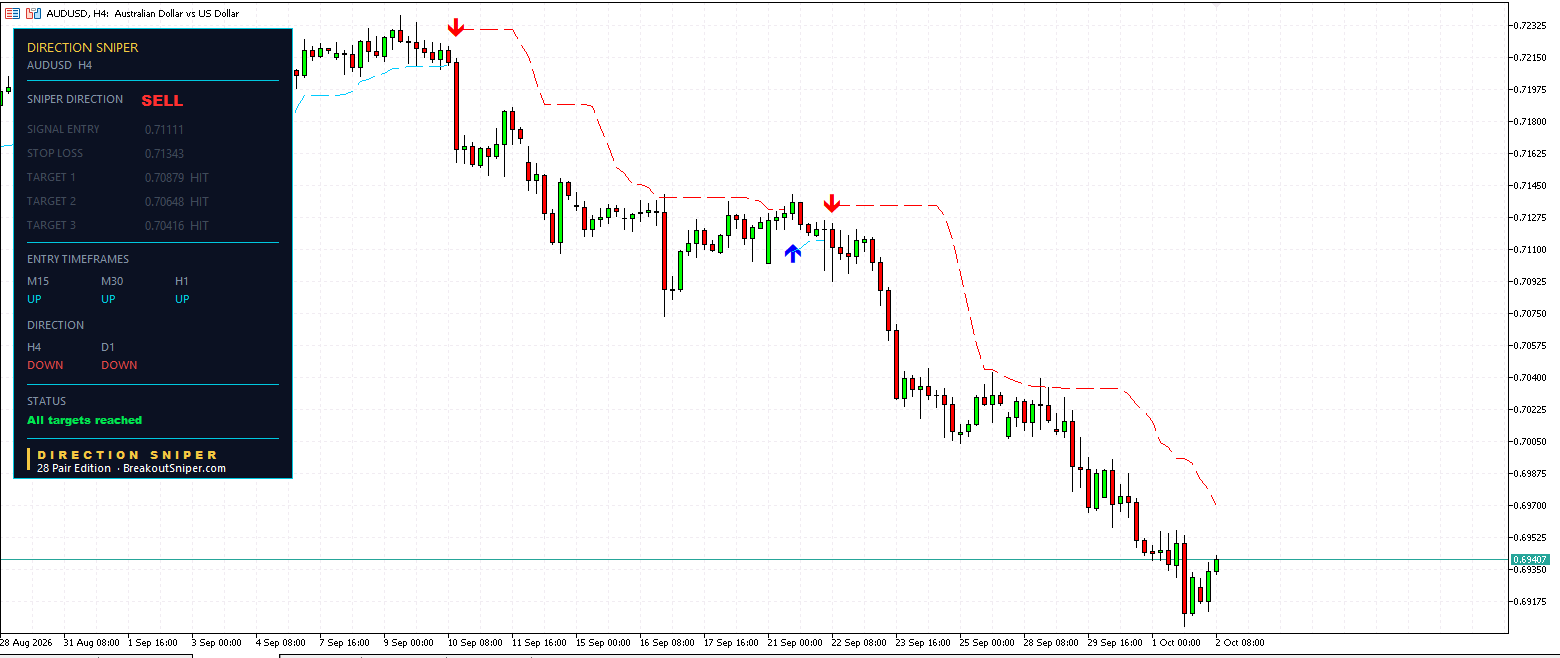
Before anything else, look at what the verdict produced.
Signal entry 0.71111. Stop loss 0.71343.
Risk of 23.2 pips.
Target 1 at 0.70879, hit.
Target 2 at 0.70648, hit.
Target 3 at 0.70416, hit.
All targets reached.
And price did not stop there. It is currently around 0.69407, which is a further 100 pips below Target 3 and 170 pips below the entry.
That matters this morning for one specific reason. The downtrend that the fifteen minute is currently arguing with has already paid out a complete ticket and then kept running. It is not a theory. It is the thing that produced the only closed trade on this page.
A rally of thirty or forty pips inside a move of that size is not a reversal. It is a pause.
Why No Ticket on H1, M30 or M15
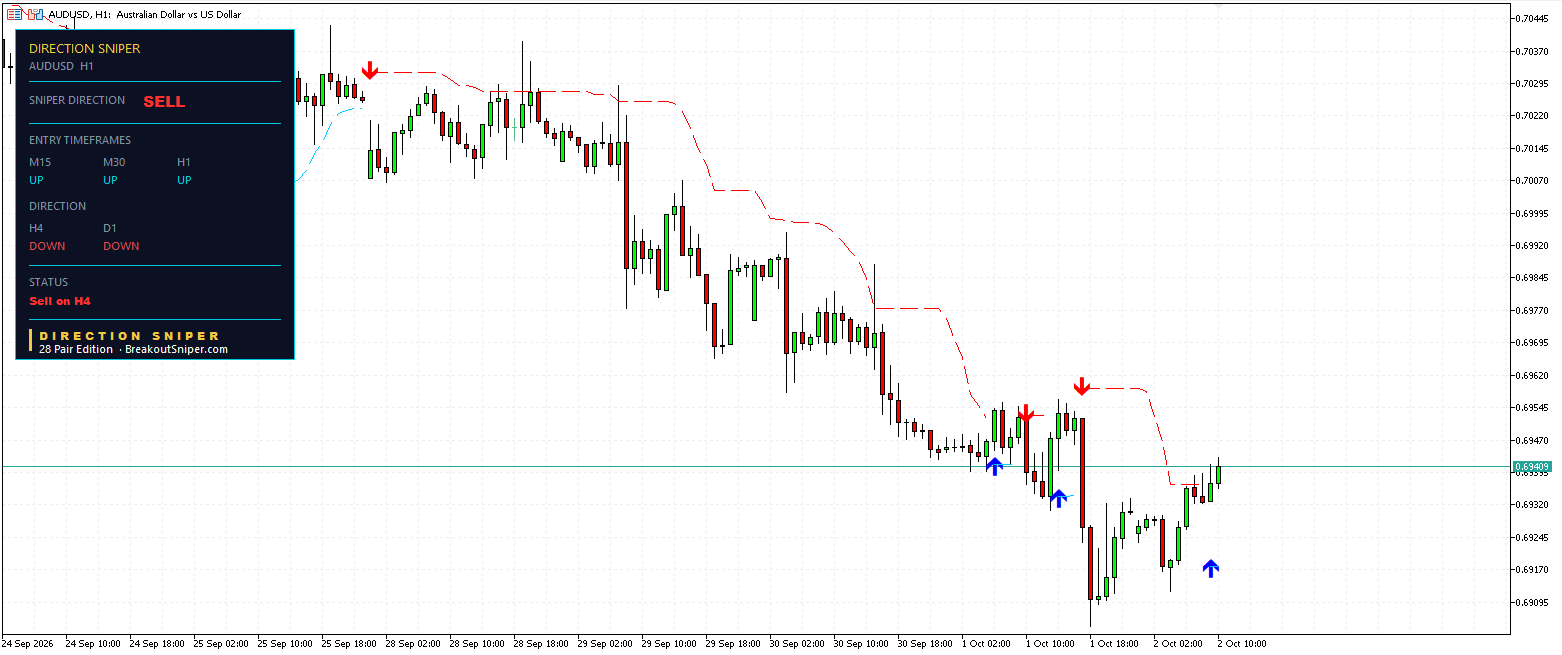
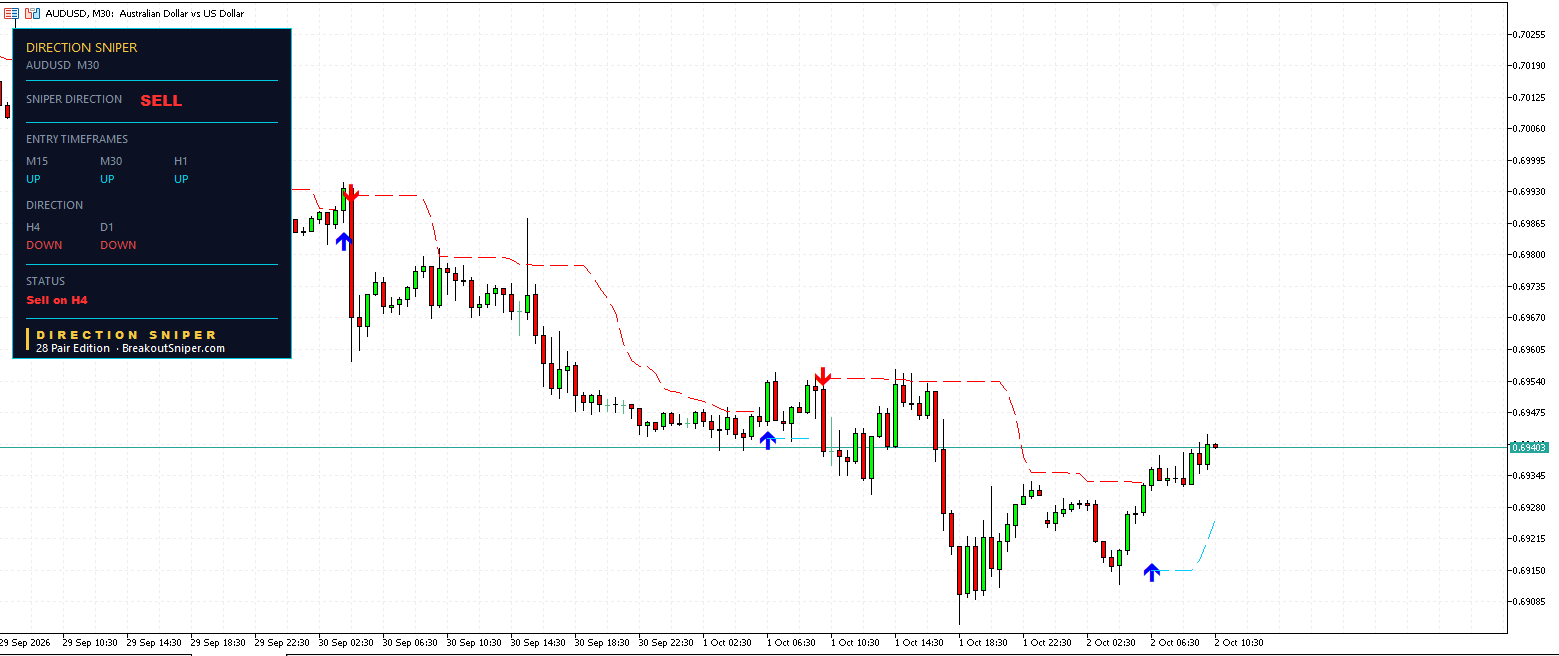
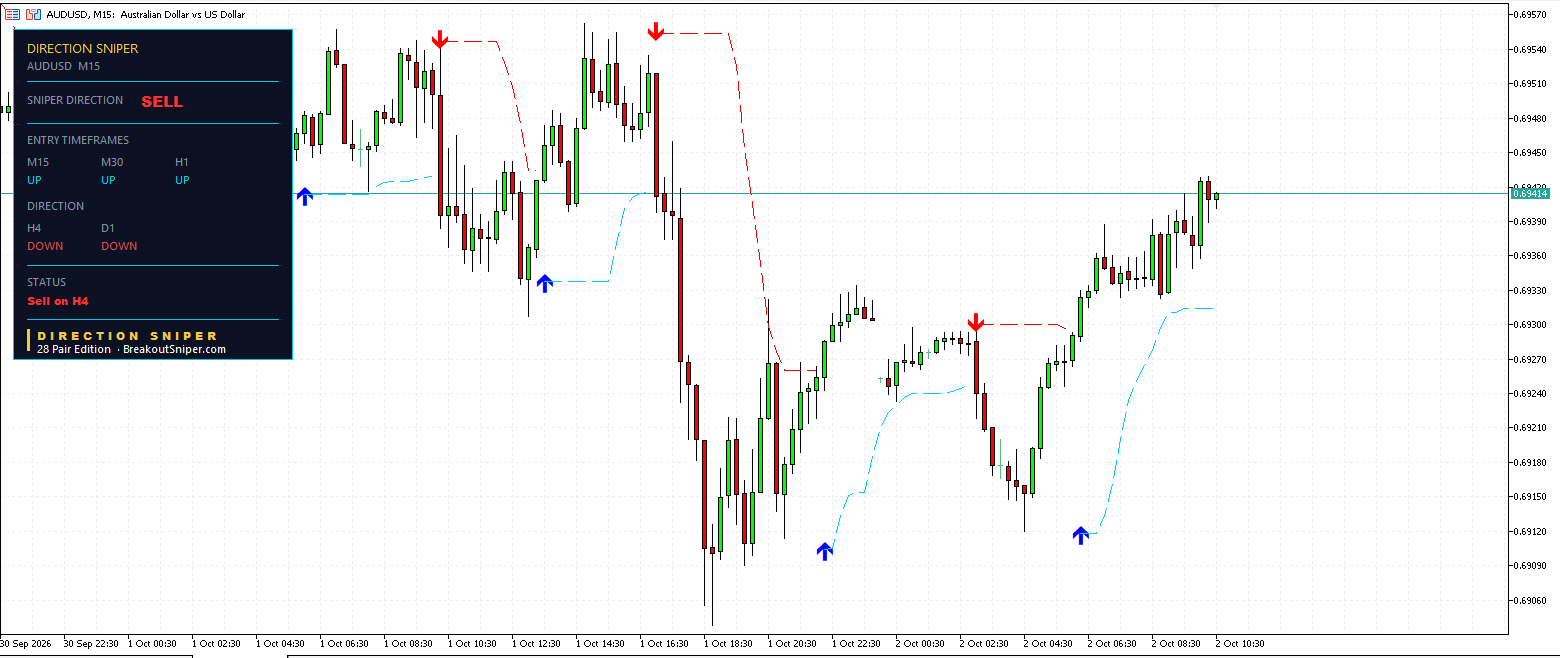
Three panels. Three verdicts in red at the top saying SELL. And nothing underneath on any of them.
No entry. No stop. No targets.
Here is why. Every one of those charts reads M15 UP, M30 UP, H1 UP. All three disagree with the verdict, so none was allowed to build a ticket.
Now think carefully about what did not happen.
The panel did not flip to BUY because three short charts turned up. It did not issue a cautious long. It did not produce a smaller ticket in the other direction.
It simply withheld everything and waited.
A trader watching only the fifteen minute this morning has three independent charts telling them the Aussie is rising. Every short term tool they own agrees. And every one of those signals is happening inside a month long decline that has not broken a single thing.
Why You Sell Into Strength Instead of Buying It
This is the part worth keeping, and it applies to every market, not just this one.
When a market is in a downtrend, a rally is not a reason to buy. It is a better price to sell.
That sounds obvious written down. In practice almost nobody does it, for a simple reason. Buying a rally feels like joining something that is working. Selling into a rally feels like standing in front of it.
But look at what each one actually is.
Buying the rally means taking a long position against a daily and four hour that are both selling, hoping that this particular bounce is the one that turns the trend. You are betting on an exception.
Selling into the rally means taking a short in the direction the larger charts have been pointing for a month, at a price better than the one available yesterday. You are betting on the rule.
The rally is not your enemy. It is the discount.
The hard part is timing, not direction
Knowing you want to sell is easy once the gatekeepers tell you. Knowing when is the problem, and this is exactly what the entry timeframes are for.
While M15, M30 and H1 are up, the rally is still running and selling into it means catching a falling knife in reverse. When those three turn back down, the rally has run out and the panel builds the ticket.
So the sequence is: the verdict tells you what side you are on, the rally gives you a better price, and the entry timeframes tell you when the better price has stopped getting better.
Right now you are in the middle step. The verdict is set, the price is improving, and the timing has not arrived.
What Would Change the Answer
Here is what to watch, in order.
The last swing high is around 0.6954, from yesterday. A downtrend is made of lower highs and lower lows. While price fails below that level, the lower highs are intact and this is a pullback inside a downtrend.
If price breaks above 0.6954, the structure has been challenged but not broken. One break can be a squeeze. What would confirm a change is price then holding a higher low rather than immediately rolling over.
If both happen, the four hour would start reading up, and once the daily follows, the verdict flips to BUY and the whole panel inverts. At that point you stop selling into strength and start buying weakness, because the rule has changed.
Nothing on that list is a prediction. It is a level and a condition, and you watch which arrives first.
The Same Morning, The Opposite Pair
Here is something worth seeing side by side.
Today on USD JPY the panel shows the exact inverse of this page. The daily and four hour are both buying, and M15, M30 and H1 have all turned down. One ticket from the H4, nothing from the shorter charts, and a market pulling back inside an uptrend.
Today on AUD USD the daily and four hour are both selling, and M15, M30 and H1 have all turned up. One completed ticket from the H4, nothing from the shorter charts, and a market rallying inside a downtrend.
Same tool. Same hour. Mirror image.
On the yen the lesson is do not sell the dip. Here it is do not buy the rally. Both come from the same rule applied to opposite trends, which is what makes it a rule rather than an opinion.
Where the Next Trade Comes From
The gatekeepers are not going to turn quickly. A month long decline on the daily does not reverse because the fifteen minute had a good morning.
So the next AUD USD ticket comes from M15, M30 and H1, and only when they finish rallying and turn back down.
The fifteen minute usually turns first, because it reacts fastest. The thirty minute confirms. The one hour follows. When all three rows go red while H4 and D1 are still red, the panel builds the ticket automatically and you are selling at a better price than yesterday’s.
So the watchlist is short.
Watch the M15 row. When it turns from UP to DOWN, the next entry is close.
Watch 0.6954. While price stays under it, nothing about the plan has changed.
Until then there is nothing to do, and nothing to chase. The last ticket paid out in full and the next one has not arrived.
The Method in Brief
Five steps, the same every day, on every market.
One. The daily and four hour decide direction. They grant permission or they withhold it.
Two. Once a verdict exists, every shorter timeframe hunts only in that direction.
Three. When an entry timeframe agrees, the panel builds a complete ticket: entry, stop, and three targets at one, two and three times the risk.
Four. Size the position from the ticket’s own risk number, not from the timeframe.
Five. When the label changes to TRAILING STOP, the trade has passed its starting risk and the level manages itself from there.
That is the entire system. There is nothing else to learn.
Get the Same Panel on Your Charts
Everything on this page came off four screenshots, and every number on them was generated automatically.
A completed ticket with three targets reached. Three charts showing a verdict and issuing nothing underneath it. And a status line telling you exactly which timeframes currently hold permission.
No lines drawn by hand. No deciding in advance that the Aussie is weak and then finding a chart to agree. No flipping the view because the last two hours looked different.
You are reading this after the fact. Direction Sniper puts the same panel on your own MetaTrader charts, live, while the market is still moving, on AUD USD and on every other pair you follow.
One more thing.
The next ticket on this pair may be stopped out. The rally that is running right now may turn out to be the start of something, and the first short taken into it may be the one that fails. When that happens you will see it here with the same numbers and the same detail, because a record with no losses in it is not a record, it is marketing.
The reason a stop sits on every ticket is that some of them will be hit. That is the deal, and any tool that pretends otherwise is selling you something that does not exist.
Trading involves risk. Past performance does not guarantee future results. This post illustrates how the Direction Sniper indicator displays trades and is not a recommendation to trade. Nothing here is financial advice.

