Gold and Silver Price Forecast Today: 2 October 2026
EXECUTIVE SUMMARY
Gold: NO TRADE | Silver: SELL
Two metals, one session, opposite answers.
Gold’s gatekeepers disagree, so no direction exists and no ticket can be built on any timeframe. Silver has full agreement across all five charts and four live tickets.
Open and Closed Tickets
| Market | Timeframe | Entry | Stop | Targets | Status |
|---|---|---|---|---|---|
| Gold | All | No ticket | Stand aside | ||
| Silver | H4 | 65.474 | 61.487 trailing | 2 of 3 | Running, well in profit |
| Silver | H1 | 60.452 | 61.205 trailing | 0 of 3 | Running, against entry |
| Silver | M30 | 60.560 | 61.190 | 0 of 3 | Running, against entry |
| Silver | M15 | 60.794 | 60.960 trailing | 1 of 3 | Running, against entry |
What the Panel Says
Gold is closed for business today. The four hour is up, the daily is down, and when the two gatekeepers disagree there is no verdict to trade on. The status line says Stand aside.
Silver is in a sell only regime with all five timeframes aligned.
Three of the four silver tickets are currently sitting against their entry prices. One of them, the H1, has its stop 0.287 above the current price.
Only the H4 is comfortably ahead, and that one has been running long enough that its stop sits 3.987 below where it entered.
This is what the indicator is showing, not a recommendation. Trading involves risk.
GET DIRECTION SNIPER GOLD AND SILVER EDITION
New to these reads? Here is how the panel works, explained step by step: How to Read the Direction Sniper Panel
Gold: The Most Useful Reading the Panel Produces
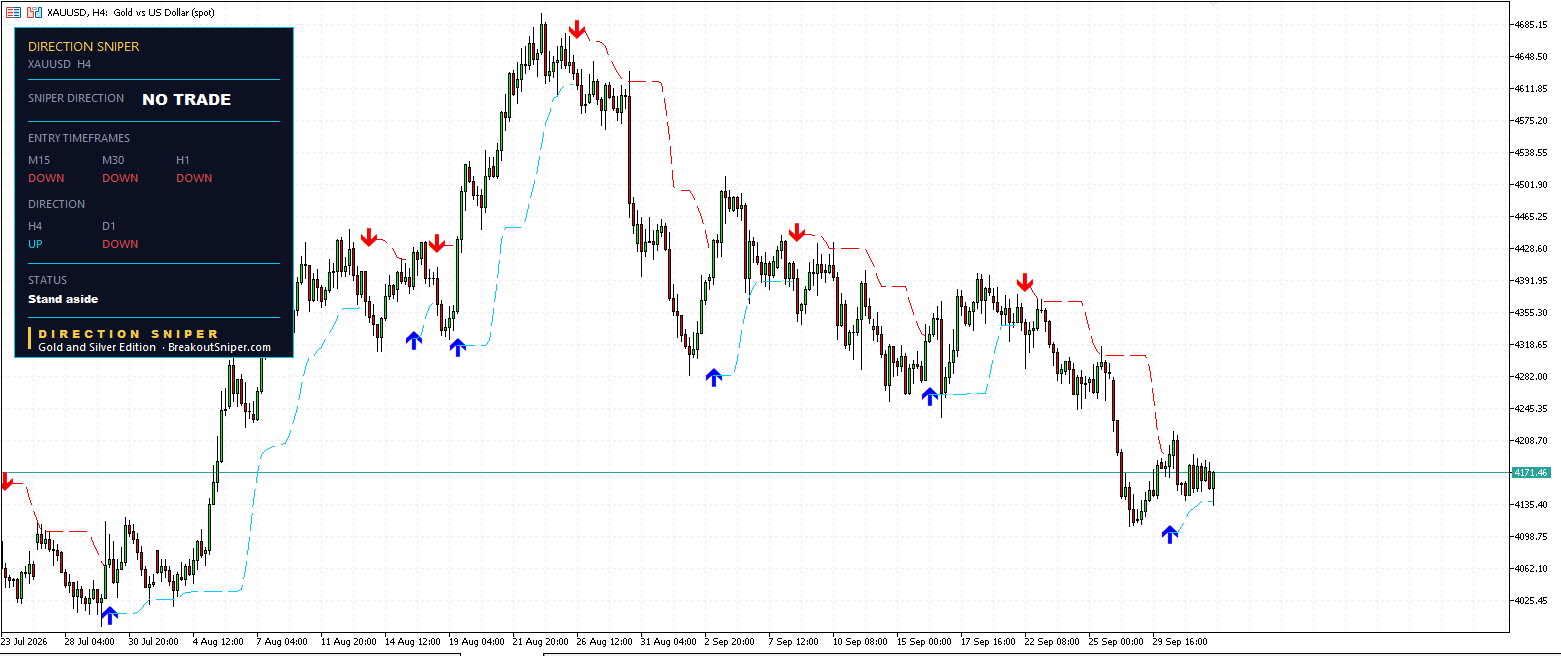
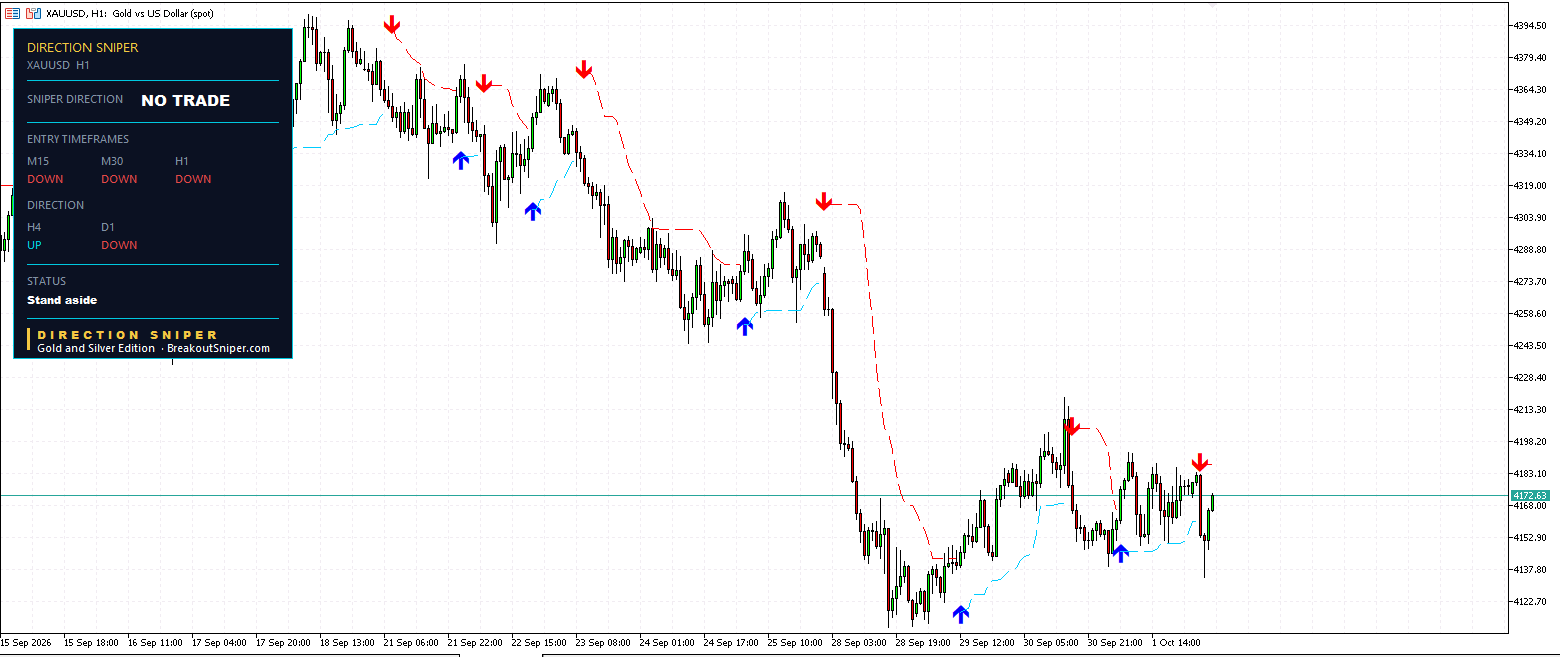
Look at the top line on both gold panels.
NO TRADE.
Not buy. Not sell. Not a weak signal in either direction. Nothing.
Here is why. Read the two gatekeeper rows.
H4: UP. D1: DOWN.
The four hour and the daily disagree. One is showing buying pressure, the other selling pressure, and when that happens no direction has been established. The panel refuses to pick a side and the status line says Stand aside.
Now Look at the Row Above It
M15: DOWN. M30: DOWN. H1: DOWN.
All three entry timeframes agree with each other. All three are selling. On any other day that would be full agreement on the short side.
And it makes no difference whatsoever.
This is the single most important thing the tool does, and most traders will never build it for themselves.
Three charts pointing the same way feels like confirmation. It feels like three independent opinions arriving at the same conclusion. A trader looking only at the fifteen minute, thirty minute and one hour this morning would see unanimous agreement and take the trade with confidence.
But those three charts were never asked. The question that governs them was answered upstairs and the answer was that there is no answer yet.
Agreement between entry timeframes is worth nothing without permission above them. That is the hierarchy, and today gold is showing it in the clearest way possible.
What NO TRADE Actually Means
When the daily and the four hour disagree, gold is usually chopping inside a range rather than trending. Look at the gold charts and you can see it. Price has been grinding between roughly 4120 and 4215 for the last week with no resolution.
A range is where entry signals fire most often and fail most often. The fifteen minute will keep producing clean looking breakouts and the market will keep taking them back.
So the panel does the one thing that protects an account in that environment. It gives you nothing.
Both gold panels have been showing this all session. Every chart you open on gold says the same thing, which is itself worth noting. The verdict does not change depending on which chart the panel happens to sit on.
The correct number of gold trades today is zero. That is not a disappointing result. That is the result.
Silver: Permission Granted
Now switch metals and read the same rows.
H4: DOWN. D1: DOWN.
Both gatekeepers agree. Verdict is SELL.
M15: DOWN. M30: DOWN. H1: DOWN.
Every entry chart is aligned with it. Full agreement across all five timeframes, which is the cleanest state the panel produces.
Status line on every silver chart: Sell on M15, M30, H1, H4.
Four tickets. And this is where today gets honest.
Silver H4 Trade Ticket
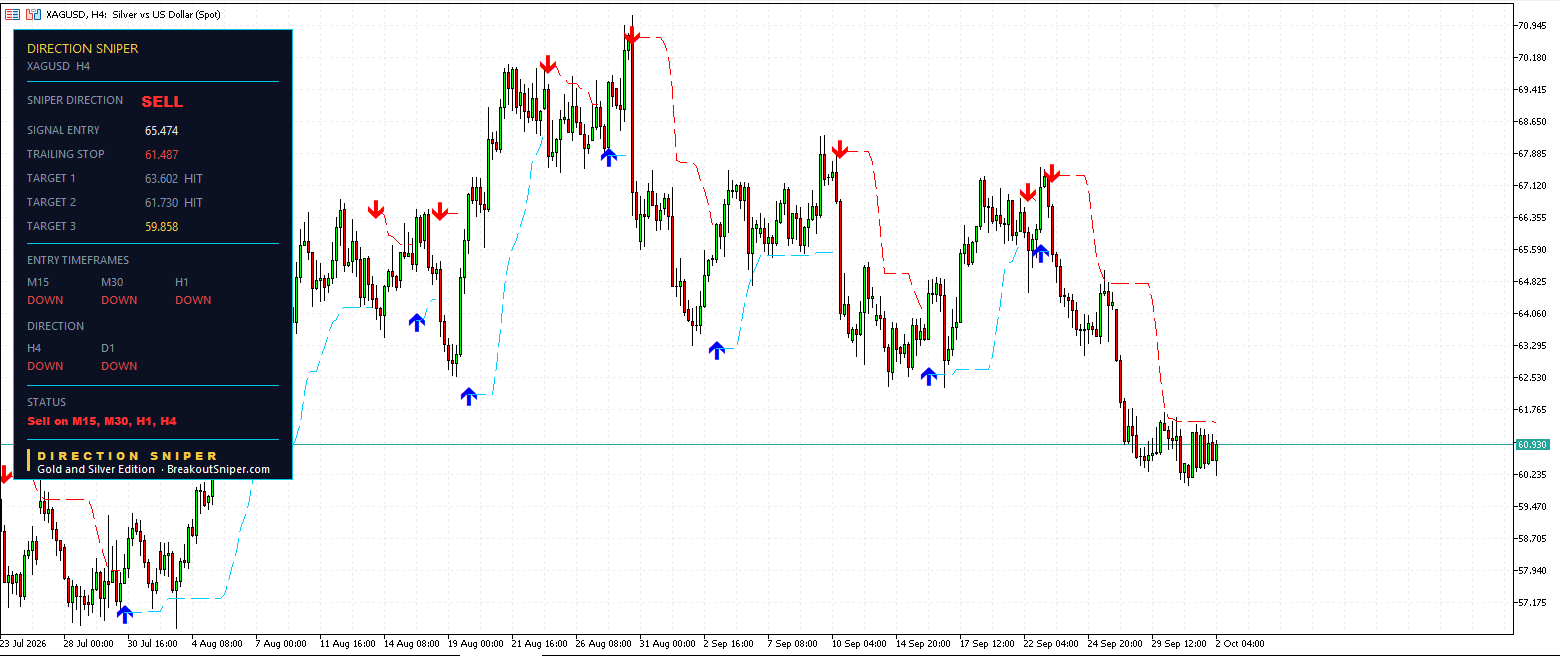
Signal entry 65.474. Trailing stop 61.487.
Target 1 at 63.602, hit.
Target 2 at 61.730, hit.
Target 3 at 59.858, still ahead.
Risk at entry was 1.872, which puts the original stop at 67.346.
The stop now reads 61.487. That is 3.987 below the entry price.
This trade crossed into protected territory a long time ago and has been sitting there since. Two targets are banked and the worst outcome available to it now is a substantial gain.
Price is around 60.930, roughly 4.544 below the entry. Target 3 sits 1.072 further down.
That is the trade everyone wants to screenshot. Now look at the other three.
Silver H1 Trade Ticket
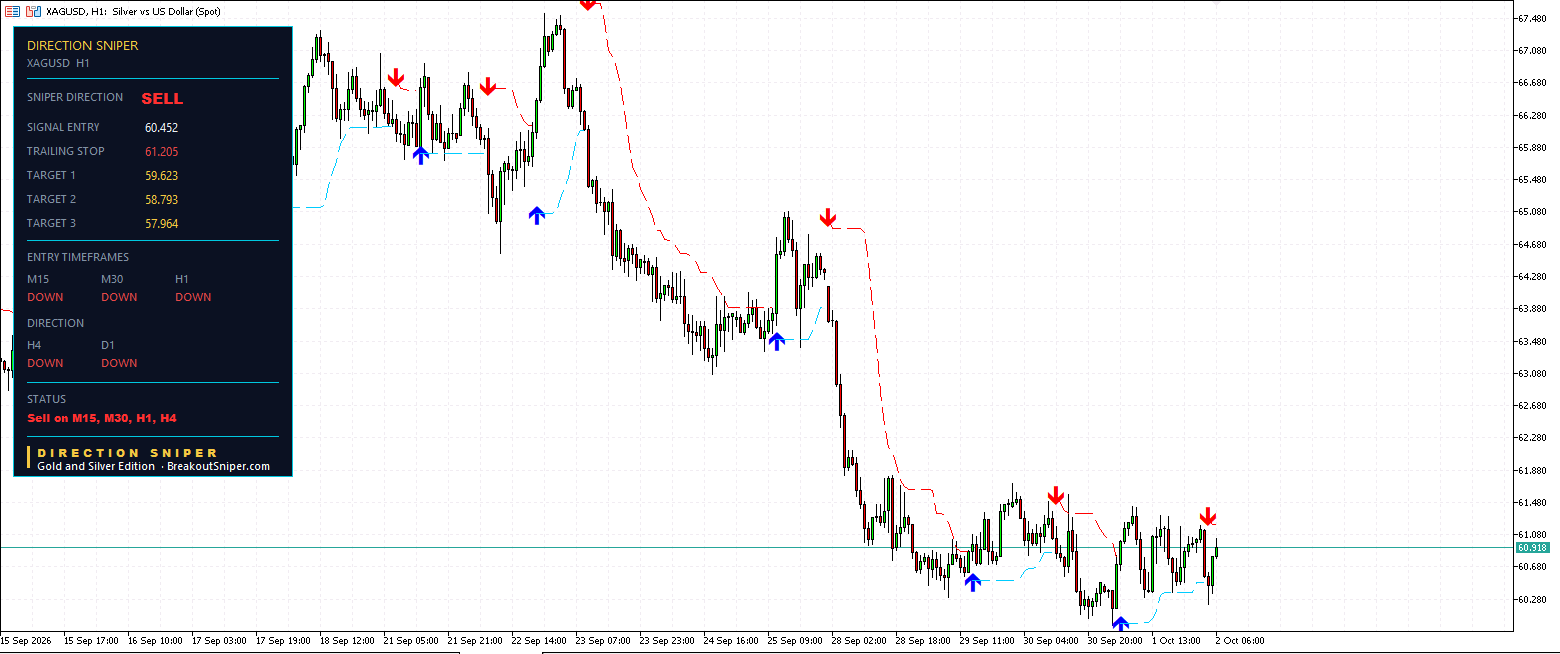
Signal entry 60.452. Trailing stop 61.205.
Target 1 at 59.623, which is 0.829 away.
Target 2 at 58.793.
Target 3 at 57.964.
No targets reached.
Price is around 60.918, which is 0.466 above the entry. On a sell, that means this trade is currently losing.
Risk at entry was 0.829, putting the original stop at 61.281. It has trailed slightly to 61.205, which leaves the stop just 0.287 above where price is trading right now.
So this one is close. If silver keeps pushing up through the next hour, that stop gets hit and the trade closes for a loss of roughly 0.75 from entry.
I am telling you that while it is still unresolved rather than editing it out tomorrow.
Silver M30 Trade Ticket
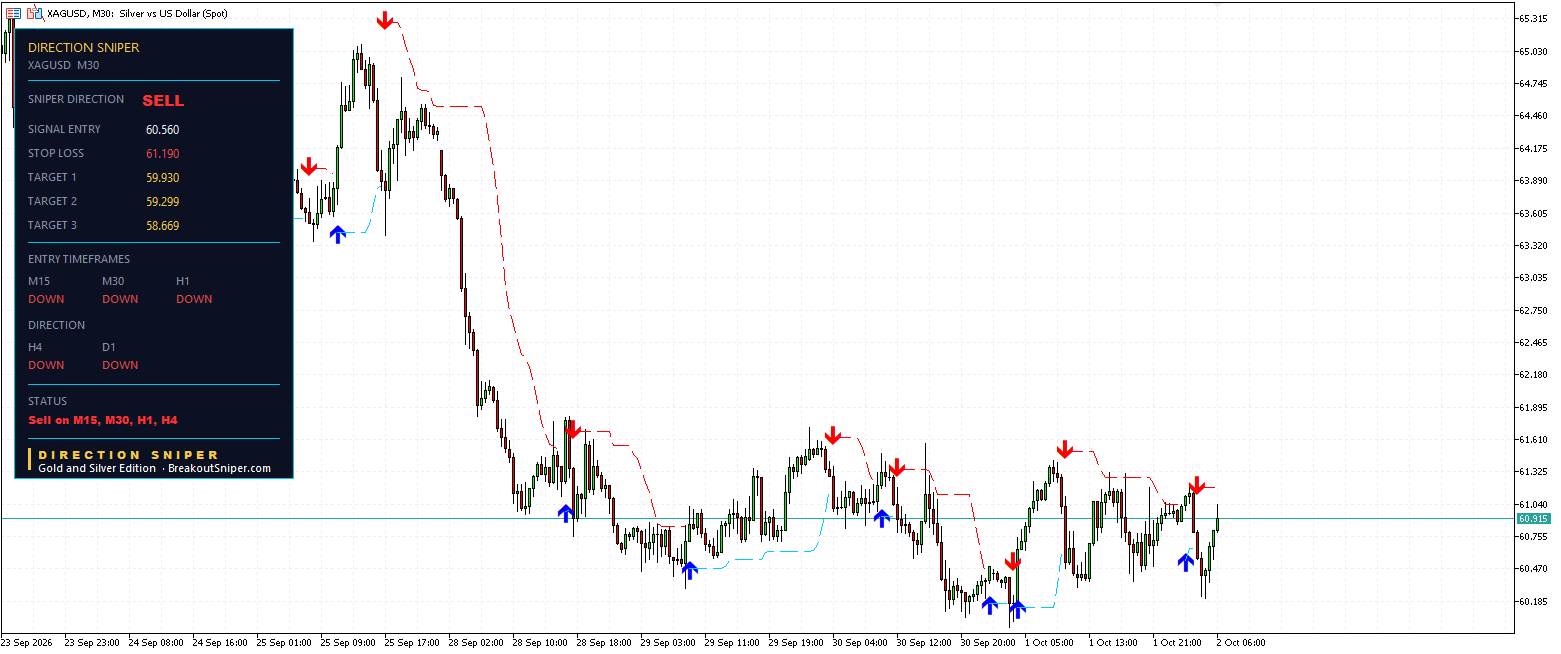
Signal entry 60.560. Stop loss 61.190.
Target 1 at 59.930. Target 2 at 59.299. Target 3 at 58.669.
No targets reached, and notice the label.
It says STOP LOSS, not TRAILING STOP. The level is exactly 0.630 above the entry, which is precisely where it started.
That tells you something without any calculation. This trade has never moved far enough in its favour for the stop to earn a trail. Full original risk is still on the table.
Price is around 60.815, so this one is 0.255 against the entry.
The panel is not pretending otherwise. The word on the stop line is doing its job.
Silver M15 Trade Ticket
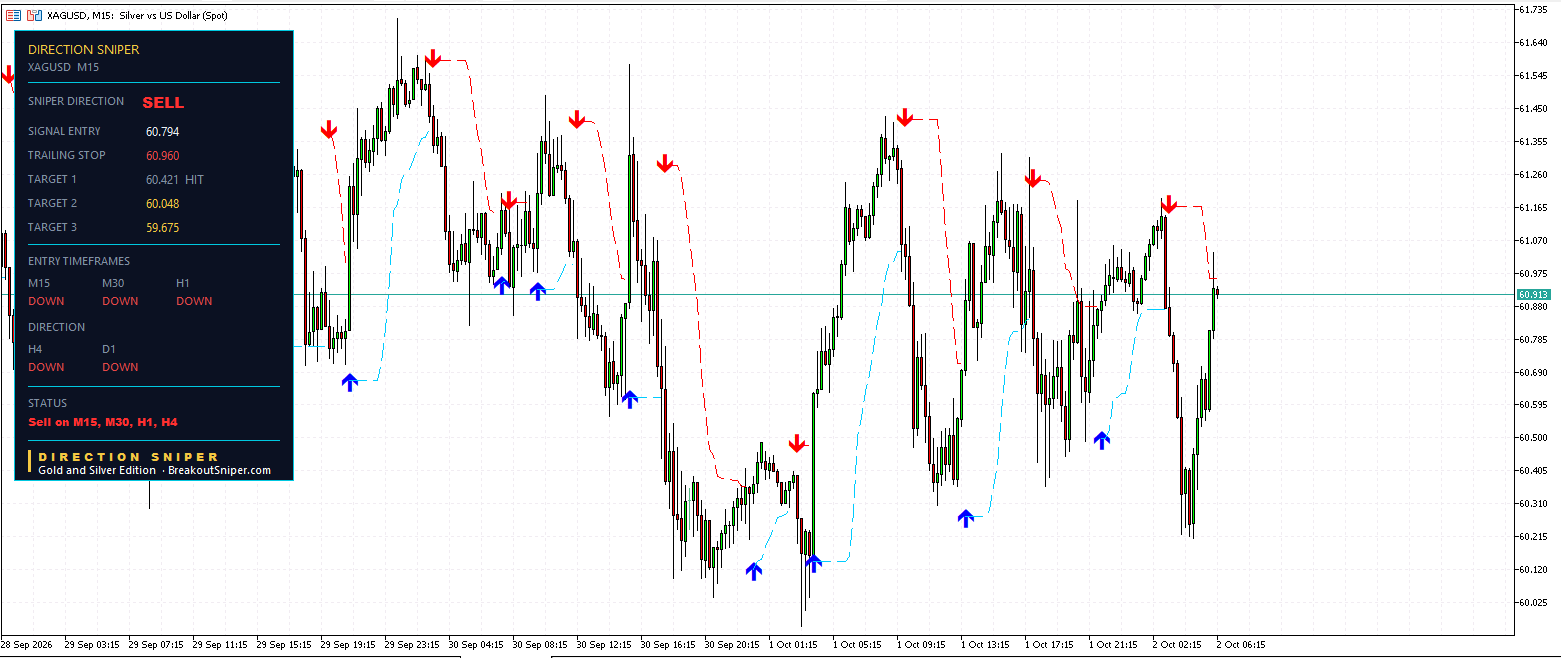
Signal entry 60.794. Trailing stop 60.960.
Target 1 at 60.421, hit.
Target 2 at 60.048.
Target 3 at 59.675.
This is the most instructive of the three.
The trade worked. It reached its first target at 60.421, which banked a third of the position at 0.373 from entry.
Then price came back. It is now around 60.913, which is 0.119 above the entry.
The stop has trailed from 61.167 to 60.960, so the remaining two thirds are protected within 0.166 of the entry rather than the 0.373 the trade started with.
That is what a partially successful trade looks like while it is still open. One target banked, the rest at risk of closing near where it began.
What the Middle of a Trade Actually Looks Like
Every silver timeframe agrees. Permission is granted. Four tickets are live.
And right now three of them are sitting behind their entry prices.
I am putting that in the post rather than leaving it out, because this is the state most trades spend most of their life in, and it is the state nobody screenshots.
Alignment is about direction, not about profit. All five charts agreeing tells you the market has committed to a direction and the entries were taken in line with it. It says nothing about what happens between the entry and the target. Silver has spent the last day moving between roughly 60.0 and 61.6 without resolving, and open trades sit inside that movement rather than above it.
Three of the four are already carrying less risk than they started with. The H4 is protected well into profit. The M15 has banked its first target and pulled its stop in to 60.960. The H1 has trailed slightly to 61.205.
One is not, and the panel says so. The M30 stop still reads STOP LOSS at 61.190, exactly where it began. That trade has not moved far enough in its favour to earn a trail, and the label tells you that without any calculation.
The H1 is the one to watch. Its stop sits 0.287 above where silver is trading. If the metal pushes up from here, that trade closes out. You are reading this while that is still an open question, not after it was quietly dropped from a future post.
Yesterday on the euro I reported eight targets reached. Today on silver I am reporting three positions behind and one close to its stop.
Same system. Same rules. Same week.
Neither day proves anything on its own, and that is the point. A tool is not judged by the day you choose to show someone. It is judged by what the record looks like when you show all of them.
Gold and Silver Are Not the Same Trade
This is worth more than any single ticket on this page.
A great many traders hold gold and silver as one position. Both are precious metals, both trade against the dollar, both tend to move together, and so it feels like one bet expressed two ways.
Today the panel disagrees with that completely.
Gold: gatekeepers split, no verdict, stand aside.
Silver: gatekeepers aligned, sell only, four tickets.
Same session. Same asset class. Same tool. Two different answers.
If you were trading these as one position today, you were taking a silver trade and calling it a metals trade. And if you had used the gold chart to justify a silver entry, or the other way around, you would have been reading the wrong market.
Check each one on its own terms. That is the whole lesson, and it took one screenshot of each to show it.
Where the Next Trade Comes From
On gold, the next ticket cannot come from any entry timeframe. It comes from the four hour and the daily agreeing again. Either the H4 turns back down to join the daily, which produces a sell regime, or the daily turns up to join the four hour, which produces a buy regime. Until one of those happens the panel will keep saying stand aside no matter what the shorter charts do.
Watch the H4 row. It is the one that moved.
On silver, the verdict is settled and the next decisions are exits, not entries. Does the H1 reach its stop at 61.205 or turn back down toward 59.623. Does the M30 earn a trail. Does the M15 hold its remaining two thirds.
Nothing needs chasing on either metal. One is waiting for permission and the other is waiting for its open trades to resolve.
The Method in Brief
Five steps, the same every day, on every market.
One. The daily and four hour decide direction. They grant permission or they withhold it.
Two. Once a verdict exists, every shorter timeframe hunts only in that direction.
Three. When an entry timeframe agrees, the panel builds a complete ticket: entry, stop, and three targets at one, two and three times the risk.
Four. Size the position from the ticket’s own risk number, not from the timeframe.
Five. When the label changes to TRAILING STOP, the trade has passed its starting risk and the level manages itself from there.
That is the entire system. There is nothing else to learn.
Get the Same Panel on Your Charts
Everything in this post came off six screenshots, and every number on them was generated automatically.
Two gold charts refusing to give a verdict while three entry timeframes agreed with each other. Four silver tickets, one deep in profit, one carrying its full original risk and labelled accordingly, and two in between.
No lines drawn by hand. No opinions. No deciding in advance that metals are weak and then finding charts to agree.
The Gold and Silver Edition puts this panel on your own MetaTrader charts, live, on both metals at once.
GET DIRECTION SNIPER GOLD AND SILVER EDITION
One more thing, because today makes the point better than any other day this week.
Tickets get stopped out. One of the four on this page may be stopped out before the session ends. You are reading about it now, while it is still open, rather than finding out it was quietly dropped from a future post.
The reason a stop sits on every ticket is that some of them will be hit. That is the deal, and any tool that pretends otherwise is selling you something that does not exist.
Trading involves risk. Past performance does not guarantee future results. This post illustrates how the Direction Sniper indicator displays trades and is not a recommendation to trade. Nothing here is financial advice.

