USD JPY Forecast Today, 25 September 2026: Three Majors, One Dollar Move, No Tickets
Here is the usd jpy forecast today, 25 September 2026, and it is the post that makes sense of the other two I published this morning.
EUR USD said SELL and gave no ticket. GBP USD said SELL and gave no ticket. USD JPY says BUY and gives no ticket.
Three majors. Three panels. Not one trade between them. And once you see why, you will never look at a forex watchlist the same way again.
USD JPY Forecast Today: A BUY Verdict With Every Entry Timeframe Down
The panel reads:
- Sniper Direction: BUY
- Entry timeframes: M15 DOWN, M30 DOWN, H1 DOWN
- Direction: H4 UP, D1 UP
- Status: Buy on H4
H4 and D1 both point UP, so a USD JPY buy is authorised. All three entry timeframes point DOWN, so not one of them agrees, and no ticket has been built. No entry, no stop loss, no targets.
Dollar yen is trading at 157.875.
The Rally That Got Us Here
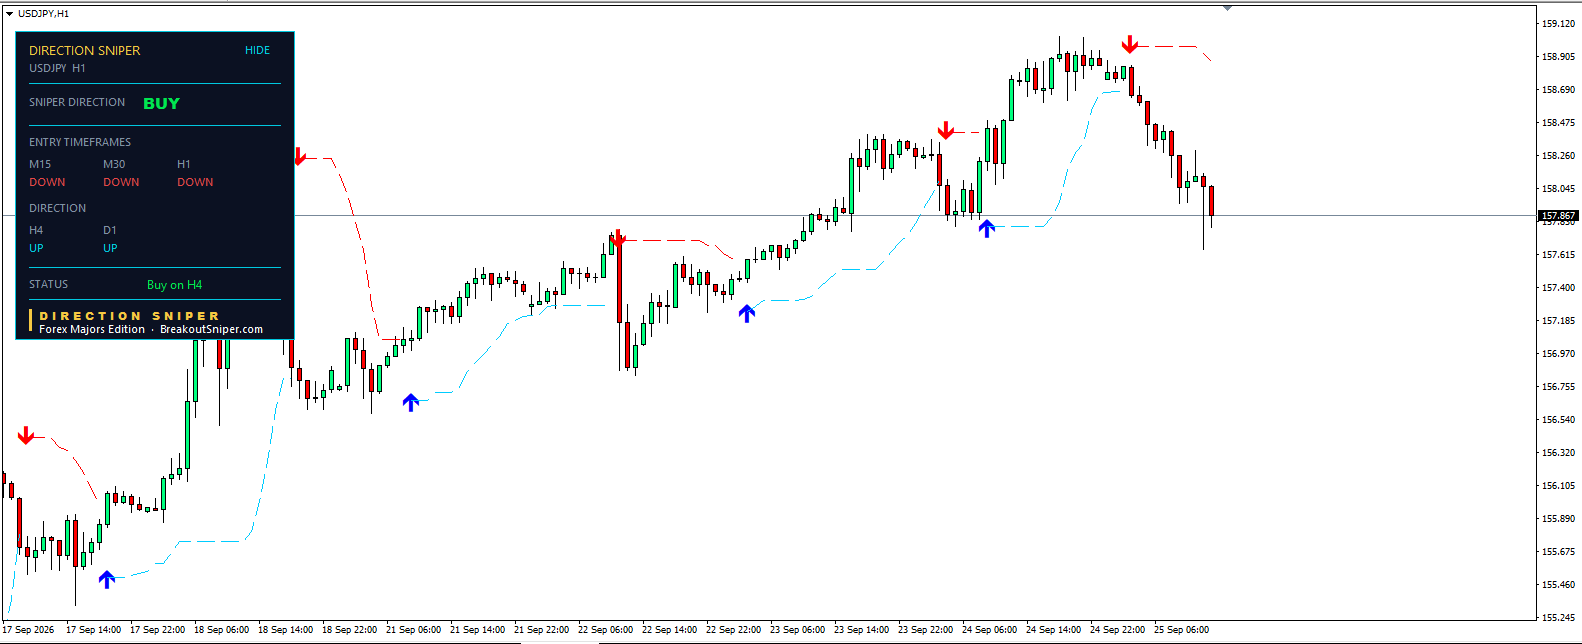
Start on the H1 and the BUY verdict explains itself.
USD JPY has climbed from around 155.50 on 17 September to just under 159.00 by yesterday evening. That is roughly three hundred and fifty pips in a week, with the trailing level sitting below price almost the entire way.
Nothing about that climb has been undone. H4 and D1 are reading exactly what you can see.
The Pullback
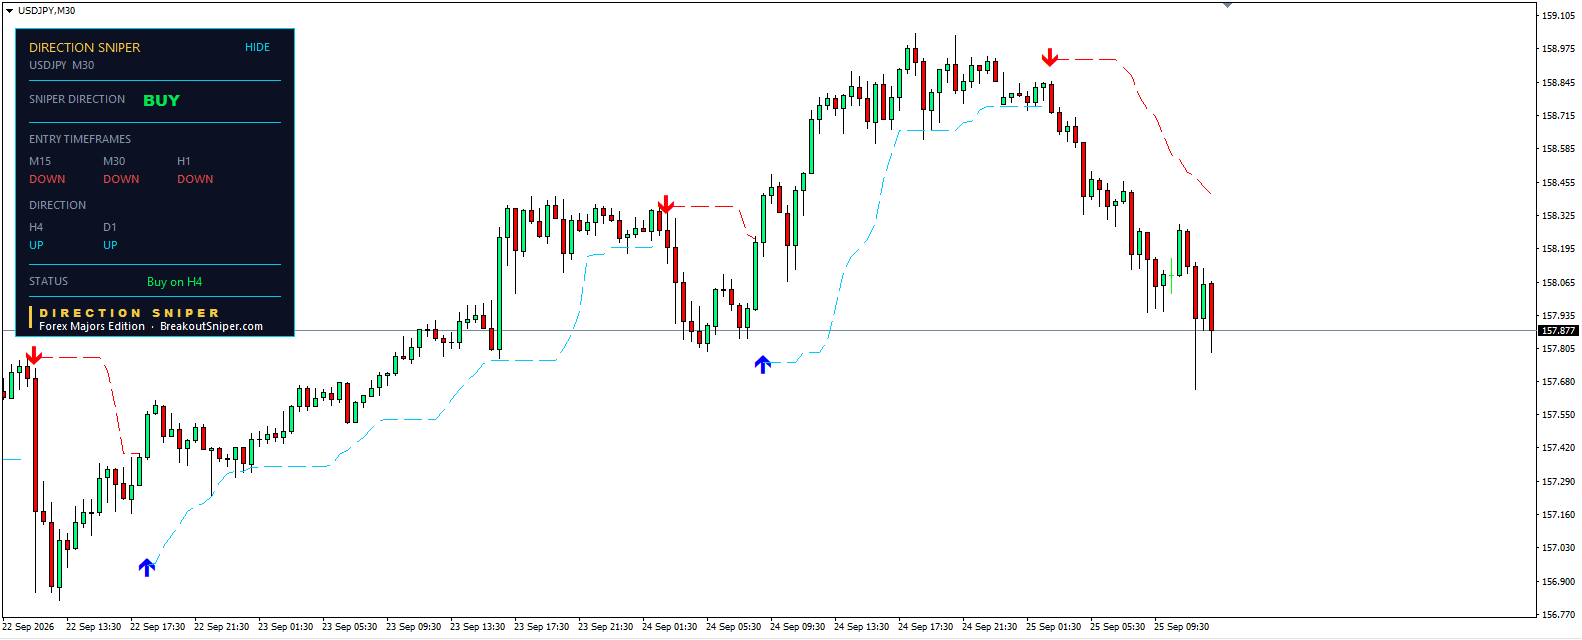
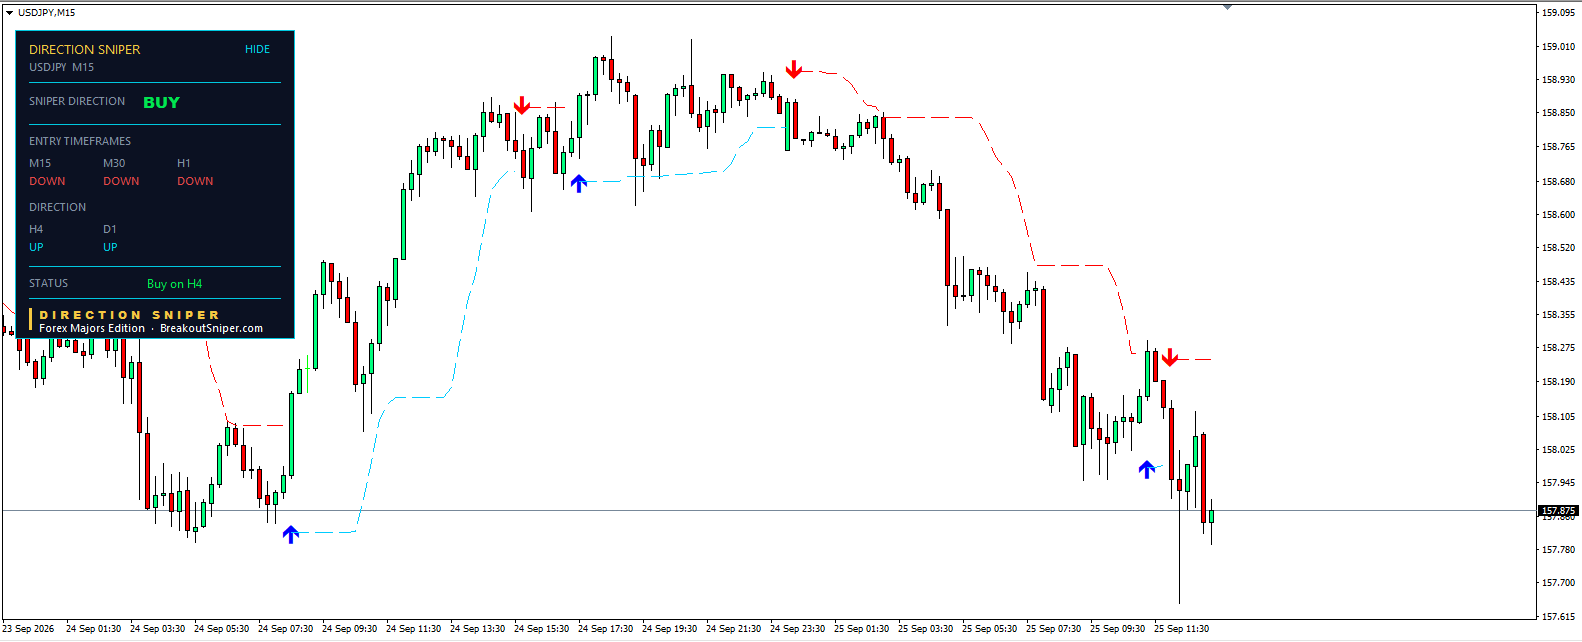
Since that high just under 159.00 late yesterday, USD JPY has come back roughly 110 pips to where it sits now.
That pullback is why M15, M30 and H1 all read DOWN. They are doing their job. They are telling you the short term direction, and the short term direction is down.
The verdict still says BUY, because the week long trend has not broken. The entries say wait, because right now price is falling.
Both are true at once, and the tool is comfortable holding both without resolving them prematurely. Most traders are not.
The Mirror Image: This Is the Same Trade Three Times
Here is the part worth the whole post.
Put today’s three reads side by side.
At first glance USD JPY looks like the odd one out. It is the opposite of the other two in every single row.
It is not the odd one out. It is the same thing written backwards.
Selling EUR USD means buying dollars. Selling GBP USD means buying dollars. Buying USD JPY means buying dollars. All three verdicts are one position: long the dollar.
And the entry rows say the same thing twice over. The euro bouncing, the pound bouncing and dollar yen falling are three descriptions of one event: the dollar has paused.
Three charts. Three currencies. One move.
The Risk Nobody Puts In The Sales Page
This matters for a reason that has nothing to do with being clever about correlation.
When these signals eventually fire, and some of them will, they will fire at roughly the same time, because they are all waiting on the same dollar. If you take all three, you have not taken three trades with your normal risk on each. You have taken one dollar trade at triple size, and you will find that out on the day the dollar moves against you.
Traders do this constantly and believe they are diversified because the tickets have different names on them.
I will be straight with you about what the tool does and does not do here. The Direction Sniper reads each chart independently and prints an honest verdict for that chart. It does not know what else is open in your account, and it will not stop you taking all three. That part is yours.
What it does do is show you the full picture across every pair you put it on, in the same format, so the correlation is visible before you click rather than after. Reading three panels and noticing they are all the same dollar bet takes about ten seconds. Working that out from three separate charts without a panel takes experience most people buy the hard way.
What Has To Happen for a USD JPY Buy
One. M15 turns UP. When a pullback inside an uptrend exhausts, the timeframes turn back from the smallest upward. The moment M15 flips UP while the direction is still BUY, a complete ticket appears with an entry, a stop loss and three targets already calculated, and the alert fires.
Two. H4 or D1 turns DOWN. Then the BUY verdict is gone and USD JPY becomes a NO TRADE market until they agree again.
Three. Nothing. The pullback keeps drifting, the entries stay down, and there is no dollar yen trade today. Perfectly normal.
What must not happen is buying at 157.90 because the weekly trend is obviously up. The weekly trend being obviously up is why the verdict says BUY. It is not an entry, and confusing those two things is how a good read turns into a bad trade.
New: The Daily USD JPY Read
This is the first USD JPY read on BreakoutSniper, and it now runs alongside gold and silver, EUR USD and GBP USD.
Same format daily. What the panel says, what it refuses to say, and why. The days with no trade get published exactly like the days with four tickets, because those are the days that decide whether the rest of them work.
Read Four Majors From One Panel
The panel on these charts reads H4 and D1 for you and gives one verdict per pair: BUY, SELL or NO TRADE. It builds a complete ticket with an entry, a stop loss and three targets only when an entry timeframe genuinely agrees with that verdict.
Put it on four charts and you get exactly what you saw above: four honest readings in the same format, where the relationships between them are obvious at a glance.
Alerts fire on M15, M30 and H1 by popup, push notification or email, so you can close the platform and let the pullback finish without sitting there arguing with yourself.
The way in is the EUR USD Edition at seven dollars, and the full pair coverage is offered straight after it.
👉 Start here for seven dollars
Two minute install on MT4 or MT5. Works on whatever broker you already use.
Read the Other Daily Sniper Reads
Or follow the reads as they happen on Telegram and Facebook.
Frequently Asked Questions
What is the USD JPY forecast today, 25 September 2026?
The Direction Sniper reads H4 and D1 as both UP, giving a BUY verdict on USD JPY. M15, M30 and H1 are all DOWN, so no trade ticket has been issued. The Status line reads Buy on H4. USD JPY is trading at 157.875.
Why does USD JPY say BUY when EUR USD and GBP USD say SELL?
All three verdicts describe the same position. Selling EUR USD and GBP USD means buying dollars, and buying USD JPY means buying dollars. USD JPY is quoted with the dollar first, so a dollar move that pushes the other two down pushes it up.
Can I take EUR USD, GBP USD and USD JPY signals at the same time?
Doing so is closer to taking one dollar position at triple size than to taking three separate trades, because all three depend on the same underlying move. The indicator reads each chart independently and does not account for the rest of your account. Position sizing across correlated pairs is the trader’s own responsibility. This is education, not advice.
What does Buy on H4 mean?
It means the BUY verdict is currently supported by the H4 and D1 direction timeframes only, and no entry timeframe agrees with it yet. No ticket is built until one does.
Which timeframe turns first after a pullback?
M15. The timeframes turn back from the smallest upward, so M15 is the early warning, then M30, then H1.
Trading foreign exchange and CFDs carries a high level of risk and may not be suitable for all investors. Past performance is not indicative of future results. Everything on this page is education, not financial advice. Never risk money you cannot afford to lose.

