USD JPY Forecast Today, 5 October 2026: Are Your Four Trades Really One Trade?
Executive Summary
USD JPY is in BUY mode and every chart agrees. Daily up, four hour up, fifteen minute, thirty minute and one hour all up. No disagreement anywhere.
Four live buy tickets. One target already reached. All four currently in front.
USD JPY is trading at 158.201.
| Chart | Entry | Risk | Stop now | Status |
|---|---|---|---|---|
| H4 | 157.916 | 104.3 pips | 157.322 trailing | 28.5 pips ahead |
| H1 | 158.001 | 37.7 pips | 157.624 original | 20.0 pips ahead |
| M30 | 158.001 | 48.1 pips | 157.616 trailing | 20.0 pips ahead |
| M15 | 157.893 | 28.6 pips | 157.784 trailing | Target 1 reached |
A clean morning on a clean chart.
And it is also the most dangerous page we have published today, for a reason that has nothing to do with USD JPY.
1. Four Charts, One Direction
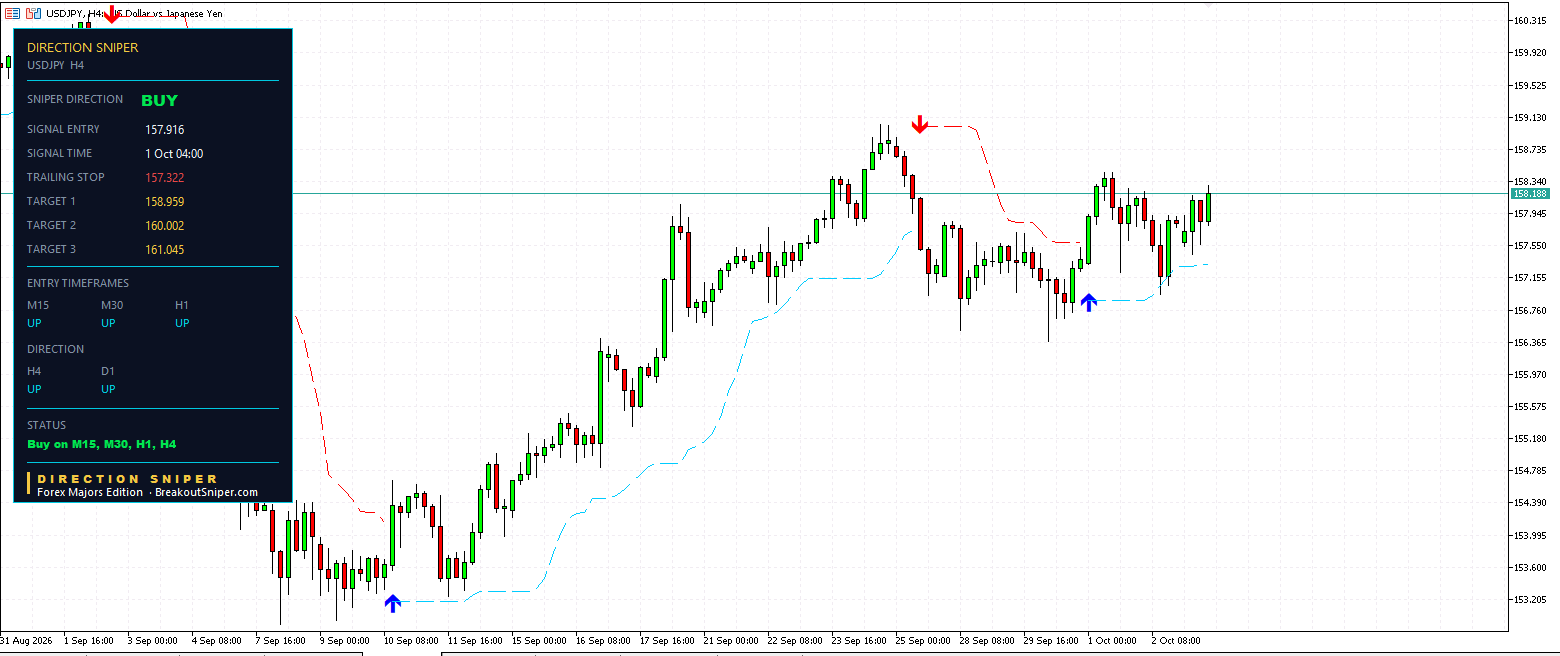
The daily and the four hour both read UP, so the verdict for the pair is BUY. Every shorter chart then looked for buying opportunities only, and all three of them found one. The status line on all four panels says the same thing: Buy on M15, M30, H1, H4.
The H4 ticket is the oldest. It entered at 157.916 on 1 October at 04:00, four days ago, with 104.3 pips of risk. Its stop started at 156.873 and the trailing stop now sits at 157.322, so the worst case has already been cut by 45 pips without the first target being reached.
The M15 is the newest, entered at 157.893 at 12:30 today with just 28.6 pips of risk. Its first target at 158.179 has been reached and its trailing stop has lifted to 157.784.
What the tool does for you here: it settles the direction once, from the daily and the four hour, and then every shorter chart works inside that answer. You are never deciding which timeframe to believe on a morning like this, and you are never tempted into a short because one small chart looked toppy for twenty minutes.
2. Two Tickets, Same Entry, Different Size
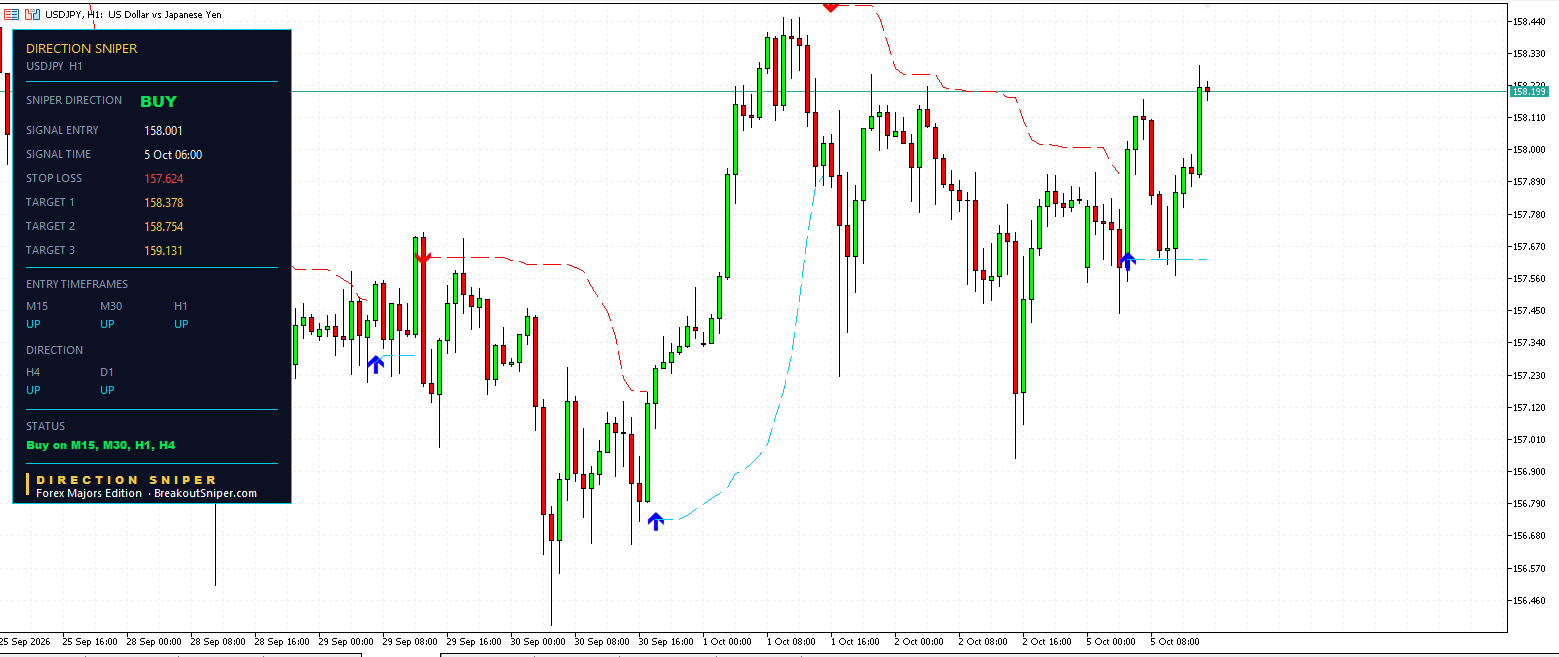
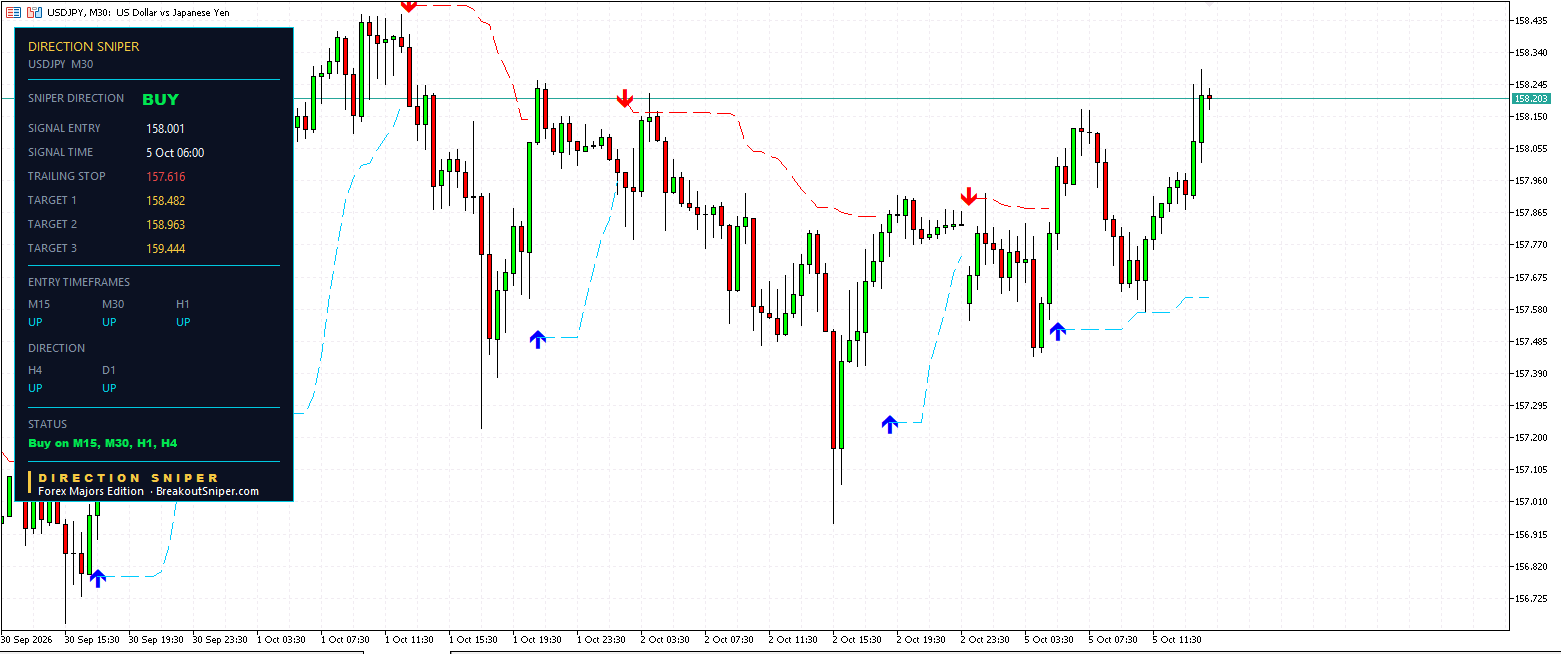
Look carefully at the H1 and the M30.
Both entered at 158.001. Both at 06:00 this morning. Identical price, identical minute.
And their risk is completely different. The H1 stop sits at 157.624, which is 37.7 pips. The M30 stop started at 157.520, which is 48.1 pips.
Same entry, different invalidation, because each chart measures its own structure. Which means those two tickets need different lot sizes, even though a glance at the panel makes them look like the same trade.
On a ten thousand dollar account risking half a percent, which is fifty dollars, and with the USD JPY pip value sitting at roughly $6.32 per standard lot at this exchange rate:
| Chart | Risk | Lot size at 0.5% |
|---|---|---|
| H4 | 104.3 pips | about 0.08 |
| M30 | 48.1 pips | about 0.16 |
| H1 | 37.7 pips | about 0.21 |
| M15 | 28.6 pips | about 0.28 |
Note that USD JPY is the awkward major. Its pip value is not the familiar ten dollars per standard lot, it is around six and a third, and it drifts as the exchange rate moves. Check your own broker’s figure rather than assuming.
What the tool does for you here: every ticket arrives with its own precise stop, on its own chart, so the lot size for each one is a calculation rather than a habit. Two trades that entered at the same price to the same minute are not the same trade, and only the stop distance tells you that.
3. Now Look At What You Are Actually Holding
Here is the board from today, across four separate posts.
| Market | Verdict | What it is actually saying |
|---|---|---|
| GBP USD | SELL | Dollar up |
| AUD USD | SELL | Dollar up |
| Gold | SELL | Dollar up |
| USD JPY | BUY | Dollar up |
Four markets. Four charts that look nothing like each other. One of them is a metal.
One bet.
Every single one is long the dollar. Three of them have the dollar on the right of the pair, so down means dollar strength. USD JPY has the dollar on the left, so up means exactly the same thing. The verdicts only look opposite because of where the dollar sits in the quote.
Why that matters more than any single entry
A trader who sold the pound, sold the Aussie, sold gold and bought USD JPY this morning believes they are holding four positions, spread across three asset classes, nicely diversified.
They are holding one position, four times over.
Each one was sized at half a percent, carefully, from its own stop. So they believe their risk is half a percent per trade. Their real risk is two percent on a single idea, and they never once decided to take a two percent position. It assembled itself, one sensible trade at a time.
If the dollar turns, all four go together. Not approximately together. Together.
That is the most expensive mistake in retail trading that almost nobody writes about, because every individual decision inside it was correct.
4. And It Happens Inside One Pair Too
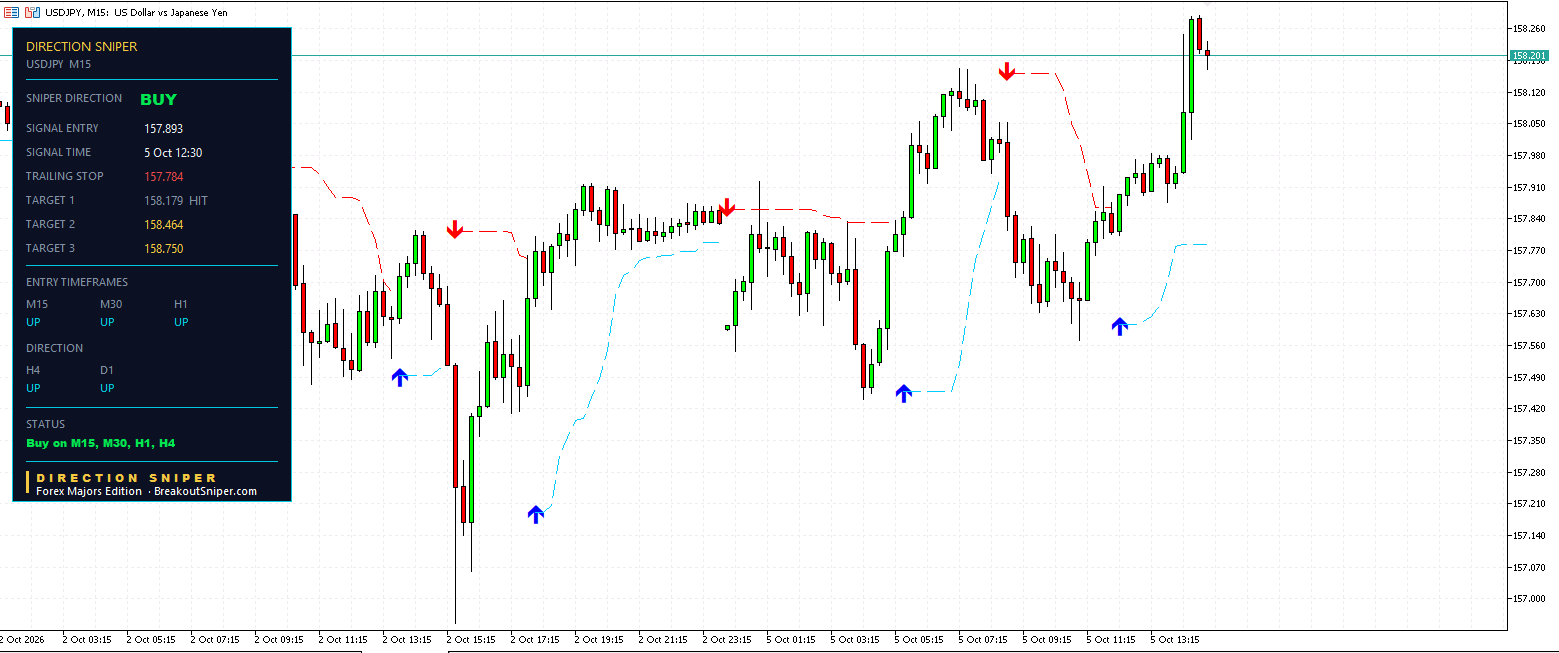
Look back at the four USD JPY tickets.
H4, H1, M30 and M15. Four entries, four stops, four sets of targets. They feel like four decisions.
They are four expressions of the same decision: the dollar goes up against the yen today.
If you took all four at half a percent each, that is two percent of your account on one view of one pair. Not four positions. One position in four sizes.
This is not an argument against taking more than one. The four timeframes do genuinely different jobs, the H4 is holding a four day move while the M15 is working a one hour one, and the M15 has already banked a target that the H4 has not reached. There is a real reason to run them together.
It is an argument for counting them as one when you size them.
5. So What Do You Actually Do About It
Three things, and none of them require a new indicator.
Count your exposure by currency, not by trade. Before you place anything, ask how many open positions already depend on the dollar going the same way. If the answer is three, your fourth is not a new idea, it is more of the one you already have.
Set a ceiling per idea, not only per trade. Half a percent per trade is meaningless if you can hold eight correlated trades. A total ceiling, say two percent across everything pointing the same way, is what actually caps your day. When you hit it, you are finished adding, however good the next setup looks.
Scale the size down when the correlation is high. If you want four dollar positions, they cannot each be the size you would use for one. Four at half a percent is a two percent bet. Four at a eighth of a percent each is a half percent bet with four ways of expressing it, which is the version you probably intended.
The hard part is not understanding this. It is doing it at eight in the morning when the fourth setup is clean, the first three are already working, and nothing in your platform is telling you they are all the same thing.
What the tool does for you here: nothing in this section happens if you can only see one pair at a time. You spot it by having the board in front of you and noticing that the dollar is on one side of every verdict. That is the whole argument for running the panel across every pair rather than the one you happen to have open.
Where Things Go From Here
M15 Target 2 at 158.464 is 26 pips above here, with its stop already trailed to 157.784.
H1 Target 1 at 158.378 is 18 pips away and is the nearest level on the board.
M30 Target 1 at 158.482 sits almost on top of the M15 Target 2, so if price reaches one it is very likely reaching the other.
H4 Target 1 at 158.959 is 76 pips away. That is a four day position working at four hour speed, which is what it is for.
The level underneath everything is the H4 trailing stop at 157.322. Those are the levels on the chart and how far price sits from each. None of it is a forecast.
What You Are Actually Buying
Direction, settled once. The daily and the four hour answer it and no shorter chart overrules them. On a day like today that keeps you out of every tempting counter trade.
A precise stop on every ticket, on every timeframe. That is what makes the lot size a calculation. The H1 and the M30 entered at the same price to the same minute and needed different sizes, and only the stop distance told you so.
A trailing stop level that is recalculated as price moves, with the label changing from STOP LOSS to TRAILING STOP so you can see it has started. You still move the order on your platform yourself. The indicator does the arithmetic, the click is yours.
And the whole board at once. Everything in section three is invisible if you can only see one pair. The reason to run this across every market you trade is not more signals. It is seeing when all your signals are the same signal.
Direction Sniper prints all of it on your charts in MetaTrader and keeps it live.
- 28 Pair Edition, $77, every major, minor and cross, which is the only way to see the board the way section three describes it. Under three dollars a pair.
- Forex Majors Edition, $47, the seven majors including USD JPY, and the edition these four panels came from
- Gold and Silver Edition, the original and still the one most of our traders run
- EURUSD Edition, $7, the cheapest way to put the panel on a chart and see it work
The other three markets from today, which together make the point above: the gold post, the AUD USD post and the GBP USD post.
One question. How many of your open trades right now depend on the dollar going the same way? Tell me on the reviews and feedback page.
USD JPY Today: Common Questions
Is USD JPY a buy or a sell today?
On 5 October 2026 the Direction Sniper panel reads BUY on USD JPY. The daily and the four hour both point up, which sets the verdict, and the fifteen minute, thirty minute and one hour all point up as well. Four buy tickets are live and one target has been reached. This describes what the indicator displays and is not a recommendation to trade.
What are the USD JPY key levels today?
With USD JPY at 158.201, the nearest level above is the H1 target one at 158.378, then the M15 target two at 158.464 and the M30 target one at 158.482 almost on top of each other. Further up, the H4 target one sits at 158.959. Below, the H4 trailing stop at 157.322 is the floor under the whole idea.
Is buying USD JPY the same trade as selling gold?
In terms of what you are exposed to, largely yes. Today the panel reads sell on gold, the pound and the Australian dollar, and buy on USD JPY. All four are positions on the dollar strengthening. The three sells have the dollar on the right of the pair so down means dollar up, while USD JPY has it on the left so up means the same thing. Four different charts, one underlying bet.
How many correlated trades is too many?
The useful way to decide is to set a ceiling for each idea rather than only for each trade. Half a percent per trade means nothing if you can hold eight positions that all depend on the dollar going the same way, because that is a four percent bet on one view. Count your exposure by currency, give each idea a total ceiling, and reduce the size of each position when several of them point the same way.
Why do the USD JPY one hour and thirty minute tickets have different stops?
Both entered at 158.001 at 06:00 today, the same price in the same minute, but each chart measures its own structure. The one hour places its stop 37.7 pips away and the thirty minute places its original stop 48.1 pips away. Same entry, different invalidation, which means the two tickets need different lot sizes even though they look like one trade.
What is the pip value on USD JPY?
USD JPY is the awkward major. Its pip value is not the familiar ten dollars per standard lot that applies to pairs quoted in dollars. At an exchange rate around 158.20 it is roughly six dollars and thirty cents per standard lot, and it drifts as the rate moves. That matters because the lot size calculation depends on it, so check your own broker’s figure rather than assuming ten.
Does Direction Sniper move your stop loss automatically?
No. It calculates the trailing stop and shows you where the level should now sit, updating it as price moves and changing its label from STOP LOSS to TRAILING STOP once trailing has started. Moving the order on your platform is still your job. What it removes is the arithmetic and the judgement, not the click, and a level you can see but have not acted on is still your original risk.
Trading foreign exchange, gold and other leveraged products carries a high level of risk and is not suitable for everyone. The levels above describe where the indicator placed entries, stops and targets at the time the charts were read, and the positions described were still open. A stop is a level rather than a guarantee, and gaps or fast markets can fill you past it. Lot sizing and pip value figures are arithmetic for illustration and are not a recommendation about how much anyone should trade. Pip values on USD JPY change with the exchange rate, so check your own broker’s contract specifications. Nothing here is financial advice. Past performance does not guarantee future results.

