GBP USD Forecast Today, 5 October 2026: How Do You Size a Trade With Three Targets?
Executive Summary
GBP USD is in SELL mode and every single chart agrees. Daily down, four hour down, and all three entry timeframes down. There is no disagreement anywhere on this pair today.
Four live sell tickets. Two targets already reached. Two tickets currently behind their entry.
The pound is trading at 1.32051.
| Chart | Entry | Risk | Stop now | Status |
|---|---|---|---|---|
| H4 | 1.31847 | 111.7 pips | 1.32602 trailing | Behind entry by 20.4 pips |
| H1 | 1.31964 | 54.1 pips | 1.32505 original | Behind entry by 8.7 pips |
| M30 | 1.32198 | 29.7 pips | 1.32495 original | Ahead by 14.7 pips |
| M15 | 1.32348 | 15.7 pips | 1.32355 trailing | Targets 1 and 2 reached |
Look down the risk column. The same trade, in the same direction, on the same pair, asks for 111.7 pips of risk on one chart and 15.7 pips on another. That is a seven times difference, and if you put the same lot size on both, you are not running the same strategy twice. You are running one sensible trade and one that is seven times too big.
That is what the second half of this post is about.
One Verdict, Four Entries
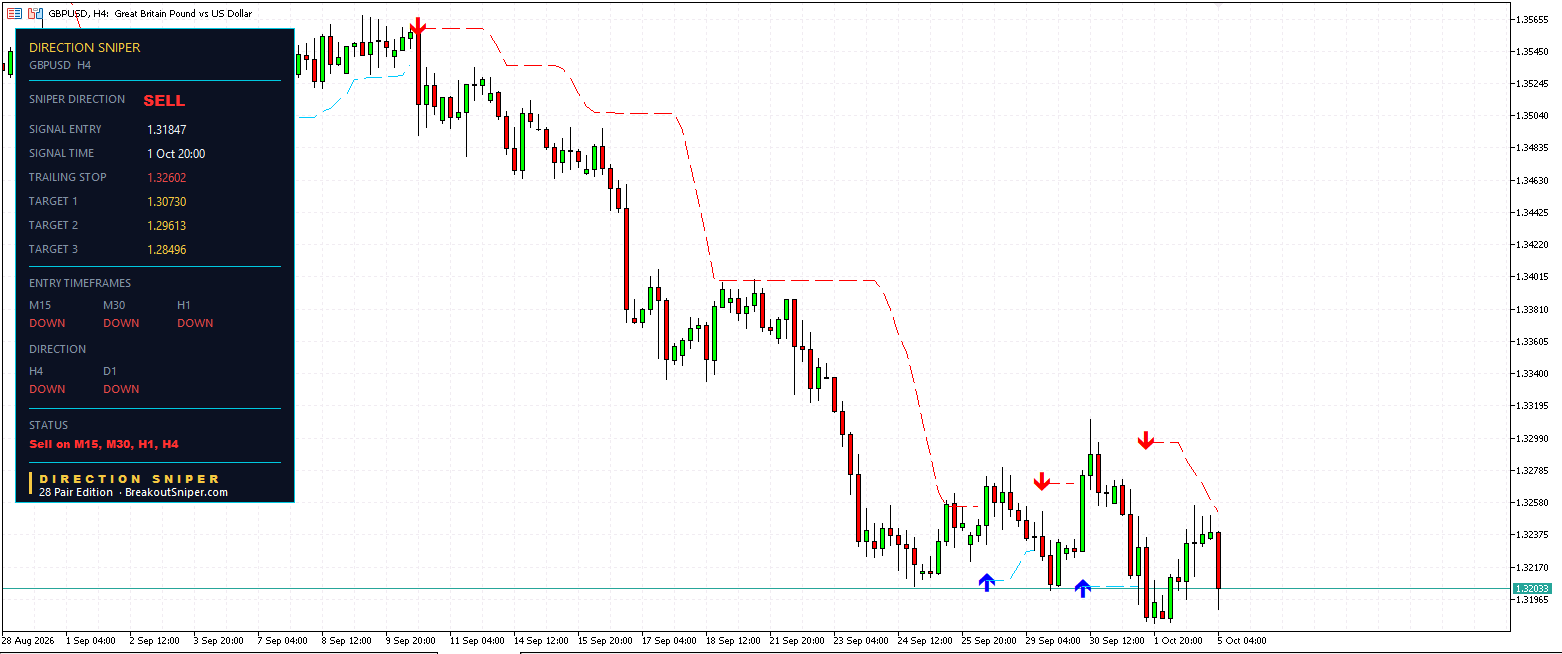
The daily and the four hour are the gatekeepers. Both read DOWN, so the verdict for the whole pair is SELL and every shorter chart spent the session looking for selling opportunities only. Nothing was hunting a buy.
Then all three entry timeframes read DOWN as well, which is why the status line on every chart says the same thing: Sell on M15, M30, H1, H4.
This is the opposite of what Bitcoin showed yesterday, where one entry chart had nothing to offer and the other three traded anyway. Today nobody is sitting out.
H4, the oldest ticket on the board
Entry at 1.31847, taken on 1 October at 20:00. That trade is four days old.
The original stop sat at 1.32964, which puts the risk at 111.7 pips. Targets at 1.30730, 1.29613 and 1.28496, each one placed at one, two and three times that risk.
The level now reads as a trailing stop at 1.32602, so it has come down 36 pips from where it started. The trade has improved its own floor without reaching a target.
Price at 1.32051 is above the entry, which on a sell means this one is behind, by 20.4 pips.
H1
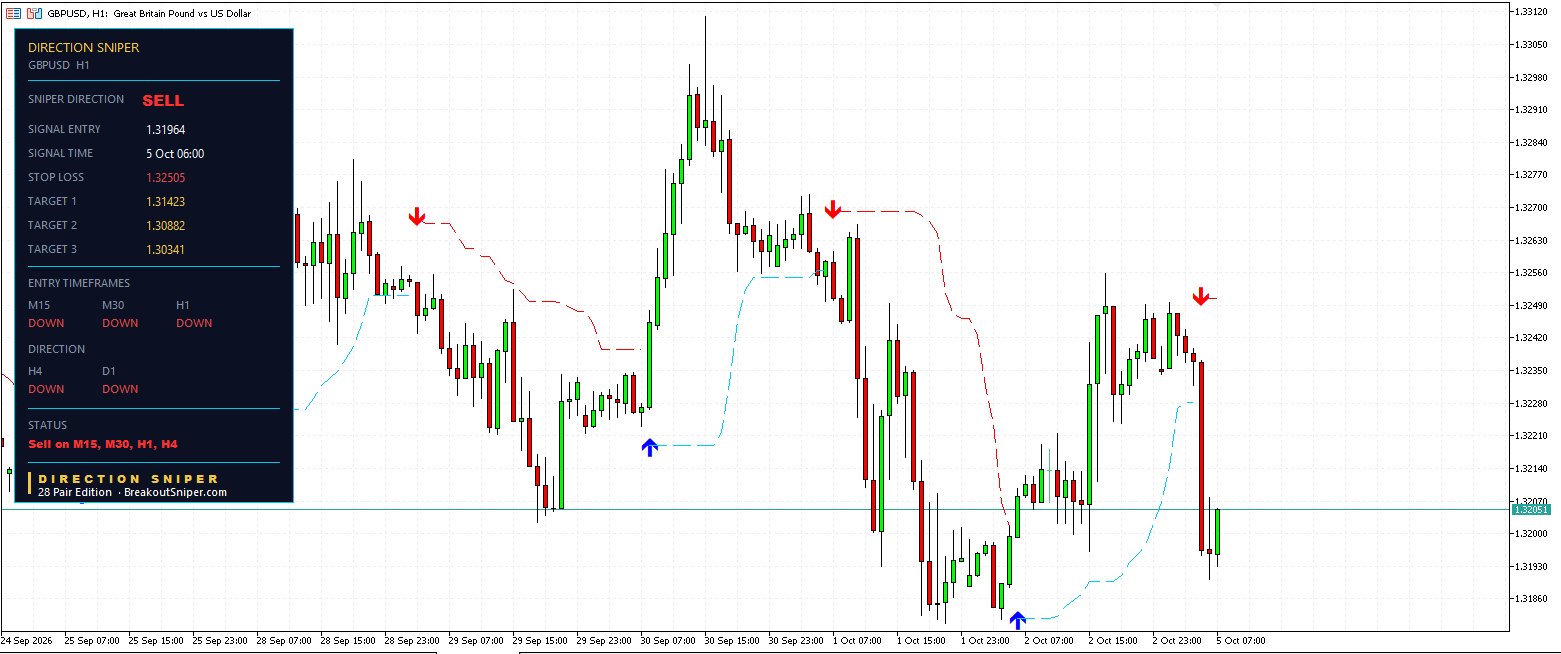
Entry at 1.31964, taken this morning at 06:00. Stop loss at 1.32505, so 54.1 pips of risk. Targets at 1.31423, 1.30882 and 1.30341.
The level still reads STOP LOSS rather than TRAILING STOP, which tells you the trade has not moved far enough yet for the tool to pull it up. Price at 1.32051 is 8.7 pips above entry, so this one is behind too, but barely.
M30
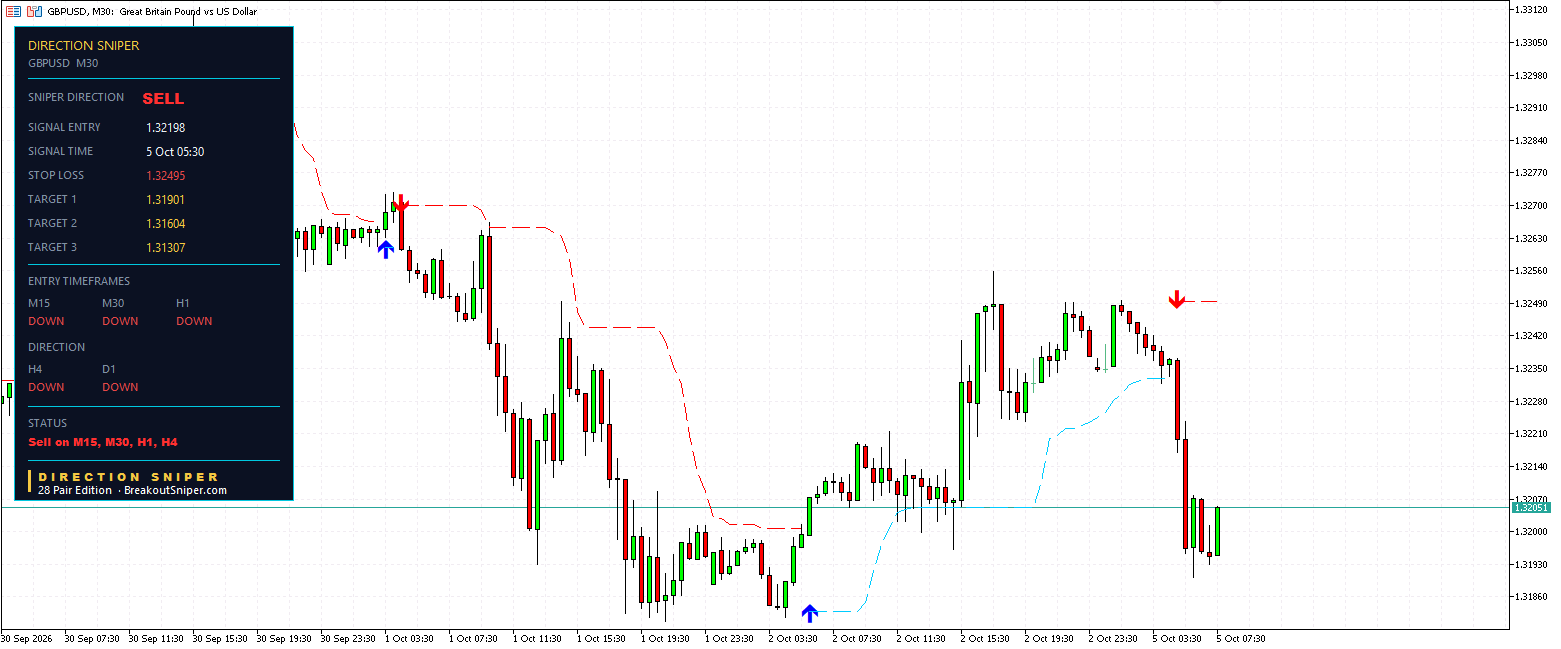
Entry at 1.32198 at 05:30. Stop at 1.32495, so 29.7 pips of risk. Targets at 1.31901, 1.31604 and 1.31307.
Price at 1.32051 is 14.7 pips below entry, so this one is ahead and sitting roughly halfway to its first target, with 15 pips still to travel.
M15, the one that has already paid twice
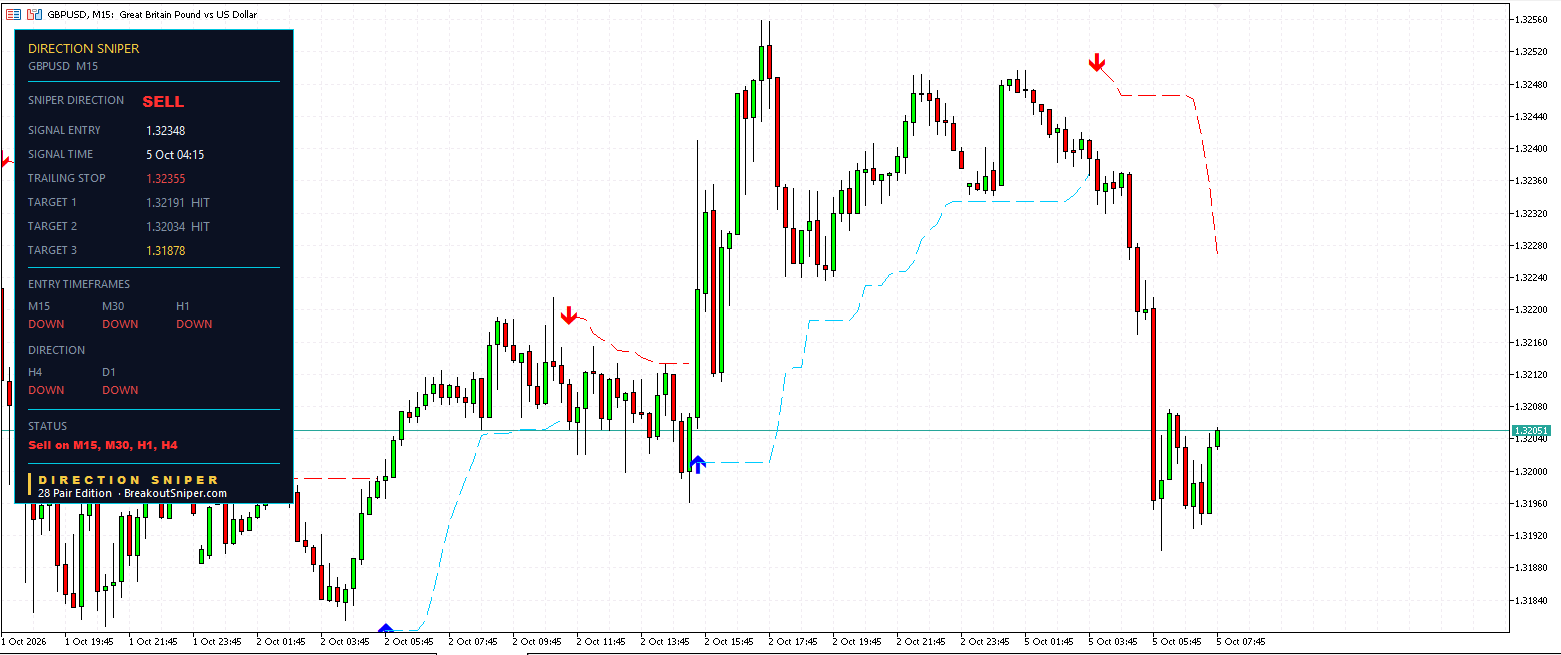
Entry at 1.32348 at 04:15, the earliest ticket of this morning’s three and the best sell price on the board. Original stop at 1.32505, so just 15.7 pips of risk, the tightest exposure here by a wide margin.
Target 1 at 1.32191 reached. Target 2 at 1.32034 reached. Target 3 sits at 1.31878, about 17 pips below where price is now.
And look at the stop. It reads 1.32355 against an entry of 1.32348. The level that started 15.7 pips above the trade has been pulled all the way down to within a fraction of the entry price. Whatever happens next, that position is no longer exposed to the loss it started with.
One more detail worth noticing. The M15 original stop was 1.32505. The H1 stop loss right now is also 1.32505. Two different charts, working independently, put the invalidation line at exactly the same price.
Key levels today: the H4 trailing stop at 1.32602 is the ceiling for the whole sell idea. Below, the M30 Target 1 at 1.31901 is the first shelf, then the M15 Target 3 at 1.31878, then the H1 Target 1 at 1.31423.
So How Much Should You Actually Trade?
Here is the part most people get wrong, and the panels today make it impossible to ignore.
Four tickets. Risk of 111.7, 54.1, 29.7 and 15.7 pips. If you put 0.10 lots on all four, you are risking $111.70 on one and $15.70 on another. Same conviction, same pair, same direction, and seven times the exposure on one of them for no reason other than which chart you were looking at.
The lot size is not a habit. It is a calculation, and the stop distance is what drives it.
The formula
Lot size = risk in money ÷ (stop distance in pips × pip value per lot)
On GBP USD, one standard lot moves roughly $10 per pip, so 0.10 lots is about $1 per pip and 0.01 lots is about $0.10 per pip. Check your own broker’s contract specification, because this varies.
What that means today
I risk at most 2 percent of an account on a single trade, and usually 0.5 percent. The bigger the account, the smaller that percentage gets.
At 0.5 percent, here is what today’s four tickets actually ask for:
| Chart | Stop | $10,000 account, $50 risk | $1,000 account, $5 risk |
|---|---|---|---|
| H4 | 111.7 pips | 0.04 lots | 0.004 lots |
| H1 | 54.1 pips | 0.09 lots | 0.01 lots |
| M30 | 29.7 pips | 0.17 lots | 0.02 lots |
| M15 | 15.7 pips | 0.32 lots | 0.03 lots |
Look at the top right cell. 0.004 lots does not exist. Most brokers will not let you trade below 0.01.
So on a $1,000 account, the H4 ticket is not available to you at proper risk. If you take it at the 0.01 minimum, you are risking $11.17, which is 1.1 percent of the account, more than double what you intended.
That is not a reason to take it anyway and hope. It is the arithmetic telling you that a 111 pip stop does not fit a $1,000 account, and that your money belongs on the shorter timeframes until the account is bigger.
Nobody says this out loud because it is not what a small account wants to hear.
The test that matters more than the formula
If you find yourself watching a trade with your stomach tight, refreshing the screen, moving your stop because you cannot stand it, the lot size is still too big. It does not matter what the spreadsheet said.
A correctly sized position is one you can leave alone. That is the whole point of sizing it before you enter, not after.
Managing Three Targets Without Guessing
The panel gives you three targets on every ticket. Most people look at that, pick one, and ignore the other two. That throws away the entire reason there are three.
Here is the method that maps directly onto what the tool prints.
Split the position into three
Take the lot size you calculated, divide it by three, and open three separate positions with the same entry and the same stop, each with one of the three targets attached.
Using today’s H1 ticket on a $10,000 account at 0.5 percent:
- Total risk: $50
- Risk per position: $16.67
- Stop distance: 54.1 pips
- Each position: 16.67 ÷ (54.1 × 10) = 0.03 lots
So three positions of 0.03 lots, all entered at 1.31964, all stopped at 1.32505:
| Position | Target | Distance |
|---|---|---|
| 1 | 1.31423 | 54.1 pips |
| 2 | 1.30882 | 108.2 pips |
| 3 | 1.30341 | 162.3 pips |
Then the part that changes everything
When Target 1 is reached, move the stops on positions 2 and 3 to your entry price of 1.31964.
At that moment, the first third has closed with its gain banked, and the remaining two thirds are sitting at the price you paid for them. The trade’s worst remaining outcome has moved from losing $50 to keeping what position 1 already made, subject to slippage and weekend gaps, which are real and which no stop can fully protect you from.
When Target 2 is reached, move the stop on position 3 down to the Target 1 level. Now that last third is protected above where it started.
Why bother, when you could just use one target
Because most trades do not reach Target 3.
That is the honest reason, and it is the only reason you need. If you put everything on the furthest target, you will watch a lot of positions travel most of the way there and then come back and stop you out at your entry with nothing. If you put everything on the nearest target, you will be out of every big move after the first leg.
Splitting it means you take something from the trades that only go partway, and you keep a piece in the ones that keep running. You are not trying to be right about how far price will go, which is the one thing nobody can know in advance.
One or three positions
You can do the same thing with one position and partial closes, closing a third at each target. It works, but partial closes are fiddly on MetaTrader, and some brokers and most funded account programmes have rules about them.
Three separate positions needs no special handling. You set them once and the platform does the rest.
Where The Next Moves Come From
M15 Target 3 at 1.31878 is 17 pips away and the stop on that position is already at the entry. That is the trade with the least left to lose and the clearest next level.
M30 Target 1 at 1.31901 is 15 pips away. It sits almost on top of the M15 Target 3, so if price reaches one it is very likely reaching the other, and two tickets progress together.
The H1 and H4 need price below their entries at 1.31964 and 1.31847 before either starts working. The H1 is 8.7 pips away from that. The H4 is 20.4 pips away and has been waiting four days, which is what a four hour position looks like. It is not broken. It is slow, because that is what its timeframe is.
Nothing here is a forecast. These are the levels already printed on the charts and how far price currently sits from each one.
What You Are Actually Buying
Every number in this post came off a panel. The entry, the stop, the exact risk in pips, three targets placed at one, two and three times that risk, and a label that changes when the stop starts trailing so you know the trade has improved its own floor.
That is what makes the sizing possible. You cannot calculate a lot size without a stop distance, and you cannot manage three targets you have not been given.
Direction Sniper puts that panel on your charts in MetaTrader and keeps it live.
GBP USD sits in two editions:
🔹 Forex Majors Edition, $47 covers the seven majors, GBP USD among them
🔹 28 Pair Edition, $77 is the one these screenshots came from, and works out at under three dollars a pair
If you trade metals, the Gold and Silver Edition is the original and still the one most of our traders run. If you just want to see what the panel looks like on a chart, the EURUSD Edition is $7.
One thing I would like to know. How do you size your trades, and do you use all three targets or just the first one? Tell me on the reviews and feedback page. I read every comment.
GBP USD Today: Common Questions
Is GBP USD a buy or a sell today?
On 5 October 2026 the Direction Sniper panel reads SELL on GBP USD. The daily and the four hour charts both point down, which sets the verdict for the pair, and the fifteen minute, thirty minute and one hour charts all point down as well. Every chart agrees. This describes what the indicator displays and is not a recommendation to trade.
What are the GBP USD key levels today?
The four hour trailing stop at 1.32602 is the ceiling for the whole sell idea. Below the current price of 1.32051, the M30 target one sits at 1.31901 and the M15 target three at 1.31878, almost on top of each other. Further down, the H1 target one is at 1.31423 and the H4 target one at 1.30730.
Why does each GBP USD timeframe have a different stop today?
Because each chart measures its own structure. The four hour ticket places its stop 111.7 pips from entry, while the fifteen minute ticket places its stop just 15.7 pips away. The one hour is 54.1 pips and the thirty minute is 29.7 pips. Same pair, same direction, seven times the distance between the widest and the tightest.
What lot size suits today’s GBP USD tickets?
On a ten thousand dollar account risking half a percent, which is fifty dollars, the four hour ticket works out at roughly 0.04 lots and the fifteen minute at roughly 0.32 lots. On a one thousand dollar account the four hour ticket falls below most brokers’ minimum position size, so that trade does not fit the account at proper risk. Check your own broker’s contract specification.
Why has the M15 reached two targets while the H4 has reached none?
Age and distance. The four hour ticket was taken on 1 October at 20:00, four days ago, and its first target sits 111.7 pips below entry. The fifteen minute ticket was taken this morning at 04:15 with its first target only 15.7 pips away. The shorter chart was always going to reach its levels first.
Which GBP USD trades are currently behind?
Two of the four. With price at 1.32051, the four hour ticket entered at 1.31847 is 20.4 pips behind and the one hour ticket entered at 1.31964 is 8.7 pips behind. The thirty minute entered at 1.32198 is ahead by 14.7 pips, and the fifteen minute entered at 1.32348 has already reached its first two targets.
Trading foreign exchange and other leveraged products carries a high level of risk and is not suitable for everyone. The levels above describe where the indicator placed entries, stops and targets at the time the charts were read. The lot sizing examples are arithmetic for illustration and are not a recommendation about how much anyone should trade. Check your own broker’s contract specifications and minimum position size. Nothing here is financial advice. Past performance does not guarantee future results.

