AUD USD Forecast Today, 27 October 2026: Back To 0.70 Again. Is This The Pullback To Buy?
This AUD USD forecast today starts with a question we asked six days ago.
On 21 October we wrote is it too late to buy AUDUSD above 0.70? AUDUSD had just rallied through the round number, and the Direction Sniper panel showed how it bought the pullbacks instead of chasing the highs.
Since then AUDUSD has gone sideways for most of a week. Overnight it dipped back to around 0.7010, right above that same 0.70 level.
And the panel bought it again. One by one, the 15 minute, the 30 minute and the 1 hour lined up with the BUY verdict. By morning two targets had been reached, and the status reads Buy on M15, M30, H1, H4. Every chart, from the 15 minute to the daily, points up.
So is this the pullback to buy? Here is what the board shows.
1. The Trap: Giving Up On A Trend That Goes Sideways
A strong rally is easy to believe in. A week of sideways movement afterwards is not.
When a pair stalls, traders start to doubt the trend. Two common reactions:
- They sell the dip. Price drifts back toward an old level like 0.70, and it starts to look like the rally is over
- They wait for a breakout. They decide to buy only when price clears the recent high, and end up buying the top of the range
Both reactions come from looking at the last few days of price instead of the bigger picture. And on AUDUSD, the bigger picture never changed.
2. The Dip To 0.70, And The Panel Bought It Again
The Direction Sniper verdict comes from the 4 hour and the daily. On AUDUSD both point UP, so the direction is confirmed as BUY, and every entry chart is trigger ready to buy.
Overnight, as AUDUSD dipped toward 0.70, the fast charts turned down for a while. That is the pullback. Then they turned back up, and each one printed its own ticket as it lined up:
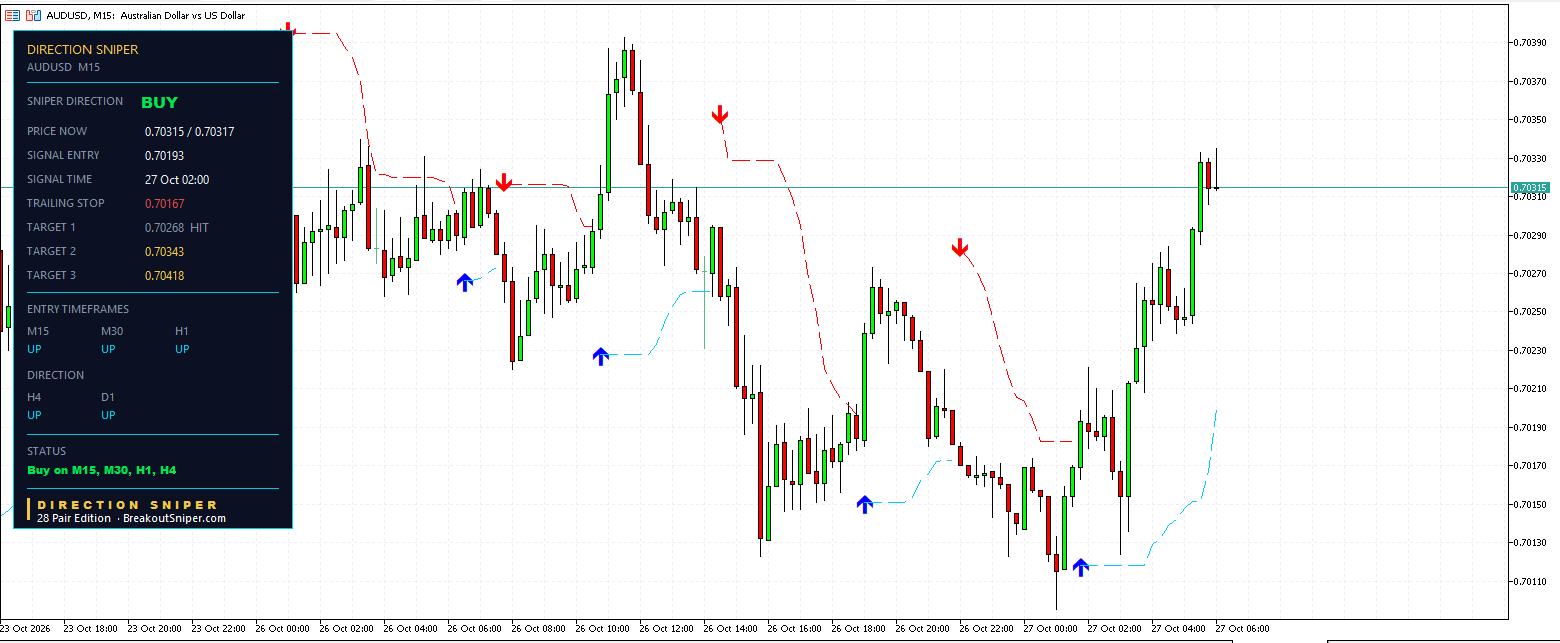
This is the AUDUSD 15 minute chart, and it shows exactly how a pullback ends on the Direction Sniper panel.
Start with the big picture. The 4 hour and the daily both point up. That confirms the direction: BUY. So the panel is only interested in one thing on this chart: a buy, after a dip.
Now look at what price did. Through Monday, AUDUSD drifted lower, from around 0.7039 down toward 0.70. The 15 minute turned down along the way. A lot of traders would see that and think the rally was over.
But turning down against the verdict doesn’t print a ticket. It’s just the pullback. The panel waits.
Overnight, AUDUSD touched around 0.7011, just above the 0.70 round number. Then the 15 minute turned back up. Back in line with the bigger direction.
At 02:00 the panel printed its ticket. Buy at 0.70193. Stop loss marked 7.5 pips below, at 0.70118. Three targets above: 0.70268, 0.70343 and 0.70418.
You knew the risk to the pip before the trade began, so you could size the lot before you entered.
From there, AUDUSD climbed. Target 1 at 0.70268 was reached. Price pushed on to around 0.7033, close to Target 2.
And watch the blue trailing line underneath. It has tightened from 0.70118 up to 0.70167, following the structure of the chart as price rose. It hasn’t crossed the entry yet. It sits 2.6 pips behind. So this ticket is working, but it isn’t protected yet.
The 15 minute was the first chart to line up after the dip. The 30 minute followed at 03:30. Then the 1 hour at 04:00.
That’s the pattern every time. The trend picks the side. The pullback creates the opportunity. And the fastest chart is the first to tell you the pullback is over.
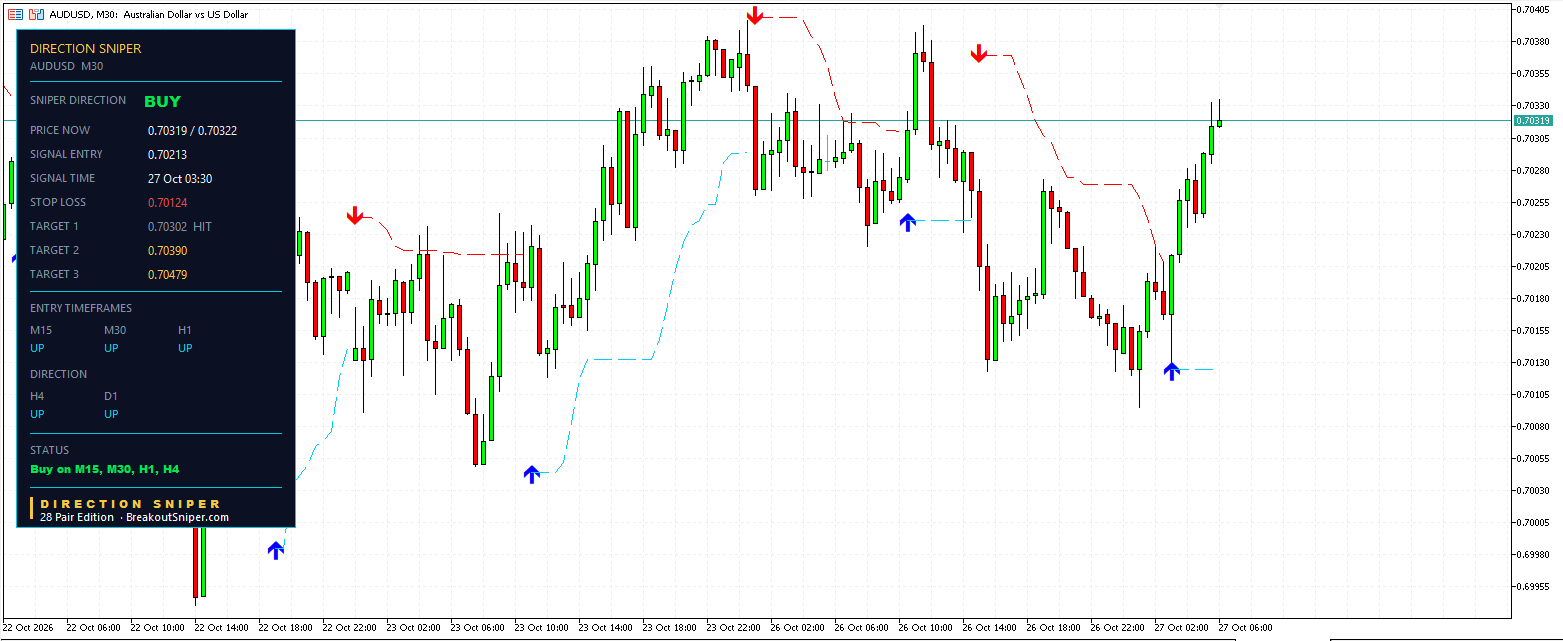
This is the AUDUSD 30 minute chart. Same direction, same dip, but a slightly wider view of how the pullback played out.
The 4 hour and the daily both point up. The direction is confirmed: BUY. So every entry chart, including this one, is trigger ready to buy.
Look at the last few days. Late last week AUDUSD climbed to around 0.7040. Then it slipped back. On Monday it tried again, spiked to around 0.7039, and fell away. By the early hours of Tuesday, it had dropped to around 0.7010.
From the outside, that looks like a pair losing its strength. Two failed pushes higher, and a slide back toward 0.70.
But the 30 minute never had a buy verdict problem. The 4 hour and the daily never turned. All that happened was a pullback, and the panel waited for it to finish.
At 03:30, the 30 minute turned back up and lined up with the direction. The ticket printed. Buy at 0.70213. Stop loss at 0.70124. Targets at 0.70302, 0.70390 and 0.70479.
Notice where that stop sits. Just under the area where the dip found its low. If price had kept falling through there, the pullback would have become something bigger, and the ticket would end. The stop is placed where the idea would be wrong.
That’s 8.9 pips of risk, known before entry.
Then AUDUSD climbed. Target 1 at 0.70302 was reached, and price is now around 0.7032, about 10.7 pips above the entry.
The panel still reads STOP LOSS, not TRAILING STOP. The stop hasn’t needed to move yet. The structure behind the trade hasn’t changed.
The 15 minute lined up first, at 02:00. This 30 minute chart confirmed it at 03:30. Two charts, the same story: the dip was a pullback, not a reversal.
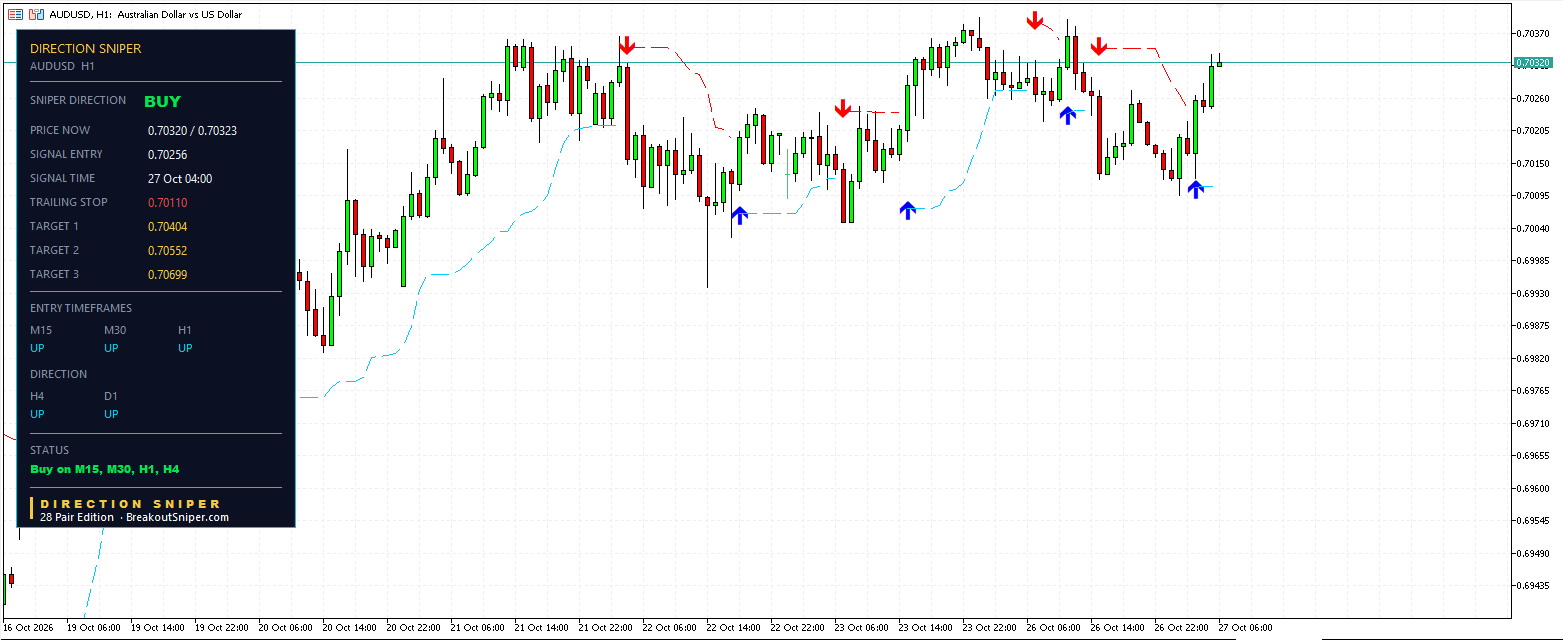
This is the AUDUSD 1 hour chart. And it shows the whole sideways week in one picture.
Look at the left side first. AUDUSD rallied from below 0.70 up to around 0.7037. Then it stopped. For most of a week, it moved back and forth, roughly between 0.7005 and 0.7040.
Up to the top of the range. Down toward 0.70. Up again. Down again.
Every time it dipped, the 1 hour turned down. Every time it recovered, the 1 hour turned back up. To a trader watching only this chart, it looked like a market that couldn’t make up its mind.
But the 4 hour and the daily never changed their minds. Both pointed up the whole time. So the direction stayed BUY, and the panel only cared about one thing: when each dip ended.
Overnight, AUDUSD dipped to around 0.7011 again. Then the 1 hour turned back up.
At 04:00, the ticket printed. Buy at 0.70256. Stop loss at 0.70108, just below the dip. Three targets above: 0.70404, 0.70552 and 0.70699.
This is the slower chart, so it lined up last. The 15 minute went first at 02:00, the 30 minute at 03:30, then the 1 hour. And because it’s slower, its stop is wider: 14.8 pips, giving the trade more room to breathe.
Right now, price is around 0.7032. That’s 6.4 pips above the entry, and Target 1 sits about 8 pips higher. No target reached on this chart yet. The trailing level is at 0.70110, almost exactly where the stop began.
Here’s the lesson this chart teaches. A sideways week can make a strong trend look tired. But a range inside an uptrend is just a series of pullbacks. And each pullback is another chance to buy, with the stop marked, the moment a chart turns back up.
| Chart | Lined up at | Entry | Risk | Targets | State |
|---|---|---|---|---|---|
| M15 | 27 Oct 02:00 | 0.70193 | 7.5 pips | 0.70268 reached, 0.70343, 0.70418 | Running |
| M30 | 27 Oct 03:30 | 0.70213 | 8.9 pips | 0.70302 reached, 0.70390, 0.70479 | Running |
| H1 | 27 Oct 04:00 | 0.70256 | 14.8 pips | 0.70404, 0.70552, 0.70699 | Running |
Price is about 0.7032.
Notice the order. The fastest chart lined up first, then the 30 minute, then the 1 hour. That is how a pullback ends on the panel: the 15 minute turns back with the trend first, and the slower charts follow.
This is the same play as last week. The trend, the pullback, the trigger. The panel did not need to know whether 0.70 would hold. It waited for the dip, then waited for the charts to turn back up, then printed each ticket with its stop already marked below the pullback.
3. Two Targets Reached By Morning
The 15 minute bought at 0.70193 with a stop 7.5 pips below. AUDUSD climbed through Target 1 at 0.70268, and price is now about 12 pips above the entry. Its trailing level has tightened to 0.70167, still 2.6 pips behind the entry, so the stop has not crossed yet.
The 30 minute bought at 0.70213 with a stop 8.9 pips below, at 0.70124. AUDUSD climbed through Target 1 at 0.70302, and price is about 10.7 pips above the entry.
The 1 hour bought at 0.70256. It has not reached a target yet. Price is about 6.4 pips above the entry, and Target 1 sits at 0.70404.
4. The Honest Part: The 4 Hour Starts Behind
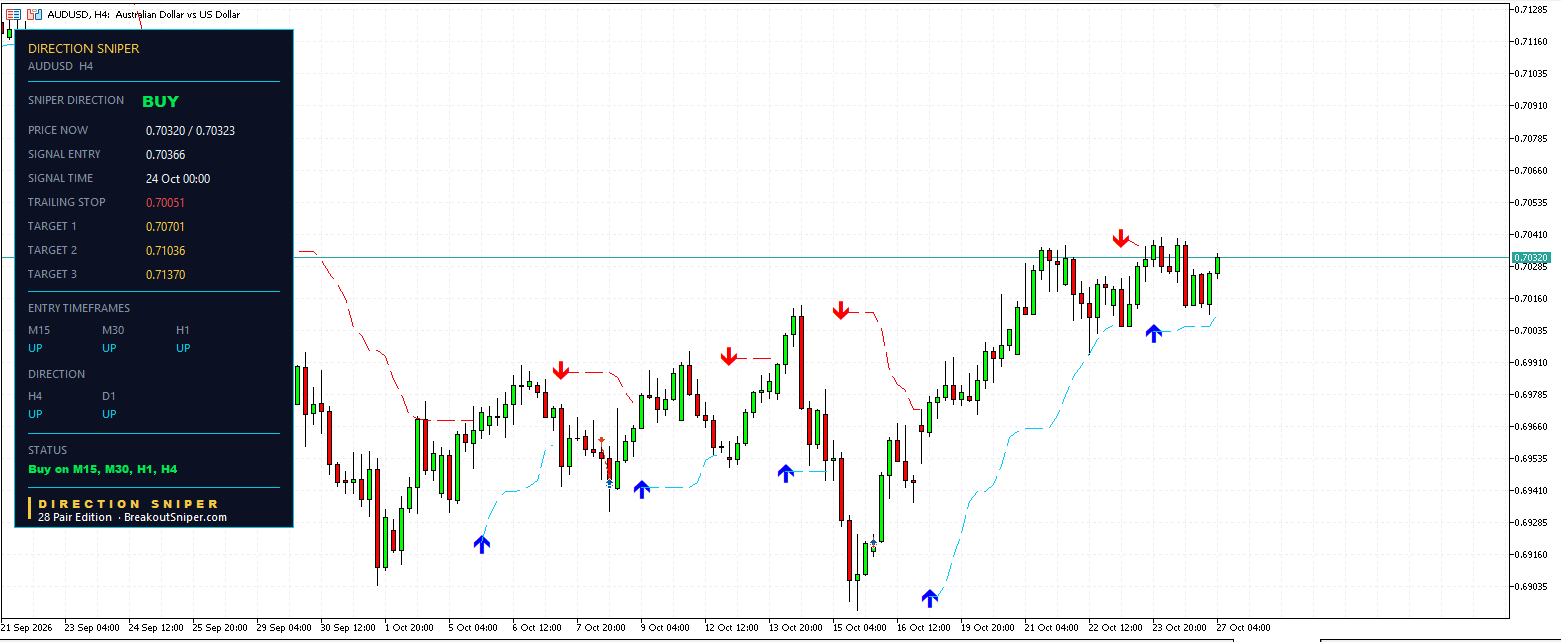
This is the AUDUSD 4 hour chart. This is where the direction comes from, so this is the chart that tells the real story.
Go back to the middle of October. AUDUSD fell to around 0.6895. Then it turned, and climbed steadily, day after day, through the 0.70 round number to around 0.7035.
That’s the rally we wrote about on 21 October.
After a run like that, markets usually pause. And that’s what this one did. For most of a week, AUDUSD moved sideways in a narrow band just above 0.70.
During that pause, the 4 hour dipped down briefly. Then, late on 23 October, it turned back up. Back in agreement with the daily. Direction confirmed again: BUY.
At midnight on 24 October, the 4 hour printed a fresh ticket. Buy at 0.70366. Stop loss at 0.70031, just above the 0.70 round number. Targets at 0.70701, 0.71036 and 0.71370.
That’s 33.5 pips of risk. The widest stop on the board, because this is the slowest chart, and it gives the trade the most room.
Now, the honest part. This ticket printed near the top of the sideways range. Since then, price has drifted back, and it’s sitting around 0.7032, about 4.6 pips below the entry. No target reached yet. The trailing level has barely moved, at 0.70051.
But look at what hasn’t changed. The 4 hour still points up. The daily still points up. And this morning, every faster chart lined up underneath it: the 15 minute, the 30 minute and the 1 hour all printed buys on the dip toward 0.70.
That’s why the 4 hour matters most. A ticket can start a few pips behind. The direction is what holds everything else together.
The 4 hour buy from 19 October, the one in our 21 October post, has ended, and the panel has since printed a fresh 4 hour buy.
| Level | |
|---|---|
| Entry, buy | 0.70366 (24 Oct 00:00) |
| Stop | 0.70031, so 33.5 pips of risk |
| Target 1 | 0.70701 |
| Target 2 | 0.71036 |
| Target 3 | 0.71370 |
| Trailing stop now | 0.70051 |
This ticket printed near the top of last week’s range, and today price sits about 4.6 pips below its entry. It has not reached a target yet. That is how a ticket can look in the middle of a sideways week, and we show it as it is.
What matters for the direction is that the 4 hour and the daily still both point up. The sideways week never turned them.
5. Which Ticket Suits You?
Today’s board has four tickets with four very different stops, from 7.5 pips to 33.5 pips. Traders often ask which one is “best”. There is no best. There is the one that suits your day.
- The 15 minute and 30 minute are the most hands on. More tickets, tighter stops, and more noise. They suit someone who can watch the chart during the session
- The 1 hour and 4 hour are less hands on. Fewer tickets, wider stops, and more room. They suit someone who checks the chart a few times a day, or once
Pick one timeframe that fits your schedule, stay with it for 20 to 30 tickets, and keep a record. Switching every day is how traders end up judging a method on a handful of trades.
Whichever you choose, the risk stays the same. AUDUSD is quoted in US dollars, so one pip on a standard lot is about $10. At 0.5 percent of a $10,000 account, which is $50 of risk:
| Chart | Stop distance | Lot size for $50 of risk |
|---|---|---|
| M15 | 7.5 pips | about 0.67 lots |
| M30 | 8.9 pips | about 0.56 lots |
| H1 | 14.8 pips | about 0.34 lots |
| H4 | 33.5 pips | about 0.15 lots |
A wider stop simply means a smaller lot. The 4 hour gives the trade more than four times the room of the 15 minute, for the same $50.
On a small account, a cent account makes the right size possible. For small balances we recommend a RoboForex Cent account or an XM Micro account. These are partner links, so we may receive a commission at no cost to you.
We risk at most 2 percent per trade, usually 0.5 percent. If you are worrying about every trade, your lot size is still too big.
6. What To Watch
The levels that matter:
- The next targets above: 0.70343 on the 15 minute, 0.70390 on the 30 minute, then 0.70404 on the 1 hour
- The 15 minute trailing stop at 0.70167, and the 30 minute stop at 0.70124, below the overnight low area
- The 4 hour stop at 0.70031, just above the 0.70 round number
What would change the picture: if the 4 hour turned DOWN while the daily stayed UP, the verdict would move to NO TRADE and the panel would stop looking for buys. Today every timeframe reads UP.
Nobody knows whether this dip was the last one before a move higher or just another swing in the range. The panel gives you the map: where each ticket ends, and where the next targets sit.
For a longer view of how this pair behaves, see our AUDUSD technical analysis page.
The Same Play, Again
Put the week together.
AUDUSD rallied through 0.70. It went sideways long enough to make traders doubt it. Then it dipped back toward 0.70, and the panel did exactly what it did last week: waited for the pullback, waited for the fast charts to turn back up, and printed each ticket with its stop marked. Two targets reached by morning.
A trend you can trust keeps offering the same entry. You do not have to catch the move. You have to recognise it repeating.
The Direction Sniper 28 Pair Edition puts this exact panel on AUDUSD and 27 other pairs:
- Direction. One verdict from the 4 hour and the daily. Through a sideways week, it never stopped saying BUY.
- Pullbacks that have not broken structure. The panel waits through the dip and prints a ticket when a faster chart turns back up, so you buy the pullback, not the top of the range.
- The stop loss. Every ticket arrives with its stop marked, so you can choose the timeframe that fits your day and size it before you enter.
28 pairs, one licence, MT4 or MT5.
Want a read like this in your inbox? Join The Daily Sniper Read, free, every trading day.
Disclaimer: This post reports what the Direction Sniper panel showed on AUDUSD on 27 October 2026. It is educational analysis, not financial advice and not a trade signal service. All four tickets were still open at the time of writing. Price reaching a published target level is not the same as a realised result. High and low levels are approximate readings from the chart. Lot sizes are arithmetic for illustration and are not a recommendation about how much anyone should trade. Forex trading carries risk, and you should only trade money you can afford to lose.

