Gold and Silver Price Forecast Today, 4 November 2026: Metals Rallied Hard. The Panel Stood Aside On Gold, And Both 4 Hour Stops Were Already In Front Of The Entry
This gold and silver price forecast today comes after a big move: gold has climbed from around 3,875 to above 4,000, and silver from around 49 to above 51.50. On the Direction Sniper panel, gold has moved to NO TRADE and stood aside, while silver still reads SELL on its bigger charts. And before the rally arrived, both 4 hour sell tickets had already closed with their stops in front of the entry. Here is the full picture at a glance, then the story behind it.
🛡 Closed 39.15 points in front
🛡 Targets 1 and 2, closed 160.6 cents in front
✔ Target 1, closed near entry
Trailing stop cut the cost by about 40%
Yesterday, we stood on the beach and watched the tide go out.
The waves kept coming up the sand, each one a little shorter than the last. The tide was going out, and the panel said SELL.
Then this morning, a much bigger wave came. It ran further up the beach than anything in a week. And the lifeguard did the one thing a good lifeguard does when the water changes: put up the flag and told everyone to stand back.
Not “swim the other way.” Not “the tide has turned.” Just: the water is not clear right now, so stay out until it is.
That is what the panel did on gold.
But the more useful story is what happened before the wave arrived. Of the four gold and silver tickets on the board yesterday, how many were still fully exposed when the rally hit? By section 6, you will see the answer, and what it cost.
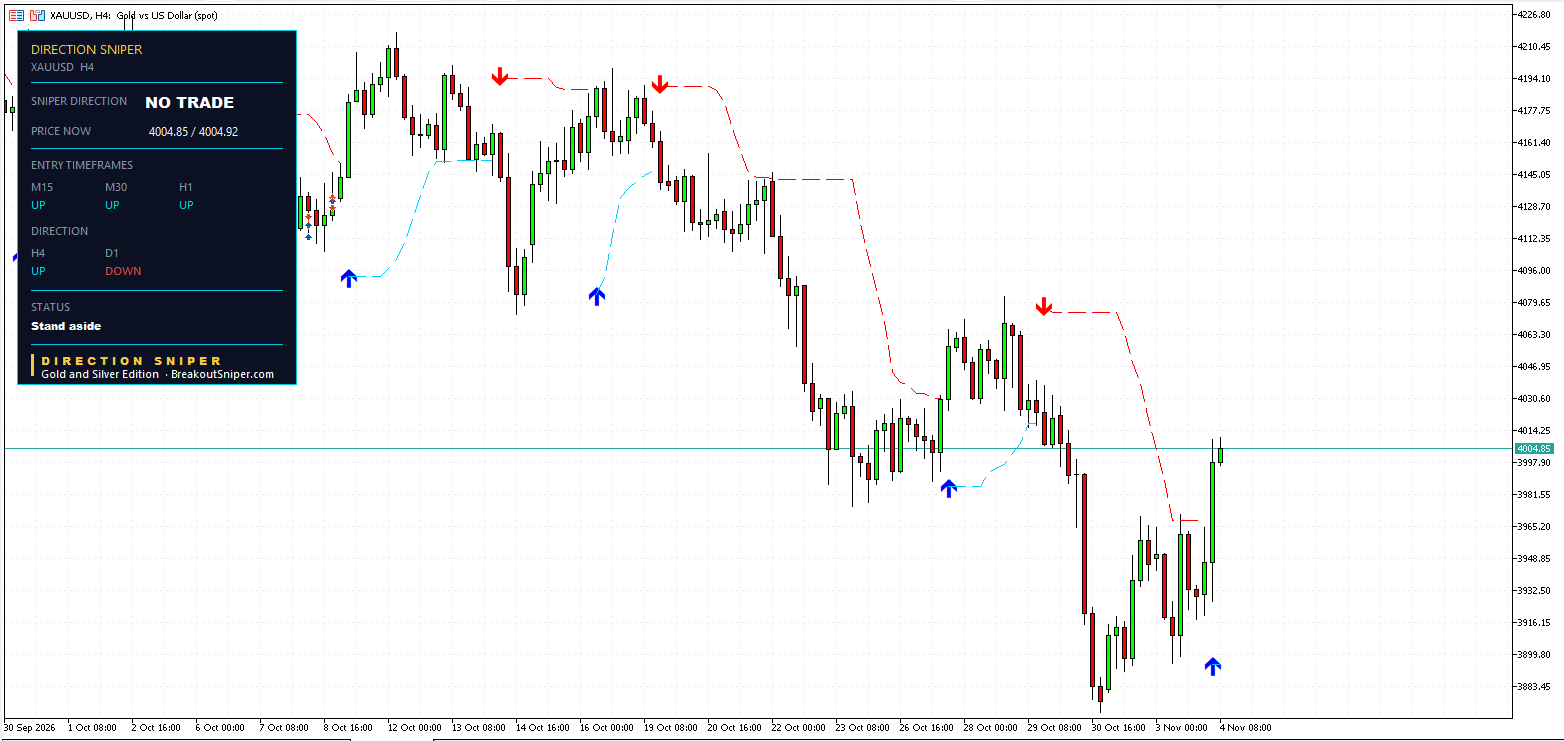
1. Gold And Silver Today: The Board
| Market | Chart | Ticket | What happened |
|---|---|---|---|
| Gold | H4 | SELL from 4007.13 | Target 1 reached, closed at trailing stop 39.15 points in front of the entry |
| Gold | H1 | SELL from 3926.41 | Closed at its trailing stop on 3 November, before the rally, behind the entry |
| Silver | H4 | SELL from 52.799 | Targets 1 and 2 reached, closed at trailing stop 160.6 cents in front of the entry |
| Silver | H1 | SELL from 50.129 | Target 1 reached, closed at its trailing stop close to the entry, before the rally |
| Chart | Gold | Silver |
|---|---|---|
| M15 | UP | UP |
| M30 | UP | UP |
| H1 | UP | UP |
| H4 | UP | DOWN |
| Daily | DOWN | DOWN |
On gold, the 4 hour has turned UP while the daily still reads DOWN. The two charts that decide direction now disagree, so the panel reads NO TRADE, Stand aside. On silver, the 4 hour and the daily both still read DOWN, so the verdict is still SELL, with every entry chart bouncing UP.
2. Gold Price Forecast Today: Why The Panel Stood Aside
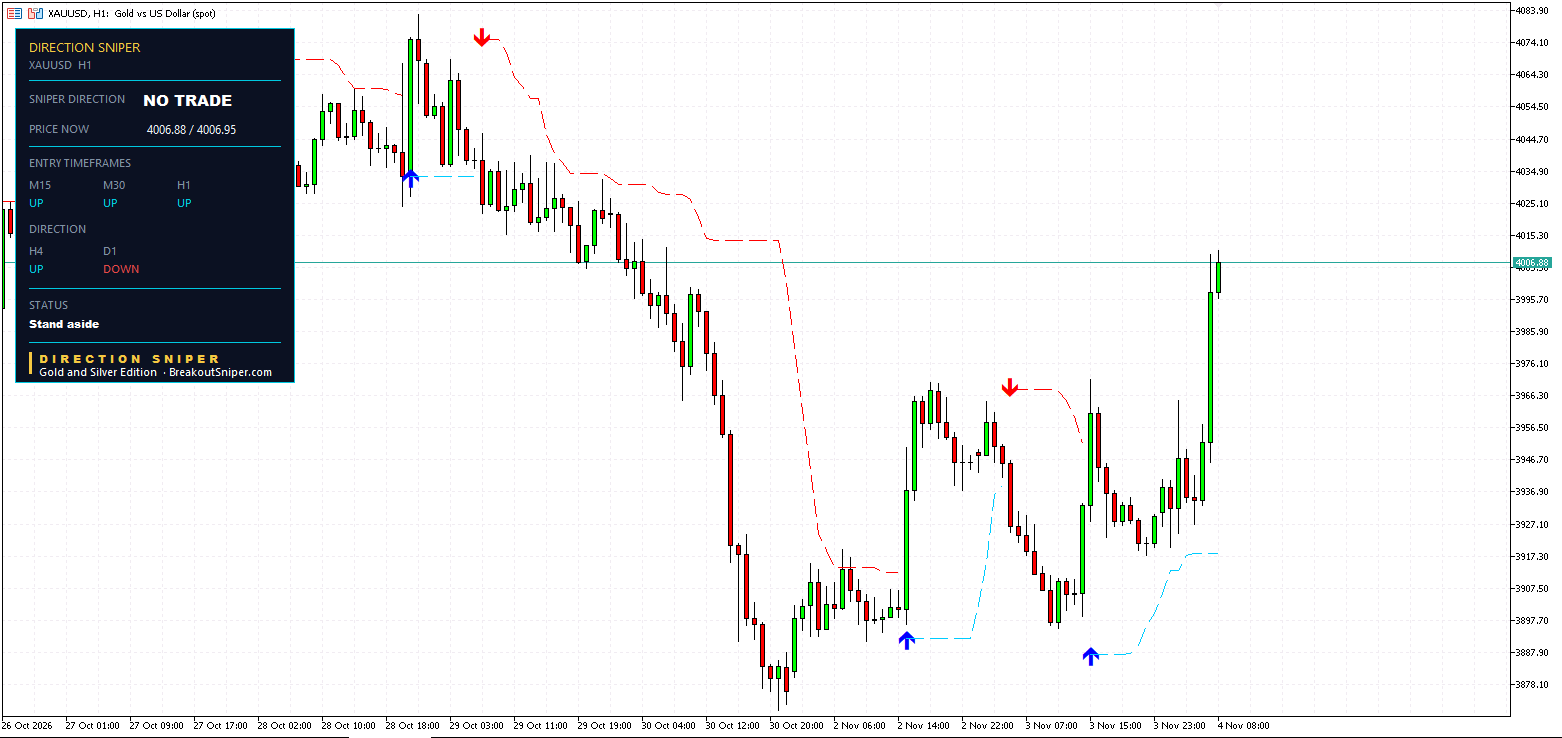
In every gold post this week, we wrote the same line: if the 4 hour turned UP while the daily stayed DOWN, the panel would move to NO TRADE and stand aside.
This morning, that is exactly what happened.
Gold had bounced from around 3,875 on Friday, stalled near 3,970, dipped to around 3,895 on 3 November, and then rallied hard overnight, through 4,000. That was enough to turn the 4 hour chart UP. The daily still reads DOWN.
When the two charts that decide direction disagree, the panel does not guess. It does not flip to BUY because of one strong rally, and it does not keep saying SELL when the 4 hour has turned. It stands aside, and waits until the 4 hour and the daily agree again.
That is the flag on the beach. And it is one of the most valuable things a panel can do: tell you clearly when there is no trade, so you are not the swimmer still in the water when the current changes.
We explain how the 4 hour and the daily decide gold’s direction in our guide to multi timeframe analysis for gold.
3. Gold 4 Hour: The Ticket That Was Already Safe
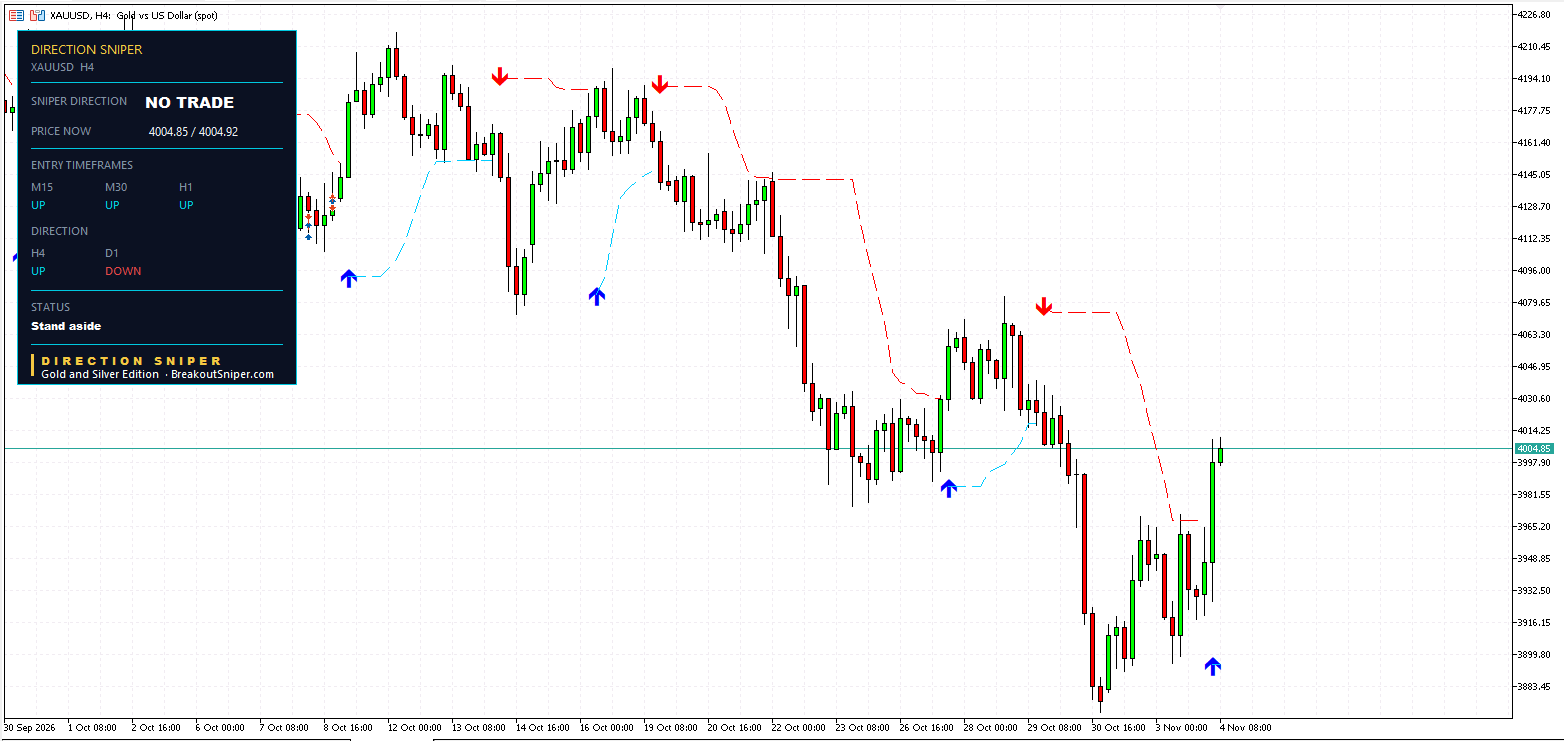
The gold 4 hour sell printed on 29 October at 4007.13. It reached Target 1 at 3937.99, and the panel’s trailing stop followed it down, from 4074.25 on Friday to 4004.41, then to 3988.85, then to 3967.98.
When gold started to climb, the ticket closed at that trailing stop: 39.15 points in front of its entry.
Now look at where gold is. At 4004.85, it is almost exactly back at the ticket’s entry. Without the trailing stop, this ticket would still be open, sitting near break even after a week, with its original stop at 4076.27 still 71 points above, and the full $50 of planned risk still on the line at 0.5 percent of a $10,000 account.
With the trailing stop, it was finished before the rally reached it, in front of its entry, with nothing left exposed.
4. Gold 1 Hour: The One The Rally Caught
Yesterday’s fresh 1 hour sell printed at 3926.41, with its stop at 3968.30, 41.89 points above.
Gold fell from there to around 3,895, short of Target 1 at 3884.52. Then it rallied on the afternoon of 3 November. By then, the panel’s trailing stop had come down from 3968.30 to around 3,950, read from the chart, and the ticket closed there, roughly 25 points behind its entry instead of 41.89.
| Gold 1 hour | At the original stop | At the trailing stop |
|---|---|---|
| Distance behind the entry | 41.89 points | roughly 25 points |
| Cost on $50 of planned risk | $50 | around $30 |
That is a miss, and we publish it. But it is a measured one. The trailing stop cut the cost by about 40 percent, and the ticket was closed long before gold went on to 4,000.
5. Silver Price Forecast Today: Both Tickets Closed Before The Wave
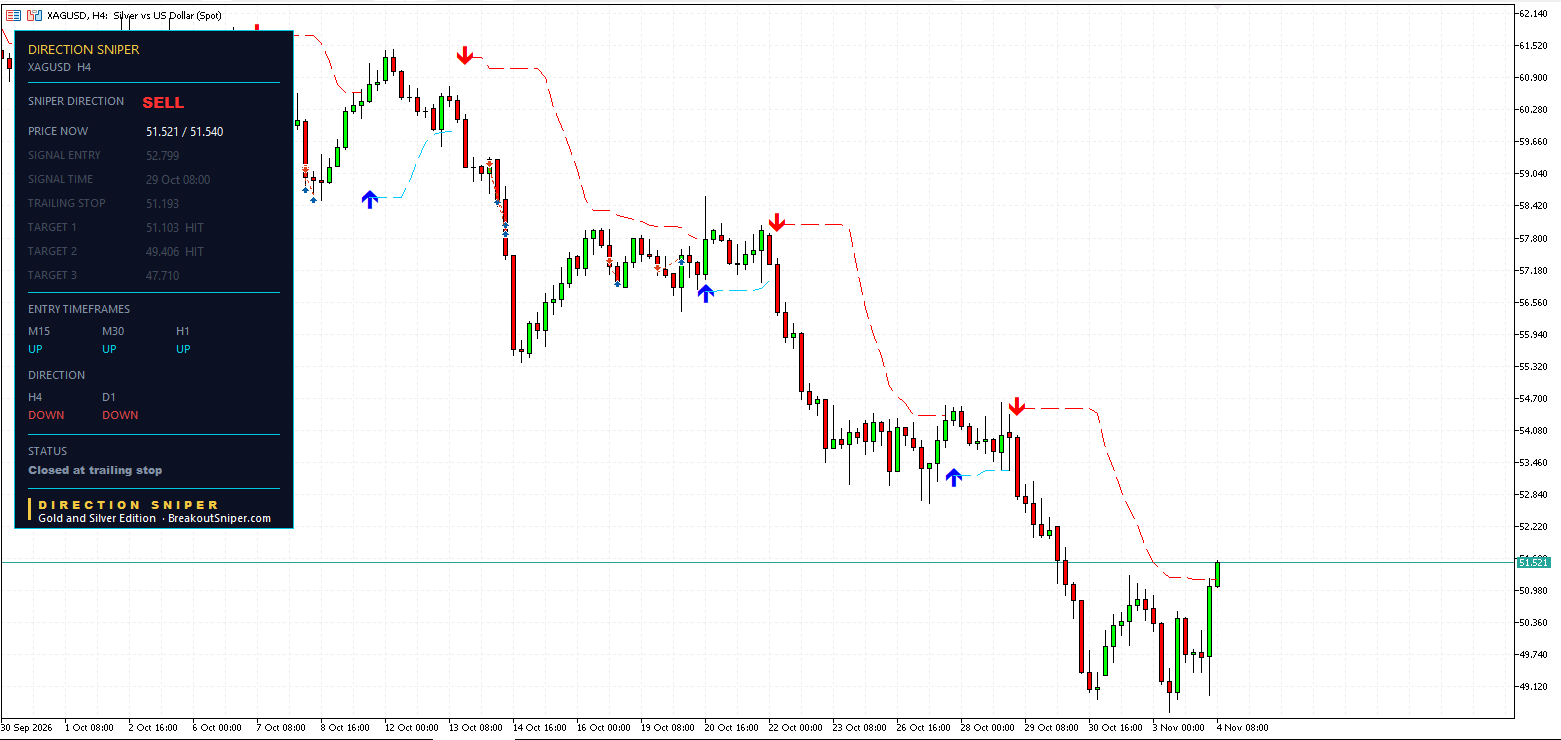
Silver 4 Hour
The silver 4 hour sell from 52.799 reached Target 1 at 51.103 and Target 2 at 49.406. Its trailing stop followed it down, from 54.495 to 53.335, to 51.346, and finally to 51.193.
When silver rallied, the ticket closed there, 160.6 cents in front of its entry.
The original risk on this ticket was $1.696 behind the entry. It finished $1.606 in front. Silver is now at 51.521, and the original stop at 54.495 is still nearly $3 above. Without the trailing stop, the full $50 of planned risk would still be exposed to this rally.
Silver 1 Hour
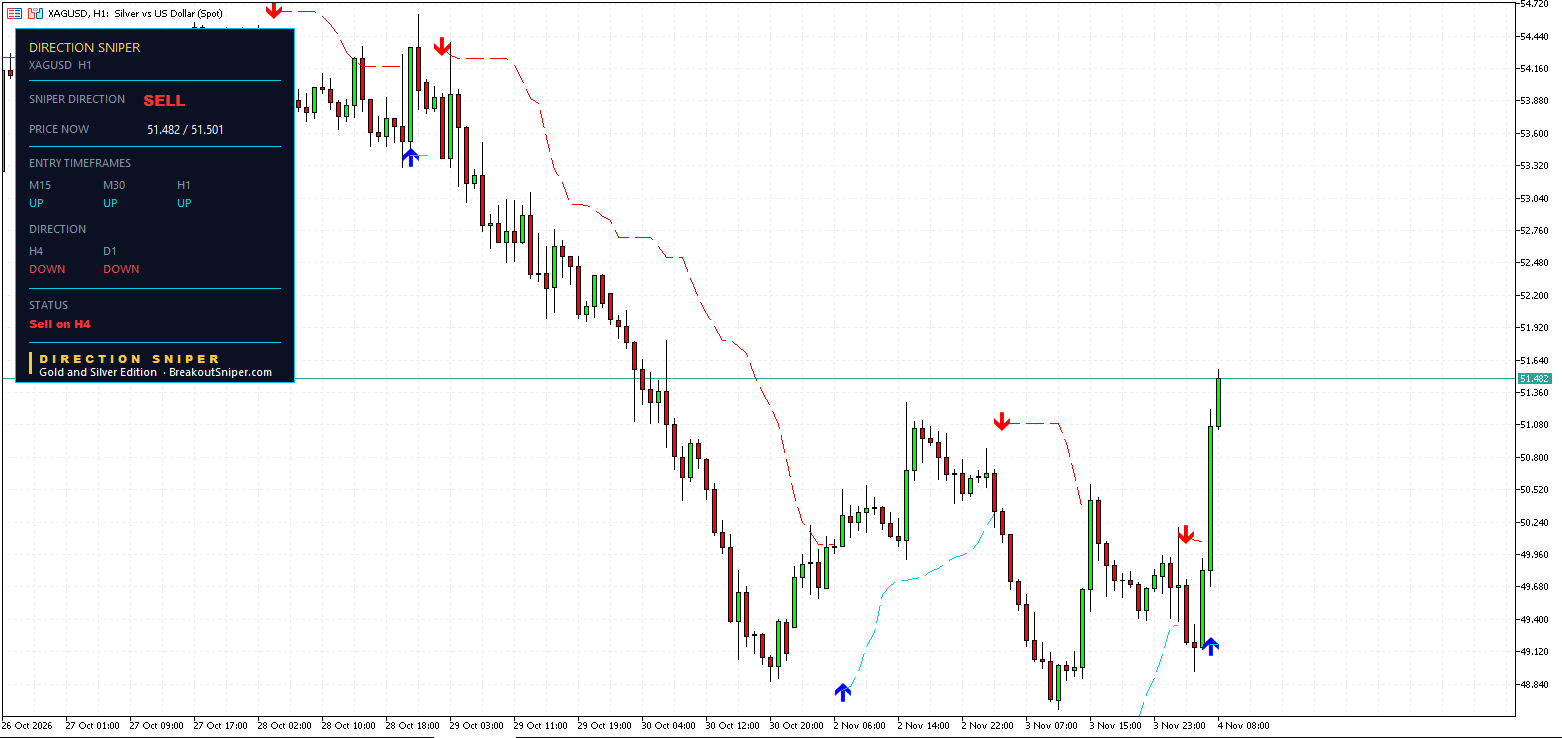
Yesterday’s fresh 1 hour sell from 50.129 reached Target 1 at 49.167 within hours. Its trailing stop then closed it close to the entry, read from the chart, before silver’s rally began.
So the silver 1 hour reached its first target and stepped aside early. When silver ran through 51 this morning, it was already out of the water.
What Silver Shows Now
Silver’s 4 hour and daily both still read DOWN, so the verdict is still SELL. But every entry chart has turned UP on the rally, and the status reads Sell on H4. There is no fresh entry. The panel is waiting for the faster charts to turn back down, or for the 4 hour to join the rally, which would move silver to NO TRADE as well.
6. The Answer: How Much Of The Rally Reached Us?
Here is the question from the start: of the four tickets, how many were still fully exposed when the big wave came?
None.
| Ticket | Planned risk at 0.5% | Where it finished |
|---|---|---|
| Gold H4 | $50 | 39.15 points in front of the entry |
| Silver H4 | $50 | 160.6 cents in front of the entry |
| Silver H1 | $50 | Target 1 reached, closed close to the entry |
| Gold H1 | $50 | Closed roughly 25 points behind, around $30 |
Four tickets, $200 of planned risk between them. Gold rallied around 130 points and silver more than $2.50. And the only cost from the whole move was the gold 1 hour, around $30, cut by the trailing stop before the rally really began.
That is the job of the stop loss. Not to be right about every move. To make sure that when a big wave comes, you have already stepped back from the water.
Every trailing stop level in this post was shown on the Direction Sniper panel as the trade developed. You move your own stop to match it. That is what the Gold and Silver Edition puts on your own charts.
7. What This Means For The US Dollar
In today’s Currency Strength Today read, the US dollar climbed from the bottom three to the middle of the board in a single day, and the scanner gives no call on the dollar.
Normally a firmer dollar would weigh on gold. Today, both rose together. When the dollar and gold stop moving in opposite directions, the old rules of thumb stop working, which is exactly why we trade gold on its own chart.
Today’s calendar also lists US jobs and services data this afternoon in GMT, which tend to move gold. Confirm the times on your own calendar before you act.
8. Gold Lot Size: The Rally Size Does Not Matter. The Stop Does.
We risk at most 2 percent per trade, usually 0.5 percent, so on a $10,000 account that is $50.
On most platforms, one standard lot of gold is 100 ounces, so a 1 point move is $100 per lot. Gold rallied around 130 points. At 1 full lot, that is $13,000. At 0.01 lots, it is $130.
The size of the rally only matters if your size was set by hope instead of by the stop. The gold 1 hour had a 41.89 point stop, so $50 of risk was about 0.01 lots. Sized that way, the worst this ticket could ever do was $50, and the trailing stop held it to around $30.
Here is how to calculate lot size for gold from any stop, or work it out in seconds with our free Gold and Silver Lot Size Calculator.
On a small account, a cent account makes the right sizes possible. For small balances we recommend a RoboForex Cent account or an XM Micro account. These are partner links, so we may receive a commission at no cost to you.
Lot size is the seatbelt. It does not stop the crash. It decides how badly you get hurt. If you are worrying about every trade, your lot size is still too big.
9. What Would Change The Gold And Silver Forecast
Gold: the panel stays on NO TRADE until the 4 hour and the daily agree again. If the 4 hour turns back DOWN, the SELL verdict returns. If the daily turns UP to join the 4 hour, the verdict becomes BUY.
Silver: the verdict stays SELL while the 4 hour and the daily both read DOWN. If the 4 hour turns UP, silver moves to NO TRADE, like gold.
Levels to watch, read from the chart:
- Gold: the 4,000 area, and the late October highs around 4,080
- Gold: the 3 November dip around 3,895
- Silver: the 51.50 area, and the late October highs around 54.50
The Wave, The Flag, And The Stop
Put the board together.
Metals rallied hard. Gold climbed above 4,000 and the panel stood aside, exactly as it said it would if the 4 hour turned against the daily. Silver still reads SELL on its bigger charts, with no fresh entry yet. And before the wave arrived, the gold and silver 4 hour tickets had both closed in front of their entries, the silver 1 hour had reached its first target, and the one ticket the rally caught cost around $30 of a planned $50.
That is Direction Sniper:
- Direction. One verdict from the 4 hour and the daily. When they disagree, it stands aside instead of guessing.
- Rallies and bounces that have not broken structure. Silver’s rally turned every entry chart UP. Its bigger charts did not turn.
- The stop loss. Every ticket arrives with its stop and three targets marked, and the trailing stop level shows you, every day, how much of the move you are still exposed to.
The Direction Sniper Gold and Silver Edition puts this panel on XAUUSD and XAGUSD, on MT4 or MT5.
See the Gold and Silver Edition
Today’s other reads: the full board in Currency Strength Today, and our Pick of the Day in the EUR CHF forecast, where two tickets reached all three targets. Yesterday’s tide story is in yesterday’s gold and silver price forecast. Every morning’s board lives on our Currency Strength Today page.
Want the next read in your inbox? Join The Daily Sniper Read, free, every trading day.
Gold and Silver Price Forecast Today: Frequently Asked Questions
Updated 4 November 2026. Levels are as shown on the Direction Sniper panel at the time of writing.
1What is the gold and silver price forecast today, 4 November 2026?+
Gold has moved to NO TRADE on the Direction Sniper panel, because the 4 hour has turned UP while the daily still reads DOWN. Silver still reads SELL, with its 4 hour and daily both DOWN.
Both metals rallied hard: gold from around 3,875 to above 4,000, and silver from around 49 to above 51.50.
2Why does gold show NO TRADE?+
The 4 hour and the daily decide the direction. The rally turned the gold 4 hour UP while the daily stayed DOWN, so the two disagree and the panel stands aside.
It waits until they agree again. If the 4 hour turns back DOWN, SELL returns. If the daily turns UP, the verdict becomes BUY.
3What happened to the gold 4 hour sell?+
The gold 4 hour sell from 4007.13 reached Target 1 at 3937.99, then closed at its trailing stop at 3967.98, 39.15 points in front of the entry, before the rally.
Gold is now back near the entry. Without the trailing stop, the ticket would still be open with its original stop at 4076.27.
4What happened to the silver 4 hour sell?+
The silver 4 hour sell from 52.799 reached Targets 1 and 2, then closed at its trailing stop at 51.193, 160.6 cents in front of the entry.
Its original risk was 169.6 cents behind the entry, so the trailing stop removed all of it before silver rallied.
5Did any ticket lose on the rally?+
Yes, one. The gold 1 hour sell from 3926.41 closed at its trailing stop roughly 25 points behind its entry, read from the chart, instead of 41.89 at its original stop.
On 0 of planned risk, that is around 0 instead of 0. It closed before gold went on to 4,000.
6Is silver still a sell?+
On the bigger charts, yes. The silver 4 hour and daily both read DOWN, so the verdict is SELL, but every entry chart has turned UP on the rally and there is no fresh entry.
If the silver 4 hour turns UP, silver will move to NO TRADE like gold.
7Why did gold rise with the US dollar?+
Normally a firmer dollar weighs on gold, but today both rose together. The dollar climbed from the bottom three to the middle of our currency strength board.
When the two stop moving in opposite directions, the old rule of thumb stops working, which is why we trade gold on its own chart.
8What lot size should I use on gold?+
We risk at most 2 percent per trade, usually 0.5 percent, which is 0 on a 0,000 account. At 00 per point per lot, a 41.89 point stop is about 0.01 lots.
Use the Gold and Silver Lot Size Calculator to work out your own size. These figures are arithmetic for illustration, not a recommendation about how much anyone should trade.
DIRECTION SNIPER GOLD AND SILVER EDITION
See gold and silver the moment a ticket prints.
Direction, entry, stop and three targets on XAUUSD and XAGUSD. MT4 or MT5.
Disclaimer: This post reports what the Direction Sniper panel showed on XAUUSD and XAGUSD on 4 November 2026. Prices will have moved by the time you read this. It is educational analysis, not financial advice and not a trade signal service, and nothing here is a recommendation to buy or sell. Price reaching a published target or stop level is not the same as a realised result. A target shown as reached, or a ticket shown as closed, describes the panel and does not describe anyone’s trade. Some closing levels are approximate readings from the chart. Dollar figures for risk and cost are arithmetic for illustration at 0.5 percent of a $10,000 account. Contract sizes and lot sizes vary by broker and are not a recommendation about how much anyone should trade. Trading gold and silver carries risk, and you should only trade money you can afford to lose.

