Currency Strength Today, 4 November 2026: Yesterday’s Pick Reached All Three Targets. Here Is What The Trailing Stop Did For Every Other Ticket
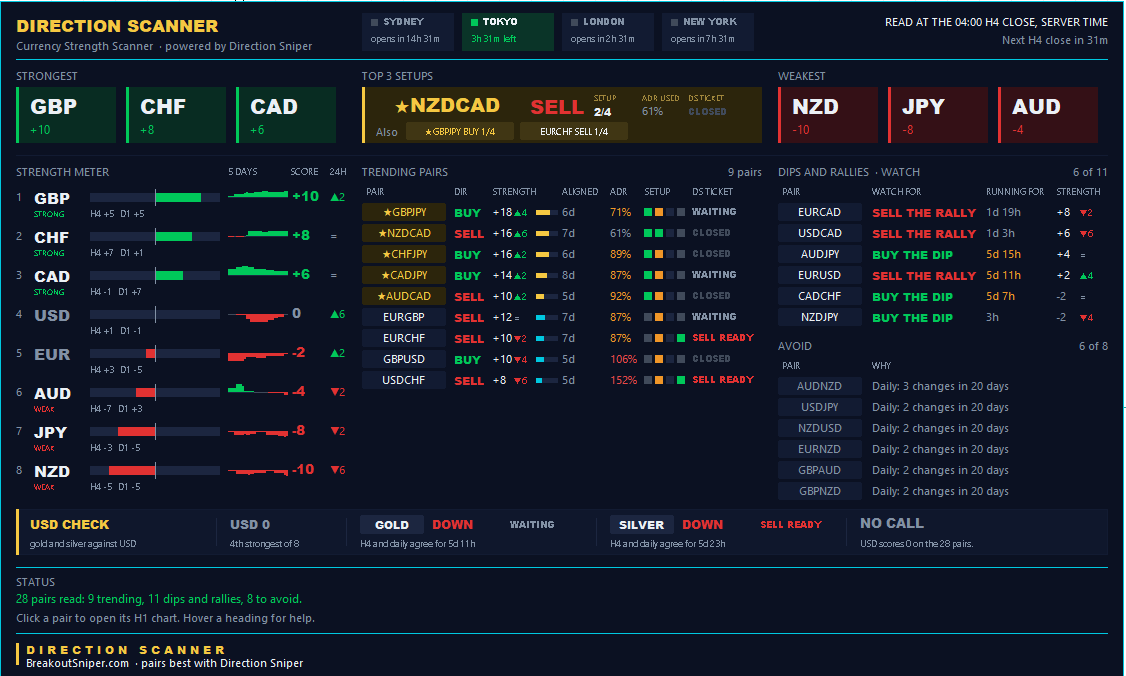
Currency strength today shows a board that changed hands overnight: the British pound now leads on its own, the New Zealand dollar has fallen to last, and the US dollar has climbed out of the bottom three in a single day. Yesterday’s Pick of the Day, CHFJPY, reached all three targets on the 1 hour. Here is the full board at a glance, then the story behind it.
Quick AnswerCurrency Strength Today, 4 November 2026StrongestGBP then CHF and CADWeakestNZD then JPY and AUDThe US dollar climbed out of the bottom three into the middle in a single day.Today’s Three Pairs · No Currency Shared★ EURCHF SELL
Pick of the DayNZDCAD SELLGBPJPY BUY✔ Yesterday’s Pick, CHFJPY: all three targets reached on the 1 hour.
🛡 Trailing stop: four other tickets now show their stop level in front of the entry.
Watch a rock climber for a minute and you will notice something.
They do not climb the whole wall and then clip in at the top. Every few metres, they stop, reach down, and clip the rope into the next anchor. It costs them a few seconds each time. And every clip changes one thing: how far they can fall.
At the bottom of the wall, a slip means a long drop. Halfway up, with the rope clipped in above their last step, the same slip means a short one. The wall has not changed. The climber has not changed. Only the last anchor has.
That is what a trailing stop does. And yesterday it was the most important thing on our board.
This currency strength today read covers the board, today’s three pairs and the dollar. But first, yesterday’s tickets: which ones reached their targets, and how far the rest can still fall. One of them did slip. By the end of section 1, you will see exactly how short the fall was.
1. What Changed Since Yesterday: Targets Reached, And A Shorter Fall
Yesterday’s Targets Reached
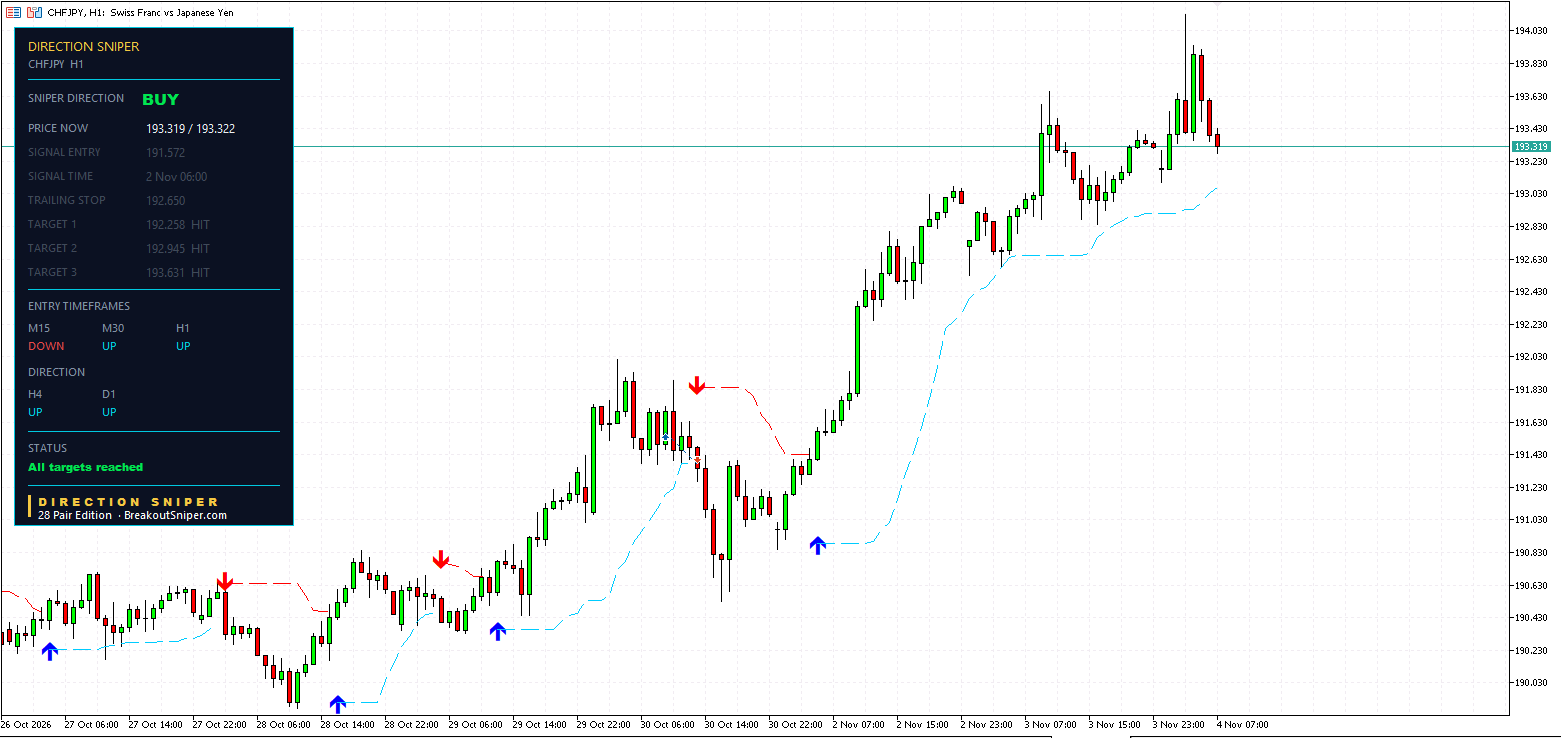
In yesterday’s currency strength read, our Pick of the Day was CHFJPY, with GBPUSD and NZDCAD alongside it. Here is what the panel shows this morning:
| Ticket | Targets reached |
|---|---|
| CHFJPY H1 BUY from 191.572 | All 3 targets, up to 193.631, 205.9 pips from the entry |
| CHFJPY H4 BUY from 190.708 | All 3 targets, reached before yesterday’s read |
| CHFJPY M30 BUY from 193.008 | Target 1 at 193.422 |
| GBPUSD H4 BUY from 1.33683 | Target 1 at 1.34555 |
| XAUUSD H4 SELL from 4007.13 | Target 1 at 3937.99 |
| XAGUSD H4 SELL from 52.799 | Targets 1 and 2 at 51.103 and 49.406 |
The CHFJPY 1 hour is the relay runner from yesterday’s CHF JPY forecast, the one we said was near the end of its leg with one target left. It finished the leg. CHFJPY pushed up to around 194.10 in the early hours of today, through Target 3 at 193.631, and the status now reads All targets reached.
Every one of those levels, the entry, the stop and all three targets, was on the panel before the move happened. Nobody drew them on afterwards. That is what the 28 Pair Edition puts on your own charts, on CHFJPY and 27 other pairs.
How The Trailing Stop Shrank The Fall
Reaching targets is the part everyone likes to show. The part that keeps an account alive is what happens when a trade turns. Here is where five of yesterday’s tickets stand this morning.
| Ticket | Original stop, behind the entry | Trailing stop now | Where it stands |
|---|---|---|---|
| XAUUSD H4 SELL from 4007.13 | 69.14 points | 3967.98, 39.15 points in front | Target 1 reached, closed at trailing stop in front of the entry |
| XAGUSD H4 SELL from 52.799 | $1.696 | 51.193, 160.6 cents in front | Targets 1 and 2 reached, running |
| GBPUSD H4 BUY from 1.33683 | 87.2 pips | 1.33918, 23.5 pips in front | Target 1 reached, running |
| NZDCAD H4 SELL from 0.78955 | 99.3 pips | 0.78704, 25.1 pips in front | Running, 75.8 pips below the entry |
| CHFJPY M30 BUY from 193.008 | 41.4 pips | 192.910, 9.8 pips behind | Target 1 reached, closed at trailing stop |
Now look at it the way the climber would.
When these five tickets printed, each one had its full fall ahead of it. At 0.5 percent risk on a $10,000 account, that is $50 per ticket, $250 in total, if every one had dropped all the way to its original stop.
This morning, four of them show their trailing stop in front of the entry. For anyone who moved their stop to the panel’s level, those four can no longer close at a loss. The fall below the entry is gone.
And the fifth, the one that slipped? The CHFJPY 30 minute reached Target 1 at 193.422, then pulled back and closed at its trailing stop at 192.910, 9.8 pips behind its entry instead of 41.4.
| CHFJPY 30 minute | At the original stop | At the trailing stop |
|---|---|---|
| Distance behind the entry | 41.4 pips | 9.8 pips |
| Cost on $50 of planned risk | $50.00 | about $11.84 |
The trailing stop cut the fall by more than three quarters. Of $250 of planned risk across five tickets, the only cost so far is about $11.84, and the other four have no fall left below their entries.
That is the anchor clipped in above your last step. The Direction Sniper panel shows the trailing stop level on every ticket, on every chart, so you always know how far the trade can still fall. You move your own stop to match it.
GBPUSD: The Wait Paid Off
GBPUSD was the pair waiting for its 1 hour yesterday. The 1 hour joined overnight, the status now reads Buy on M30, H1, H4, and the 4 hour has reached Target 1 at 1.34555. Waiting for the rest of the team to come out of the tunnel cost nothing, and the panel showed exactly when they did.
The Table
| Group | Yesterday | Today |
|---|---|---|
| Strongest | GBP and CHF level, then CAD | GBP, then CHF, then CAD |
| Weakest | USD and JPY level, then EUR | NZD, then JPY, then AUD |
| Middle | AUD and NZD | USD and EUR |
Two big moves. The US dollar climbed from the bottom three into the middle in a single day, the biggest jump on the board. And the New Zealand dollar fell all the way to last.
2. This Morning’s Board
The banner at the top of this post is this morning’s Direction Scanner, the tool we built to read all 28 pairs at once on the 4 hour and the daily. It is still under development, and we use it in public every day, misses included.
| Group | Currencies |
|---|---|
| Strongest | GBP, then CHF, then CAD |
| Middle | USD and EUR |
| Weakest | NZD, then JPY, then AUD |
Nine pairs are trending this morning, meaning the 4 hour and the daily agree. Eleven are in dips and rallies, where the bigger charts disagree. And eight are on the avoid list, because their bigger charts keep changing their mind.
The Biggest Gap On The Board, And Why We Are Leaving It Alone
On paper, the best fixture today is GBPNZD: the strongest currency against the weakest. No pair has a wider gap between its two sides.
And it is on the avoid list. Its daily chart has changed direction twice in the last 20 days.
Think of the climbing wall again. A wall with the best view is no use if the rock keeps crumbling. A strong currency against a weak one only matters if the bigger chart holds its direction long enough to climb. On GBPNZD, it has not. So the widest gap on the board is the pair we are leaving alone. Checking 28 daily charts for this by hand every day would take an hour. The Direction Scanner does it at a glance, which is exactly why we built it.
We explain why the strongest against the weakest is only the starting point in our guide to strong vs weak currency pairs.
3. Today’s Three Pairs: Six Currencies, No Overlap
We only pick from the trending list, and each currency is used only once. Today, the scanner’s Top 3 fits both:
| Pair | Strong side | Weak side | Bigger charts agreed for | Daily move used |
|---|---|---|---|---|
| EURCHF SELL | CHF | EUR | 7 days | about 87% |
| NZDCAD SELL | CAD | NZD | 7 days | about 61% |
| GBPJPY BUY | GBP | JPY | 6 days | about 71% |
Since the morning read, all three have printed a ticket. Each tells a different story.
Pick Of The Day: EURCHF, The Most Room
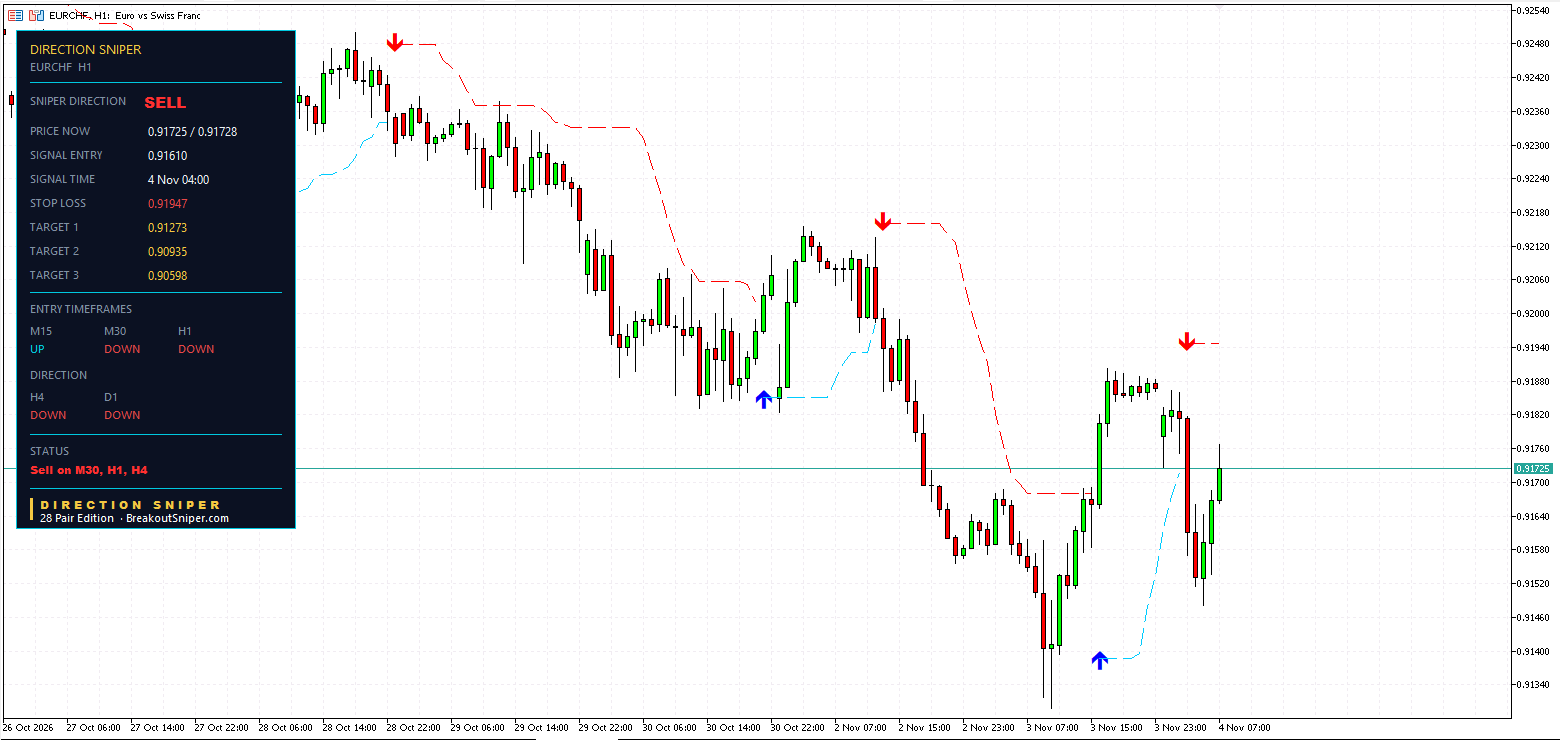
The 1 hour sell printed at 04:00 at 0.91610.
- Stop: 0.91947
- Target 1: 0.91273
- Target 2: 0.90935
- Target 3: 0.90598
EURCHF has bounced since, to 0.91725, about 11.5 pips above the entry. From there, the stop is 22.2 pips away and Target 1 is 45.2 pips away. Of today’s three, that is the most room for someone arriving now.
On the 1 hour chart, every rally since late October has stopped lower than the last: around 0.9248 on 28 October, around 0.9215 on 2 November, around 0.9190 on 3 November. The status reads Sell on M30, H1, H4, with only the 15 minute still bouncing. For every timeframe, read today’s EUR CHF forecast.
NZDCAD: The Anchor Already Clipped
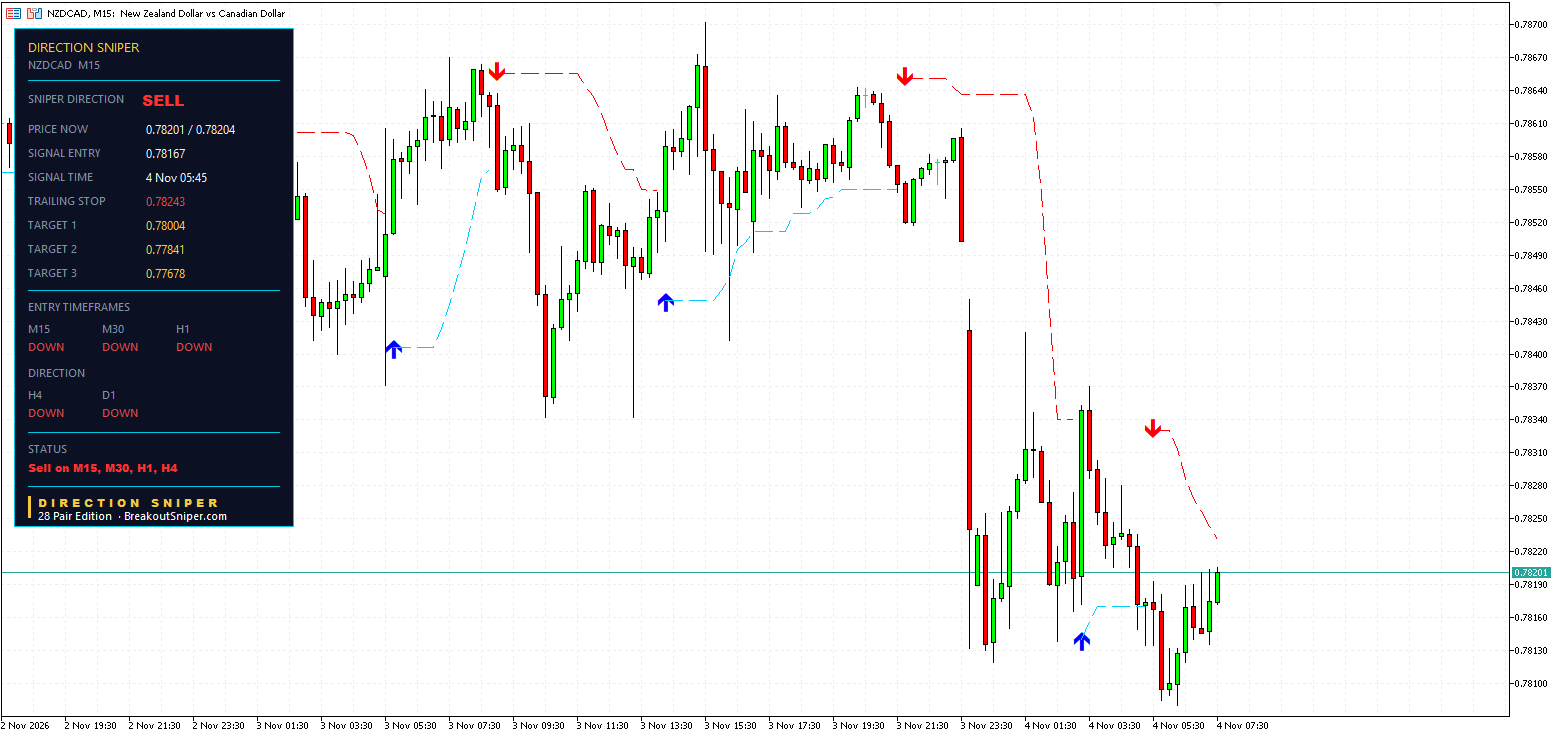
The 15 minute sell printed at 05:45 at 0.78167, with every timeframe reading DOWN. Its original stop was 0.78330, 16.3 pips above the entry. The panel’s trailing stop already shows 0.78243, so the fall from the entry is already down to 7.6 pips.
- Target 1: 0.78004
- Target 2: 0.77841
- Target 3: 0.77678
NZDCAD is at 0.78201, just above the entry, and the trailing stop is only 4.2 pips away. A tight anchor, which matters for section 5.
GBPJPY: Biggest Gap On The Trending List, Still Waiting
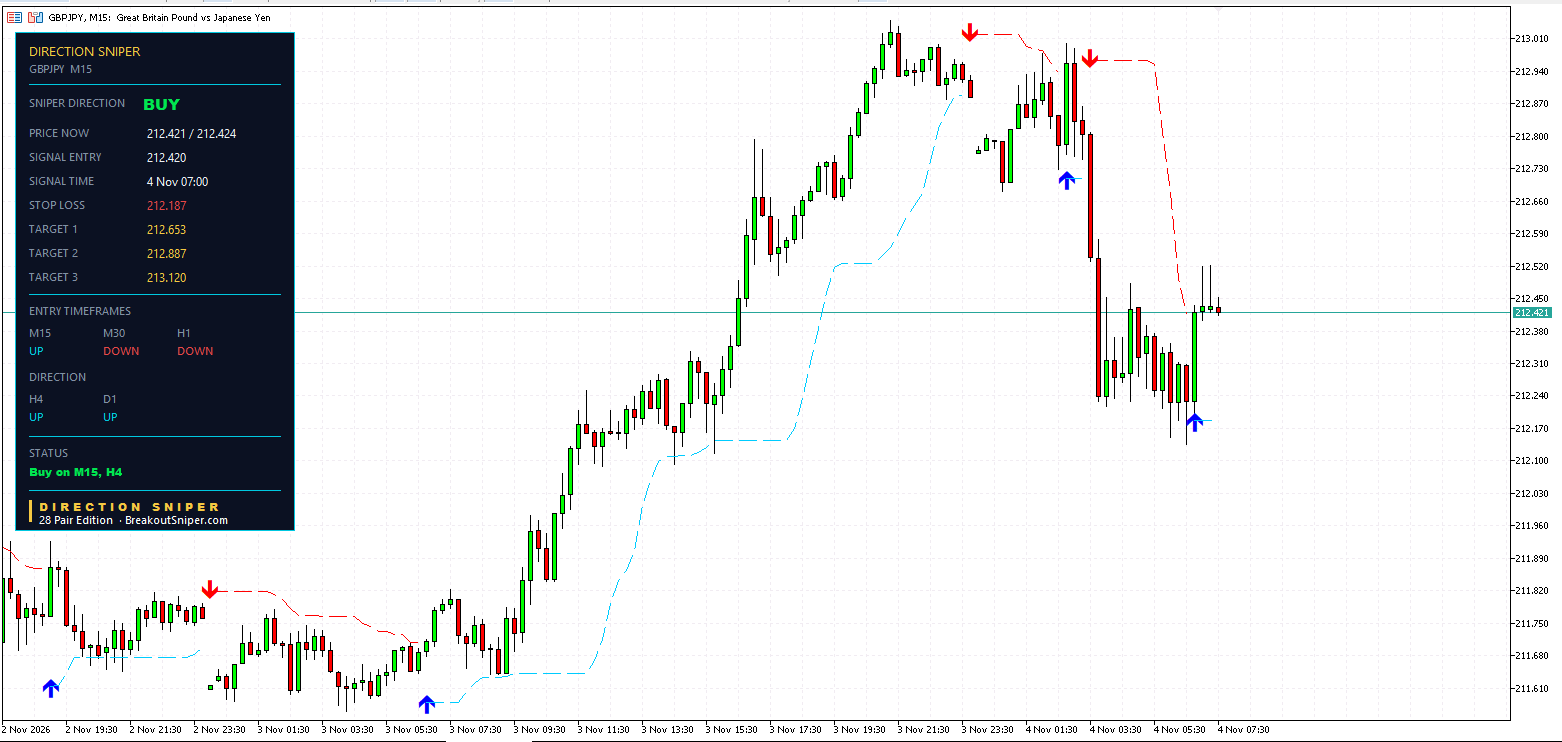
GBPJPY has the widest gap of any trending pair. The 15 minute buy printed at 07:00 at 212.420, with its stop at 212.187 and Target 1 at 212.653.
But the 30 minute and the 1 hour still read DOWN, so the status reads Buy on M15, H4. Like GBPUSD yesterday, one fast chart has turned first. The setup is complete when the 1 hour joins.
These are the pairs we are watching, not trade recommendations.
4. News Watch
Think of news as weather on the climbing wall. The route does not change, but a gust can shake you off a hold you would normally keep.
Here is what is on the calendar today, in GMT:
| Time (GMT) | Event | Currency | Today’s pair it touches |
|---|---|---|---|
| 10:00 | Eurozone flash inflation | EUR | EURCHF, our Pick of the Day |
| 13:15 | US ADP employment report | USD | None of today’s three, but gold and silver |
| 13:30 | US trade balance | USD | None of today’s three |
| 15:00 | US ISM services PMI | USD | None of today’s three, but gold and silver |
The one to watch is the Eurozone inflation figure at 10:00 GMT, because it lands directly on the euro side of EURCHF. A surprise in either direction can move the pair sharply for a few minutes, and a stop that sits inside that wobble can be reached even when the bigger trend does not change.
The three US releases do not touch any of today’s pairs. But the dollar has just climbed from the bottom of the board to the middle, and gold and silver react to US data, so they matter for today’s Gold Check.
Release times can change, so confirm them on your own calendar before you act. If you are holding a ticket through a release, the lesson in section 6 matters even more.
5. USD Check: No Call
The US dollar is now 4th of 8, right in the middle, after climbing from the bottom three in a single day. With the dollar sitting at neither end, the scanner gives no call on the dollar today.
Gold and silver still read DOWN on the 4 hour and the daily, and both have for more than five days. The gold 4 hour sell closed at its trailing stop 39.15 points in front of its entry, after reaching Target 1. Gold is bouncing again on its faster charts, and the panel is waiting. Silver’s 4 hour sell is still running, with Targets 1 and 2 reached and its trailing stop 160.6 cents in front of the entry.
For every gold and silver timeframe, read today’s gold and silver price forecast.
6. Lesson Of The Day: A Tight Anchor Means A Bigger Lot
Every ticket gets the same risk. We risk at most 2 percent per trade, usually 0.5 percent, so on a $10,000 account that is $50, whichever pair it is.
Here is what that means for today’s three, measured from where price is now:
- NZDCAD, with the trailing stop 4.2 pips away: one pip on a standard lot is 10 Canadian dollars, roughly $7.16, so $50 of risk is about 1.66 lots.
- EURCHF, with the stop 22.2 pips away: one pip is 10 Swiss francs, roughly $12, so $50 of risk is about 0.18 lots.
- GBPJPY, with the stop 23.4 pips away: one pip is 1,000 yen, roughly $6.33, so $50 of risk is about 0.33 lots.
Look at NZDCAD. 1.66 lots looks enormous next to 0.18. But it is the same $50. A tight stop does not mean less risk. It means a bigger lot for the same risk, and a stop that the normal spread and wobble of a 15 minute chart can reach very quickly.
That is the climber’s trade off. Clip the rope close and the fall is short, but you will feel every slip. Clip it further away and the fall is longer, so you carry less weight. Either way, the size is set by the stop, never the other way round. Always round down, never up.
Work out your own size in seconds with our free EURCHF Lot Size Calculator. It covers all 28 pairs, gold, silver, Bitcoin and Ethereum.
On a small account, a cent account makes the right sizes possible. For small balances we recommend a RoboForex Cent account or an XM Micro account. These are partner links, so we may receive a commission at no cost to you.
If you are worrying about every trade, your lot size is still too big.
Every Anchor, Every Day
Put the morning together.
The New Zealand dollar fell to last, the US dollar climbed to the middle, and the pound now leads on its own. The widest gap on the board, GBPNZD, stays on the avoid list. Today’s three pairs, EURCHF, NZDCAD and GBPJPY, use six currencies and share none.
Yesterday’s Pick of the Day, CHFJPY, reached all three targets on the 1 hour. And the rest of yesterday’s tickets showed what the climber knows. Of five tickets with $250 of planned risk between them, four now show their trailing stop in front of the entry, and the one that slipped fell 9.8 pips instead of 41.4.
That is Direction Sniper:
- Direction. One verdict from the 4 hour and the daily. On today’s three pairs, it reads SELL, SELL and BUY.
- Rallies and bounces that have not broken structure. EURCHF bounced above its entry this morning. Its bigger charts did not turn.
- The stop loss. Every ticket arrives with its stop and three targets marked, and the trailing stop level shows you, every day, how far the trade can still fall.
The Direction Scanner shows you which pairs to watch. The 28 Pair Edition gives you what the scanner alone does not: the entry, the stop and three targets on EURCHF, NZDCAD, GBPJPY and every other major, minor and cross, MT4 or MT5, on one licence.
The Direction Scanner is something we are building to manage and scan the 28 pairs ourselves. It is still in development, and we use it in public, with full transparency. If something on the board is confusing, or you would like it to show something it does not, tell us. Reply to any Daily Sniper Read email, and every message gets read.
Every morning’s board lives on our Currency Strength Today page. Want it in your inbox? Join The Daily Sniper Read, free, every trading day.
Currency Strength Today: Frequently Asked Questions
Updated 4 November 2026. Levels are as shown on the Direction Scanner and the Direction Sniper panel at the time of writing.
1What is the currency strength today, 4 November 2026?+
The strongest currency is the British pound, then the Swiss franc and the Canadian dollar. The weakest is the New Zealand dollar, then the Japanese yen and the Australian dollar.
The US dollar climbed from the bottom three into the middle in a single day, the biggest move on the board.
2Did yesterday’s CHFJPY pick reach its targets?+
Yes. The CHFJPY 1 hour BUY from 191.572 reached all three targets, up to 193.631, a move of 205.9 pips from the entry. The CHFJPY 4 hour had already reached all three targets before yesterday’s read.
Every level was on the Direction Sniper panel before the move happened. A target shown as reached describes the panel, not anyone’s trade.
3What is the best forex pair to trade today?+
Our Pick of the Day is EURCHF, the weak euro against the strong Swiss franc, with a SELL ticket from 0.91610 on the 1 hour. The stop is 0.91947 and Target 1 is 0.91273.
From 0.91725, the stop is 22.2 pips away and Target 1 is 45.2 pips away, the most room of today’s three. This is the pair we are watching, not a trade recommendation.
4Which forex pairs are trending best today?+
We only pick from pairs where the 4 hour and the daily agree, and each currency is used only once. On 4 November 2026 that gives EURCHF SELL, NZDCAD SELL and GBPJPY BUY.
Six currencies, none shared. The Australian dollar and the US dollar are left out.
5Why not GBPNZD, the strongest against the weakest?+
GBPNZD has the widest gap on the board, but it is on our avoid list because its daily chart has changed direction twice in the last 20 days.
A strong currency against a weak one only matters if the bigger chart holds its direction. On GBPNZD it has not.
6What did the trailing stop do on yesterday’s tickets?+
Of five tickets we checked, with $50 of planned risk each, four now show their trailing stop in front of the entry: the gold 4 hour, the silver 4 hour, the GBPUSD 4 hour and the NZDCAD 4 hour.
The CHFJPY 30 minute reached Target 1, then closed at its trailing stop 9.8 pips behind the entry instead of 41.4, a cost of about $11.84 instead of $50.
7Did yesterday’s GBPUSD reach its target?+
Yes. The GBPUSD 4 hour buy from 1.33683 has reached Target 1 at 1.34555, and its trailing stop is 1.33918, 23.5 pips in front of the entry.
The 1 hour joined overnight, so the status now reads Buy on M30, H1, H4.
8Is the US dollar weak today?+
Not any more. After three trading days at the bottom, the dollar is now 4th of 8, in the middle of the board.
With the dollar at neither end, the Direction Scanner gives no call on the dollar today.
9Why is the NZDCAD lot size so big?+
With the NZDCAD trailing stop only 4.2 pips from price, $50 of risk works out at about 1.66 lots. The same $50 on EURCHF, with a 22.2 pip stop, is about 0.18 lots.
A tight stop means a bigger lot for the same risk. Use the EURCHF Lot Size Calculator to work out your own size. These figures are arithmetic for illustration, not a recommendation.
DIRECTION SNIPER 28 PAIR EDITION
See EURCHF and 27 more pairs the moment a ticket prints.
Direction, entry, stop and three targets on all 28 pairs. MT4 or MT5, one licence.
Disclaimer: This post reports what the Direction Scanner and the Direction Sniper panel showed on 4 November 2026. The tickets were running at the time of writing, and prices will have moved by the time you read this. It is educational analysis, not financial advice and not a trade signal service, and nothing here is a recommendation to buy or sell. Price reaching a published target or stop level is not the same as a realised result. A target shown as reached, or a ticket shown as closed, describes the panel and does not describe anyone’s trade. Dollar figures for risk and cost are arithmetic for illustration at 0.5 percent of a $10,000 account. High and low levels are approximate readings from the chart. Pip values and lot sizes depend on the exchange rate and are not a recommendation about how much anyone should trade. Forex trading carries risk, and you should only trade money you can afford to lose.

