EUR USD Forecast Today, 28 October 2026: The Bounce Was Over. Eight Targets Reached Since Our 23 October Post
This EUR USD forecast today is the answer to a question we asked five days ago.
On 23 October we wrote is the EURUSD bounce over? EURUSD had bounced for a whole week, up to around 1.1265, and on a fast chart it looked a lot like a reversal. But the Direction Sniper board had just turned back to Sell on M15, M30, H1, H4. The 4 hour had printed a fresh sell at 1.12053, and when we wrote that post, price was 8 pips behind it.
We called it a setup day, not a results day.
This is the results day. Since that post, eight EURUSD targets have been reached. The 4 hour sell has reached two of its three targets, a 30 minute sell has completed its whole plan, and EURUSD is around 1.1121, back at the mid October low.
The status still reads Sell on M15, M30, H1, H4. Here is how the move unfolded, and the trap waiting at this level.
1. The 4 Hour Sell: Fresh On 23 October, Two Targets Reached Now
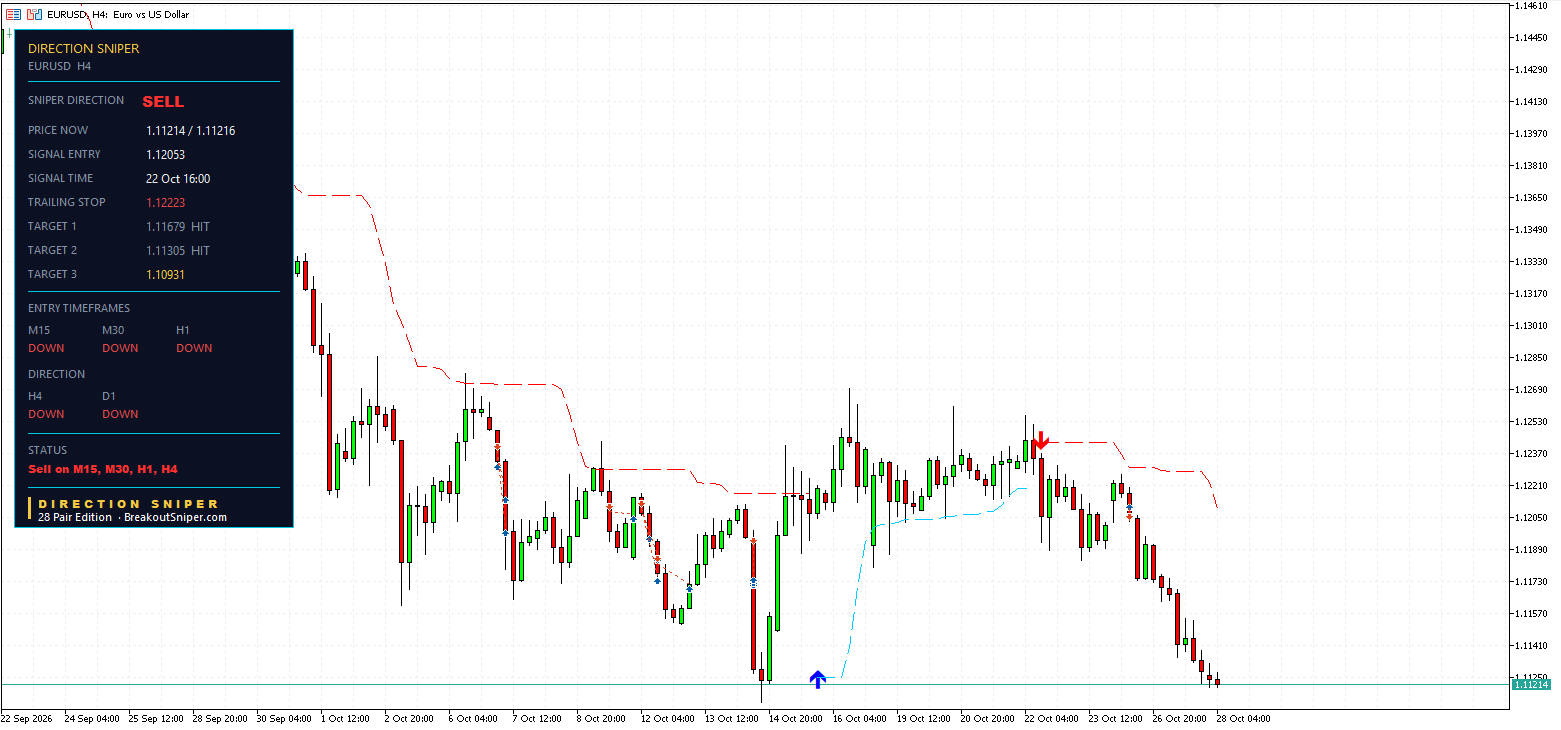
| Level | |
|---|---|
| Entry, sell | 1.12053 (22 Oct 16:00) |
| Original stop | 1.12427, so 37.4 pips of risk |
| Target 1 | 1.11679, reached |
| Target 2 | 1.11305, reached |
| Target 3 | 1.10931 |
| Trailing stop now | 1.12223 |
This is the same ticket we showed in the 23 October post. Back then it was a few hours old and slightly behind. Since then EURUSD has fallen to around 1.1121, about 84 pips below the entry, and the 4 hour has reached Target 1 and Target 2.
Nothing about it changed after we published. The entry, the stop and all three targets were on the panel before the move. That is the point of publishing the read before the result.
2. Every Entry Chart Joined In
Once the 4 hour and the daily both pointed down, the direction was confirmed as SELL, and every entry chart became trigger ready on its own. As EURUSD kept falling, the faster charts lined up one after another, and each printed its own ticket.
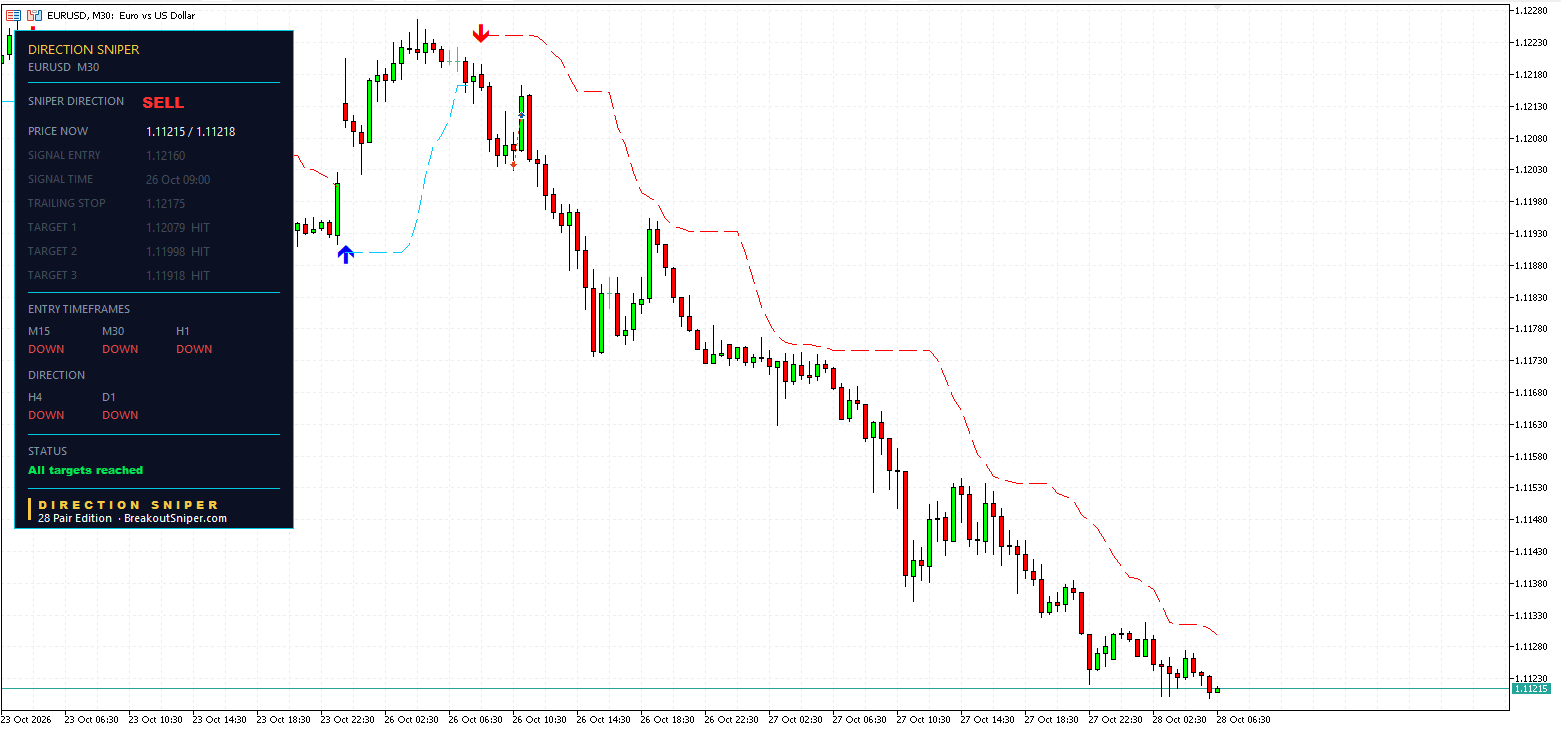
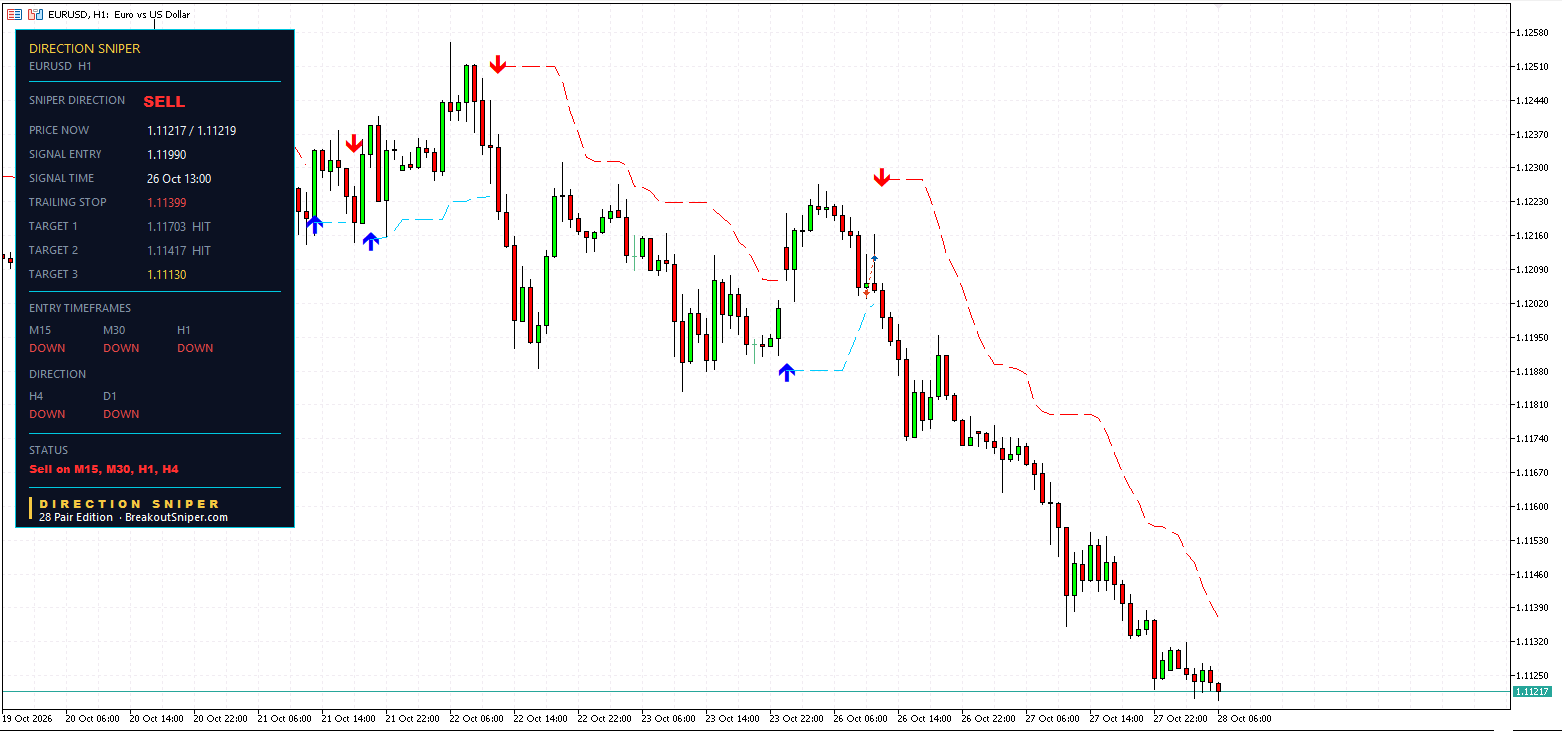
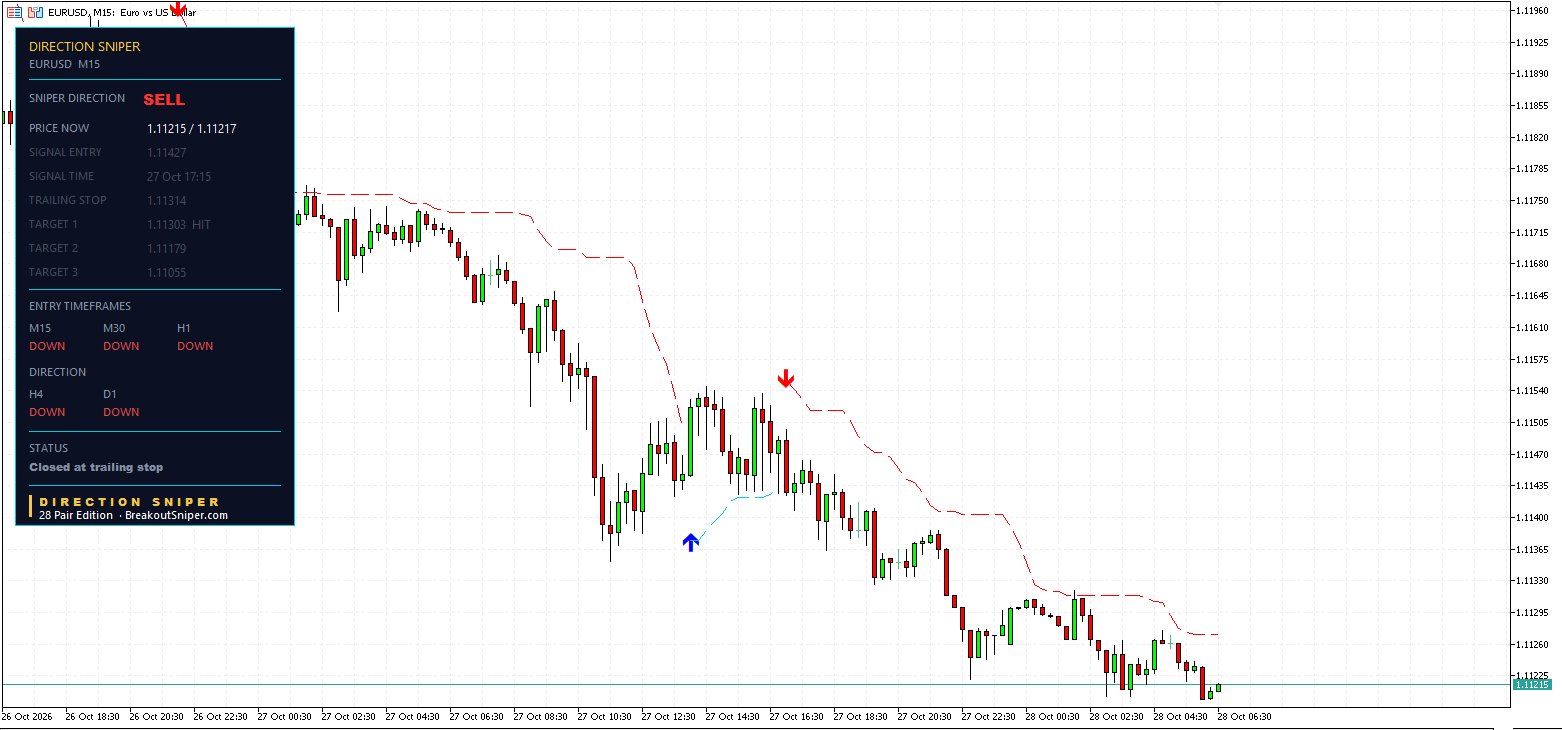
| Chart | Lined up at | Entry | Risk | Targets | State |
|---|---|---|---|---|---|
| M30 | 26 Oct 09:00 | 1.12160 | 8.1 pips | 1.12079, 1.11998, 1.11918, all reached | All targets reached |
| H1 | 26 Oct 13:00 | 1.11990 | 28.7 pips | 1.11703 reached, 1.11417 reached, 1.11130 | Running |
| M15 | 27 Oct 17:15 | 1.11427 | 12.4 pips | 1.11303 reached, 1.11179, 1.11055 | Closed at trailing stop, 11.3 pips in front of entry |
Add them up: two targets on the 4 hour, three on the 30 minute, two on the 1 hour and one on the 15 minute. Eight targets reached since our 23 October post.
The 30 minute sold at 1.12160 on Monday morning with a stop just 8.1 pips above. EURUSD fell through all three targets, a distance of 24.2 pips from entry to Target 3, three times what the ticket risked. Status: All targets reached.
The 1 hour sold at 1.11990 a few hours later and has reached Target 1 and Target 2. Price is about 77 pips below its entry.
The 15 minute sold at 1.11427 on Tuesday evening and reached Target 1 at 1.11303. Then EURUSD paused, and the ticket closed at its trailing stop at 1.11314. That is 11.3 pips in front of its entry, after one target.
3. The Trap: “It Is Back At The Low, So It Must Bounce”
Now look at where EURUSD is sitting. Around 1.112 is roughly where it turned in mid October, right before the week long bounce.
That level is where two common mistakes happen:
- Buying the “support”. Price is back at the old low, the low held last time, so a trader buys it expecting the same bounce again
- Deciding it is too late to sell. EURUSD has already fallen more than 130 pips from the bounce high, so the move “must be over”
Both mistakes come from guessing where the floor is. A level that held once is not a promise that it holds again.
The panel does not guess. Every EURUSD timeframe, from the 15 minute to the daily, still reads DOWN. There is no BUY verdict, so there are no buy tickets, however tempting the old low looks. And if the low does hold and EURUSD bounces, the panel will show it the same way it did last week: the fast charts turn first, and the verdict only changes if the 4 hour turns too.
4. The Trailing Level: What Is Protected, And What Is Not
The most useful thing on today’s board is how differently the trailing levels look after the targets.
The 1 hour trailing stop is at 1.11399. That is 59.1 pips in front of its entry, and it now sits just below the level of Target 2. If EURUSD bounced from here, that ticket would end well in front of where it started.
The 15 minute already showed what that looks like. It reached one target, EURUSD paused, and it closed at its trailing level, in front of its entry.
The honest part is the 4 hour. Its trailing stop has come down from 1.12427 to 1.12223, which removes more than half of the original risk. But it still sits 17.0 pips behind the entry. Two targets reached, and the stop not yet crossed. A 4 hour structure moves slowly, so the trailing level lags well behind the price.
That is why reaching targets and protecting a ticket are two different things. The panel shows you both, so you always know which ticket is in front and which is not. Remember the panel shows the trailing level. Moving your own stop order is up to you.
5. Currency Strength: The 3 Strongest And 3 Weakest
EURUSD is not falling on its own. Looking across all 28 pairs we follow, here is what we observe this morning:
| Strongest currencies | Weakest currencies |
|---|---|
| Canadian dollar (CAD) | Euro (EUR) |
| New Zealand dollar (NZD) | Japanese yen (JPY) |
| Australian dollar (AUD) | Swiss franc (CHF) |
Three things stand out:
- The euro is the weakest currency on the board, by a long way. All seven euro pairs, from EURUSD and EURGBP to EURJPY and EURCAD, read SELL
- The US dollar sits in the middle. That matters for anyone trading EURUSD. This fall is mostly about a weak euro, not a strong dollar
- The yen and the Swiss franc are weak too. AUDJPY, NZDJPY and CADJPY all read BUY, and so do GBPCHF, NZDCHF and CADCHF
Why this helps. The cleanest trends usually come from pairing a strong currency with a weak one. Two strong currencies against each other, or two weak ones, tend to give a messier chart.
So here are the combinations we are watching today: each of the three strongest currencies against each of the three weakest, and what the Direction Sniper verdict says on each pair.
| Pair | Strong side | Weak side | Direction Sniper verdict |
|---|---|---|---|
| EURCAD | CAD | EUR | SELL |
| EURNZD | NZD | EUR | SELL |
| EURAUD | AUD | EUR | SELL |
| CADJPY | CAD | JPY | BUY |
| NZDJPY | NZD | JPY | BUY |
| AUDJPY | AUD | JPY | BUY |
| CADCHF | CAD | CHF | BUY |
| NZDCHF | NZD | CHF | BUY |
| AUDCHF | AUD | CHF | NO TRADE |
Eight of the nine combinations have a verdict pointing the same way as currency strength. The pairs with the euro on the weak side stand out most, because the euro is the weakest currency by a long way: EURCAD, EURNZD and EURAUD.
Notice AUDCHF. On paper it pairs a strong currency with a weak one, yet the panel reads NO TRADE, because its 4 hour and daily disagree. That is the point of using both. Currency strength tells you where to look. The panel tells you whether that pair is actually lined up.
And a verdict is not an entry. On any of these pairs, wait for an entry chart to line up and print its own ticket, with its stop already marked.
This is a snapshot, not a forecast. Currency strength changes as the charts change, so check it on the day you trade.
One Weak Currency, Many Trades
A weak currency also hides a sizing trap. If you sell EURUSD, EURGBP and EURJPY together, you have not taken three different trades. You have taken one bet on the euro, three times. If the euro bounces, all three can reach their stops in the same move.
So size them as one. At 0.5 percent of a $10,000 account, which is $50 of risk, and about $10 per pip on a standard EURUSD lot:
| Chart | Stop distance | Lot size for $50 of risk |
|---|---|---|
| M30 | 8.1 pips | about 0.62 lots |
| M15 | 12.4 pips | about 0.40 lots |
| H1 | 28.7 pips | about 0.17 lots |
| H4 | 37.4 pips | about 0.13 lots |
A wider stop simply means a smaller lot, and the risk stays the same.
On a small account, a cent account makes the right size possible. For small balances we recommend a RoboForex Cent account or an XM Micro account. These are partner links, so we may receive a commission at no cost to you.
We risk at most 2 percent per trade, usually 0.5 percent. If you are worrying about every trade, your lot size is still too big.
6. What To Watch
The levels that matter:
- The next targets below: 1.11130 on the 1 hour, about 9 pips below price, then 1.10931 on the 4 hour
- The 1 hour trailing stop at 1.11399, the closest level above price
- The 4 hour trailing stop at 1.12223, the level that would close the main ticket
- The mid October low around 1.112, where EURUSD is sitting now
What would change the picture: if the 4 hour turned UP while the daily stayed DOWN, the verdict would move to NO TRADE and the panel would stand aside, exactly as it did during last week’s bounce. Today every timeframe reads DOWN.
Nobody knows whether the October low holds this time. The panel shows you where each ticket ends, and where the next targets sit.
Published Before The Move
Put the two posts together.
On 23 October EURUSD had just finished a week long bounce that looked like a reversal. The panel said the bounce was over, the 4 hour printed a sell, and we published it while it was still behind. Five days later, eight targets have been reached, and every timeframe still reads SELL.
That is what Direction Sniper gives a EURUSD trader:
- Direction. One verdict from the 4 hour and the daily. Through the bounce it stood aside, and once the two charts agreed again, it never stopped saying SELL.
- Rallies that have not broken structure. A week long bounce turned the fast charts, but it never turned the daily. The panel showed that before the move resumed.
- The stop loss. Every ticket arrives with its stop marked, and the trailing level shows which tickets are already in front of their entry.
The Direction Sniper 28 Pair Edition puts this exact panel on EURUSD and 27 other pairs, MT4 or MT5, on one licence.
Want a read like this in your inbox? Join The Daily Sniper Read, free, every trading day.
EUR USD Forecast Today: Frequently Asked Questions
What is the EUR USD forecast today, 28 October 2026?
The Direction Sniper panel reads SELL on EURUSD, because the 4 hour and the daily both point down. Every entry chart also reads DOWN, so the status shows Sell on M15, M30, H1, H4.
EURUSD was around 1.1121 at the time of writing, back near the mid October low.
Was the EURUSD bounce over?
On 23 October we asked that question, after a week long bounce to around 1.1265. The panel had just turned back to SELL, and the 4 hour printed a sell at 1.12053 that was 8 pips behind when we published.
Five days later that ticket has reached two of its three targets, and EURUSD is about 84 pips below its entry.
Which EURUSD targets were reached since 23 October 2026?
Eight in total. The 4 hour reached 1.11679 and 1.11305, the 30 minute reached all three of 1.12079, 1.11998 and 1.11918, the 1 hour reached 1.11703 and 1.11417, and the 15 minute reached 1.11303.
Price reaching a published target level is not the same as a realised result.
Should you buy EURUSD at the October low?
The panel prints no buy tickets while the verdict is SELL, and every EURUSD timeframe still reads DOWN. A level that held once is not a promise that it holds again.
If EURUSD bounces, the fast charts will turn first, and the verdict only changes if the 4 hour turns UP as well.
Why is the EURUSD 4 hour trailing stop still behind its entry?
Its trailing stop has come down from 1.12427 to 1.12223, which removes more than half of the original risk, but it still sits 17.0 pips behind the 1.12053 entry.
A 4 hour structure moves slowly, so its trailing level lags well behind price. The 1 hour trailing stop at 1.11399, by contrast, is 59.1 pips in front of its entry.
Which currencies are strongest and weakest on 28 October 2026?
Looking across all 28 pairs, we observed the Canadian dollar, the New Zealand dollar and the Australian dollar as the strongest currencies. The euro, the Japanese yen and the Swiss franc were the weakest.
This is a snapshot, not a forecast. Currency strength changes as the charts change.
Which pairs combine a strong and a weak currency on 28 October 2026?
Pairing the three strongest currencies with the three weakest gives nine combinations. EURCAD, EURNZD and EURAUD read SELL, while CADJPY, NZDJPY, AUDJPY, CADCHF and NZDCHF read BUY.
AUDCHF reads NO TRADE because its 4 hour and daily disagree. Currency strength tells you where to look, and the panel tells you whether that pair is lined up. A verdict is not an entry, so wait for an entry chart to print its own ticket.
Is EURUSD falling because of a weak euro or a strong dollar?
Mostly a weak euro. On 28 October the euro was the weakest currency on the board by a long way, while the US dollar sat in the middle.
All seven euro pairs read SELL.
Is selling several euro pairs at once more than one trade?
Not really. Selling EURUSD, EURGBP and EURJPY together is one bet on the euro taken three times, and a euro bounce can reach all three stops in the same move.
Size them as one. We risk at most 2 percent per trade, usually 0.5 percent.
What would change the EUR USD forecast?
If the 4 hour turned UP while the daily stayed DOWN, the verdict would move to NO TRADE and the panel would stand aside, as it did during last week’s bounce.
The next targets below are 1.11130 on the 1 hour and 1.10931 on the 4 hour.
Disclaimer: This post reports what the Direction Sniper panel showed on EURUSD between 22 and 28 October 2026. It is educational analysis, not financial advice and not a trade signal service. The 4 hour and 1 hour tickets were still open at the time of writing. Price reaching a published target level is not the same as a realised result. High and low levels are approximate readings from the chart. The strongest and weakest currencies are an observation from the morning of 28 October and change as the charts change. Lot sizes are arithmetic for illustration and are not a recommendation about how much anyone should trade. Forex trading carries risk, and you should only trade money you can afford to lose.

