Currency Strength Today, 7 November 2026: The Strongest And Weakest Currencies This Week, And Why Steady Beats Strong
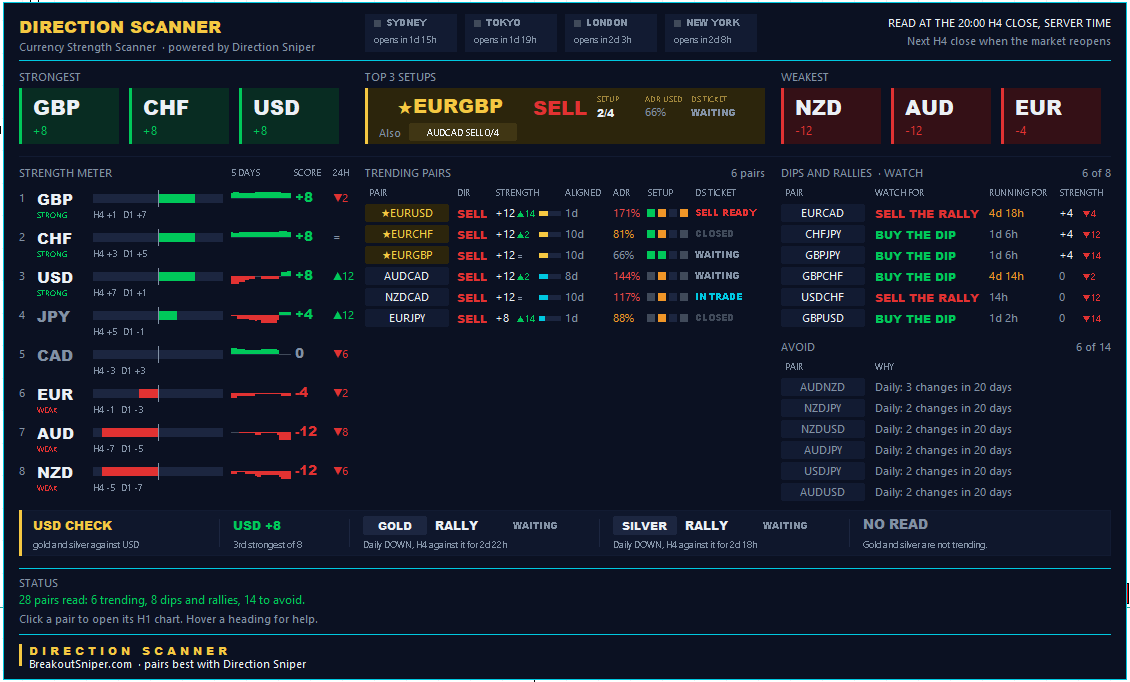
The strongest and weakest currencies this week tell two very different stories, from Monday’s first read to Friday’s last 4 hour close. GBP and CHF stayed in the top three on all five boards, the US dollar went from last to level at the top, and the pairs built on the steady currencies gave the cleanest trends of the week. Here is the week at a glance, then the story behind it.
Picture a football league table at the end of the month.
One team has sat in the top three every single week. Another was bottom of the table on Monday, had a wobbly midweek, and then one big result on Friday lifted it level on points with the leaders.
Which of the two would you trust to still be up there next month?
That is the currency strength board this week. Some currencies held their place from Monday to Friday. Others jumped around like a team on a lucky streak. The pairs built on the steady ones trended. The pairs built on the jumpers ended up on the avoid list.
And here is a puzzle. The pair with the widest strength gap on Friday’s entire board is not a pick. It is not even on the watch list. It is sitting on the avoid list. By the end of section 9, you will see why, and why that is the most useful thing on the board.
1. Yesterday’s Picks: How Friday Ended
Yesterday’s Currency Strength Today read carried two live tickets. Here is where both finished at Friday’s close.
NZDCAD 1 hour sell: two targets reached. Target 1 at 0.78223 had already been reached when we published. Price went on to pass Target 2 at 0.77934, with a low near 0.7783, before the bounce around Friday’s Canadian jobs data turned the 1 hour back up and ended the ticket. Target 3 at 0.77644 was not reached. The NZDCAD 4 hour sell is still in trade.
EURCHF 1 hour sell (Pick of the Day): the trailing stop did its job. The ticket closed at its trailing stop, 0.91520, just 4.5 pips behind the 0.91475 entry. The original stop sat at 0.91819, 34.4 pips away. The trailing stop had already tightened by 29.9 pips, so at $50 of risk the cost was about $6.50 instead of $50. Price then traded down to 0.91404 by Friday’s close, 7 pips below the entry, and every EURCHF timeframe still reads DOWN.
The direction on both was right. NZDCAD had the room. EURCHF did not, and the trailing stop kept that one cheap. Knowing where the trailing stop sits before the bounce arrives is exactly what the Direction Sniper panel shows you on every ticket.
2. How The Week Started, And How It Ended
On Monday’s board, the US dollar was the weakest currency of the eight and the Canadian dollar was the strongest. Here is how the table moved, day by day:
| Day | Strongest three | Weakest three (weakest first) |
|---|---|---|
| Monday 2 Nov | CAD, GBP, CHF | USD, EUR, NZD |
| Tuesday 3 Nov | GBP and CHF level, then CAD | USD and JPY level, then EUR |
| Wednesday 4 Nov | GBP, CHF, CAD | NZD, JPY, AUD |
| Thursday 5 Nov | GBP, CAD, CHF | JPY, NZD, USD |
| Friday close | GBP, CHF and USD level | NZD and AUD level, then EUR |
Two things jump out.
The dollar went from last on Monday to level at the top by Friday’s close. It did not travel in a straight line either. It reached the middle of the table on Wednesday, slid back into the weakest three on Thursday, then made one of the two biggest 24 hour climbs on the meter into Friday’s close.
And two currencies never left the top three at all.
3. The Steady Ones: GBP And CHF At The Top, NZD And EUR Near The Bottom
GBP and CHF were in the top three on all five boards. Not once did either drop out.
NZD was in the weakest three on four of the five boards. EUR never climbed above the middle of the table.
These are the leaders and the strugglers that stayed put. Now look at the trending list at Friday’s close:
| Pair | Direction | Bigger charts agreeing for |
|---|---|---|
| EURGBP | SELL | 10 days |
| EURCHF | SELL | 10 days |
| NZDCAD | SELL | 10 days |
| AUDCAD | SELL | 8 days |
| EURUSD | SELL | 1 day |
| EURJPY | SELL | 1 day |
The three longest trends on the board are all built on currencies that held their place. Weak euro against a strong pound. Weak euro against a strong franc. A weak New Zealand dollar against a Canadian dollar that sat in the top three from Monday to Thursday.
Ten days of the 4 hour and the daily pointing the same way does not happen on a currency that changes its mind every other day.
The scanner shows you which pairs line up. The Direction Sniper 28 Pair Edition shows you whether the 4 hour and the daily on that pair really agree, and gives you the ticket when an entry chart lines up.
4. The Jumpers: USD, JPY, CAD And AUD
Now the other half of the table.
- USD: last on Monday, level at the top on Friday, with a slide back into the weakest three on Thursday along the way.
- JPY: in the weakest three from Tuesday to Thursday and last of all on Thursday, then fourth by Friday’s close.
- CAD: strongest on Monday and in the top three until Thursday, then down to the middle of the table on Friday.
- AUD: in the middle on Monday, level at the bottom by Friday.
A team that swaps between the top and the bottom every few days is not a leader. It is noise. And noise is exactly what the board shows on the pairs built from these four.
Of the 14 pairs on Friday’s avoid list, the six shown on the board are AUDNZD, NZDJPY, NZDUSD, AUDJPY, USDJPY and AUDUSD. Every one of them carries at least one of the jumpers, and their daily charts have changed direction two or three times in the last 20 days.
The board also got narrower as the week went on. On Wednesday there were 9 trending pairs and 8 to avoid. By Friday’s close there were 6 trending and 14 to avoid.
When a currency jumps, its pairs swing instead of trend. Some land in Dips and Rallies, where the 4 hour is moving against the daily. CHFJPY, GBPJPY and GBPUSD all sit there now as dips inside an uptrend. That is a bounce until the bigger chart says otherwise, and telling a bounce from a real turn is one of the three jobs Direction Sniper does best.
5. Where This Week’s Targets Came From
These are the picks we published this week before they reached Target 1, so a reader could have seen every one of them in time:
- Monday, NZDCHF 1 hour sell (Pick of the Day): all three targets reached overnight, 42.9 pips from entry to Target 3.
- Wednesday, GBPJPY 15 minute buy: all three targets reached, 70 pips to Target 3 on a 23.3 pip stop. This exit is read from the chart, so it is approximate.
- Tuesday, CHFJPY 30 minute buy (Pick of the Day): Target 1 reached, then the rest closed at its trailing stop 9.8 pips behind entry.
- Tuesday, silver 1 hour sell: Target 1 reached, then closed at its trailing stop in front of entry.
Look at who is in that list. The steady laggard NZD against the steady leader CHF. GBP and CHF, the two currencies that never left the top three, against JPY while it sat at the bottom of the table.
Some of the best looking moves of the week are not in that list. CHFJPY’s 1 hour reached all three targets on Tuesday, and NZDCAD’s 1 hour reached two targets on Friday, but both had already reached Target 1 when we published them. We do not count them, because a reader could not have acted on them in time.
Now the picks that went the other way, because we publish all of it. The dollar figures use $50 of risk, which is 0.5% on a $10,000 account.
- EURCHF 1 hour sell, Pick of the Day on Wednesday, Thursday and Friday. Wednesday’s ticket closed at its original stop, the full $50. Thursday’s closed at its trailing stop 9.7 pips behind entry, about $15. Friday’s closed at its trailing stop 4.5 pips behind entry, about $6.50. Same direction all week, and EURCHF is still on the trending list with ten days of agreement. What changed was how far the trailing stop had already tightened when each bounce arrived.
- NZDCAD 15 minute sell, Wednesday: closed at its trailing stop 7.6 pips behind entry, about $23 instead of $50.
- Gold 1 hour sell, Tuesday: closed at its trailing stop behind entry, a little over half the planned risk.
- AUDCAD 1 hour sell, Thursday: closed at its trailing stop 18.3 pips behind entry, then price traded through the levels where all three of its targets sat. The direction was right. The room was too small.
Each of these tickets printed its entry, stop and three targets before price moved. That is the part the scanner alone does not give you, and it is what the 28 Pair Edition puts on your chart.
6. USD Check: The Dollar Turned, The Metals Did Not Follow
The dollar closed the week level at the top of the table, third of eight on the board.
Gold and silver did not take the hint. Both are rallying against a daily chart that still points DOWN. On gold the 4 hour has been moving against the daily for 2 days and 22 hours, and on silver for 2 days and 18 hours.
When the 4 hour and the daily disagree, the scanner gives no read on either metal, and Direction Sniper says stand aside. No ticket, no trade. Our gold and silver price forecast picks the metals up again as soon as the bigger charts line back up.
7. News And The Weekend Gap
There are no high impact news flags on Friday’s closing board. Check your own calendar before the market reopens, because the week’s first releases can land in the first few sessions.
The bigger thing to respect this weekend is the gap. The market is shut until the Sydney session opens, and price does not have to open where it closed on Friday. A stop placed on Friday can fill beyond its level if price opens past it. No stop can protect you from that. Only lot size can.
8. What We Watch At Monday’s Open
These are the charts we will read first when the market reopens. They are not picks, and they are not trades for you to take. Monday’s board decides what happens next.
- EURGBP SELL: the scanner’s top setup. Ten days of agreement, only 66% of its average daily range used, and the Direction Sniper ticket is still waiting. No entry yet.
- NZDCAD SELL: ten days of agreement, and the 4 hour ticket is in trade.
- AUDCAD SELL: eight days of agreement, ticket waiting, but 144% of its average daily range already used.
- EURUSD SELL: the ticket is ready, but the pair has used 171% of its average daily range and its bigger charts have agreed for just one day. It also shares the euro with EURGBP.
Four of the six trending pairs are euro sells. That is not four trades. It is one euro trade written four ways. We explain why in Strong vs Weak Currency Pairs.
9. The Strongest And Weakest Currencies This Week: What They Teach
Back to the puzzle from the start.
The widest strength gap on Friday’s whole board belongs to NZDUSD and AUDUSD: the dollar level at the top of the table, the New Zealand and Australian dollars level at the bottom. On a currency strength meter, that looks like the trade of the week.
Yet both pairs are on the avoid list. Their daily charts have changed direction twice in the last 20 days. The dollar was the weakest currency on the board on Monday. A gap that opened in one week sits on a daily chart that has not settled yet.
Currency strength is a filter. It tells you which pairs and which side. The chart decides whether there is a trend to trade. That is why we look for strong against weak that has held for days, not hours. The step by step version is in How To Find The Best Trending Forex Pairs.
Then, as always, it comes back to lot size.
If you sold all four euro pairs at 0.5% each, you would not have four small trades. You would have 2% riding on one currency, with a weekend gap in front of it. Pick one euro pair, risk 0.5%, and size the lot from the stop the ticket gives you. Our EURGBP Lot Size Calculator does the sum in seconds.
No single trade should ever make or break you, and no single currency should either.
Steady Beats Strong
Put the week together.
The team that sits in the top three for ten weeks has earned its place. The team that jumps from the bottom to the top on one result might be a new leader, or it might be back in the bottom half by next Friday. Nobody knows yet, and neither does the chart.
GBP and CHF held the top. NZD and EUR held the bottom. The pairs between them trended for ten days, and that is where this week’s targets were reached. The dollar’s jump to the top filled the avoid list instead.
That is Direction Sniper:
- Direction. One verdict from the 4 hour and the daily, refreshed at every 4 hour close.
- Rallies and bounces that have not broken structure. EURCHF bounced through three of our picks this week. Its bigger charts never turned.
- The stop loss. Every ticket arrives with its stop and three targets marked, and the trailing stop level shows how much is still at risk.
The Direction Scanner is something we are building for ourselves, to scan and manage all 28 pairs every day. It is still in development, and we use it in public, with full transparency. The 28 Pair Edition puts the tickets behind it, the entry, the stop, the three targets and the trailing stop, on your own charts, on every major, minor and cross, MT4 or MT5, on one licence.
Every daily board lives on our Currency Strength Today page. Read the board differently, or want us to look at something next week? Leave a comment, we read every one. Want the daily read in your inbox? Join The Daily Sniper Read, free, every trading day.
Strongest And Weakest Currencies This Week: Frequently Asked Questions
Updated 7 November 2026. Covers the Currency Strength Today boards from Monday 2 November to Friday’s last 4 hour close.
1What were the strongest and weakest currencies this week?+
GBP and CHF were in the top three on all five boards, from Monday 2 November to Friday’s last 4 hour close.
At Friday’s close GBP, CHF and USD were level at the top, with NZD and AUD level at the bottom and EUR third weakest.
2Which currency moved the most this week?+
The US dollar. It was the weakest of eight on Monday, slid back into the weakest three on Thursday, and closed the week level at the top.
The Canadian dollar went the other way, from strongest on Monday to the middle of the table on Friday.
3Why are NZDUSD and AUDUSD on the avoid list when the strength gap is so wide?+
Their daily charts have changed direction twice in the last 20 days. A gap that opened in one week sits on a daily chart that has not settled yet.
Currency strength is a filter that tells you which pairs and which side. The chart decides whether there is a trend to trade.
4Why were EURGBP, EURCHF and NZDCAD the cleanest trends?+
All three have had the 4 hour and the daily agreeing for 10 days.
Each pairs a currency that held its place near the bottom of the table with one that held its place near the top. Strength that stays produces trends, and strength that jumps produces swings.
5Which picks reached all three targets this week?+
NZDCHF, Monday’s Pick of the Day, reached all three targets overnight, 42.9 pips from entry to Target 3. GBPJPY’s 15 minute buy on Wednesday reached all three, 70 pips to Target 3 on a 23.3 pip stop.
We only count picks published before they reached Target 1, so a reader could have seen every one in time.
6Four euro pairs say sell. Should you trade all four?+
No. Four euro sells are one euro trade written four ways.
At 0.5% risk each, four positions would put 2% on a single currency. Pick one euro pair and size the lot from the stop the ticket gives you.
7Why does lot size matter more over the weekend?+
Price does not have to open on Monday where it closed on Friday, and a stop can fill beyond its level if price opens past it.
No stop can protect you from a gap, so the only protection is a lot size small enough that a bad open does not hurt the account.
DIRECTION SNIPER 28 PAIR EDITION
See every pick on your own charts the moment a ticket prints.
Direction, entry, stop and three targets on all 28 pairs. MT4 or MT5, one licence.
Disclaimer: This post reports what the Direction Scanner and Direction Sniper panels showed from Monday 2 November to Friday’s last 4 hour close, server time, and the results of the picks published in our Currency Strength Today reads that week before they reached Target 1. Dollar figures assume $50 of risk per pick, 0.5% of a $10,000 account, and are illustrations, not the results of any trading account. Spread, commission and slippage are not included, and some exit levels are read from the chart and are approximate. Price reaching a published target or stop level is not the same as a realised result. Past results do not guarantee future results. The pairs under What We Watch At Monday’s Open were waiting or in trade at the time of writing and are not recommendations. This is educational analysis, not financial advice and not a trade signal service. Forex and metals trading carries risk, and you should only trade money you can afford to lose.

