Gold and Silver Price Forecast Today, 5 November 2026: Metals Rallied Hard, And The Panel Still Says NO TRADE. Here Is Why Standing Aside Is The Right Call
This gold and silver price forecast today is about the hardest thing in trading: watching a big move and not taking it. Gold has rallied from around 3,875 to above 4,100, and silver from around 49 to above 52.50. And on the Direction Sniper panel, both metals read NO TRADE, Stand aside. If you feel left out, this post is for you. Here is the picture at a glance, then exactly why the panel is sitting this one out.
▲ Strong rally, gold about 270 points
▼ Still a downtrend since August
Around 4,175, still above price
Around 57.70, more than $5 above
Read at the 08:00 H4 close, server time. The board refreshes every 4 hours.
Have you ever tried to walk up a down escalator?
For a few steps, it works. You climb faster than the stairs move, and you actually go up. Anyone watching just your feet would say you are winning.
But the escalator never stops. The moment you slow down, catch your breath or lose your footing, it carries you back down. And if you are halfway up when that happens, you go down a long way.
That is what gold and silver are doing right now.
The 4 hour chart is the person running up the stairs. It is fast, it is strong, and it looks like a massive rally. The daily chart is the escalator. It is still moving down.
By the end of this read, you will see why the panel will not run up that escalator, why it will not try to push the runner back down either, and the two things that would make it step back on.
This read is from the 08:00 H4 close, server time (06:00 GMT). The board refreshes at every 4 hour close.
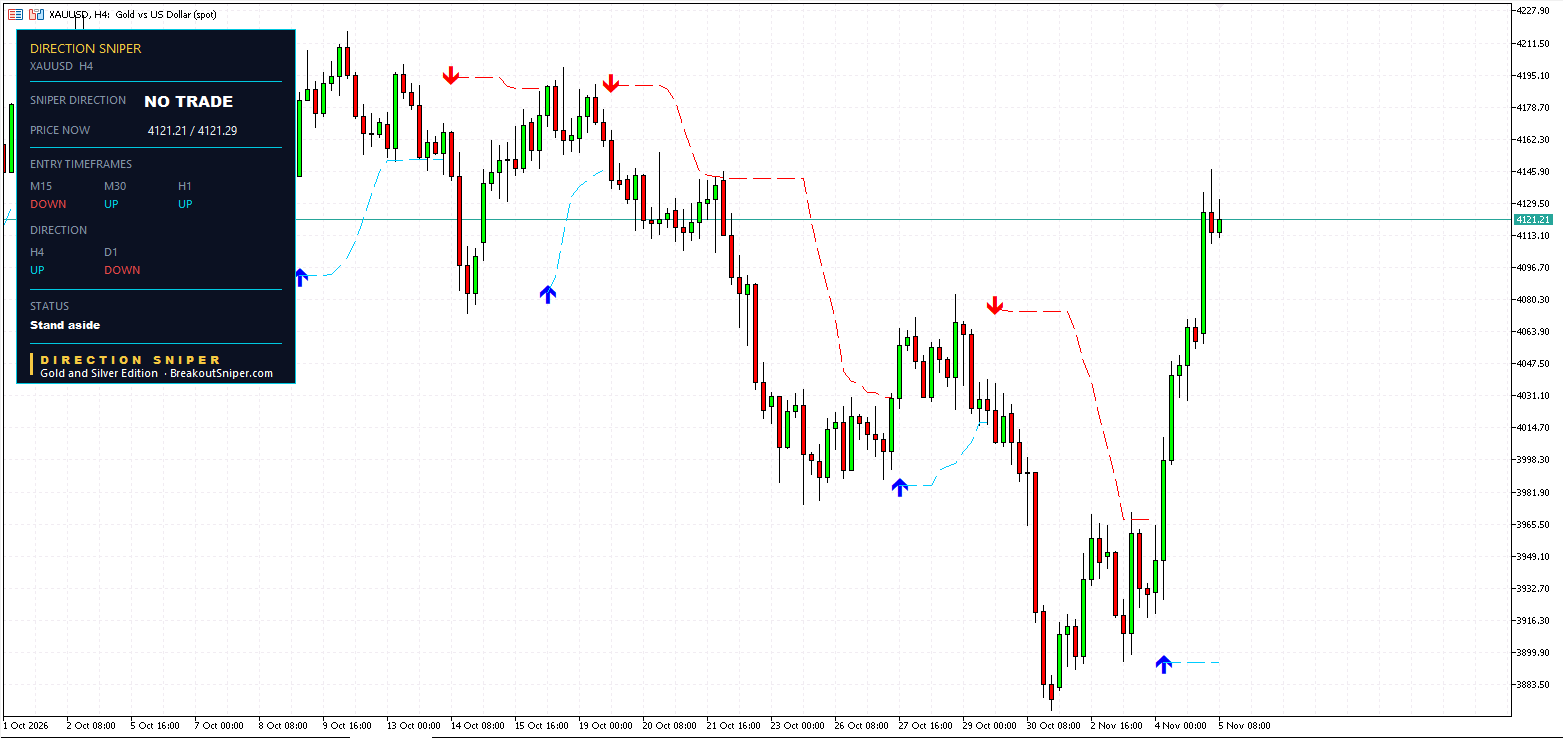
1. Gold And Silver Today: The Board
| Chart | Gold | Silver |
|---|---|---|
| M15 | DOWN | DOWN |
| M30 | UP | UP |
| H1 | UP | UP |
| H4 | UP | UP |
| Daily | DOWN | DOWN |
| Verdict | NO TRADE | NO TRADE |
The 4 hour and the daily are the two charts that decide direction. On both metals, they now point in opposite directions. When they disagree, there is no direction to trade, and the panel stands aside.
Yesterday, only gold was on NO TRADE, and silver still read SELL. Overnight, silver’s 4 hour turned UP too. Both metals are now in the same place: a strong rally on the 4 hour, inside a downtrend on the daily.
2. Gold Price Forecast Today: The Rally Through The Keyhole
Look at the 4 hour chart on its own, and it is hard not to get excited.
Gold bottomed around 3,875 on 30 October. It bounced to around 3,970, dipped to around 3,895 on 3 November, and then ran. Big green candles, one after another, up through 4,000 and on to a high around 4,145. That is roughly 270 points in under a week.
If the 4 hour chart were the only chart, this would look like the start of a new uptrend.
But the 4 hour chart is a keyhole. You see one part of the room very clearly. You do not see the whole room.
3. Gold Daily Chart: Open The Door
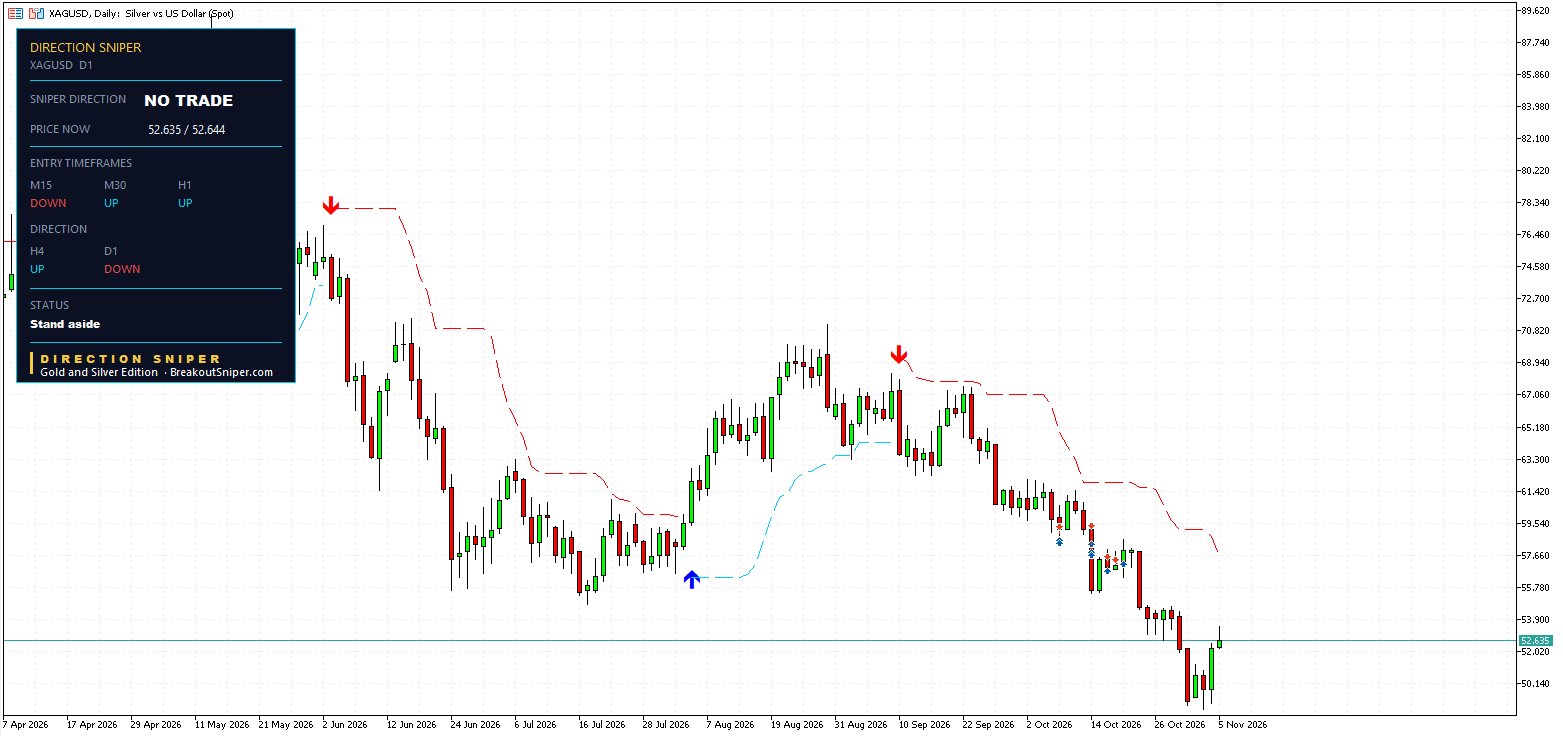
Now open the door and look at the daily.
Gold peaked around 4,690 in late August. Since then, every rally has stopped lower than the one before: around 4,520 in early September, around 4,400 in mid September, around 4,200 in October. Lower highs, one after another. That is a downtrend, and it is now more than two months old.
The panel’s daily trailing line, the level the downtrend has been respecting, sits up around 4,175, read from the chart. Gold at 4,121 is still below it.
So from the daily’s point of view, this week’s “massive rally” is something much smaller: a bounce from the bottom of a downtrend, back toward the line that has capped every rally since August.
Same price. Same candles. A completely different story, depending on which chart you look at.
4. Silver: The Same Escalator, Even Steeper
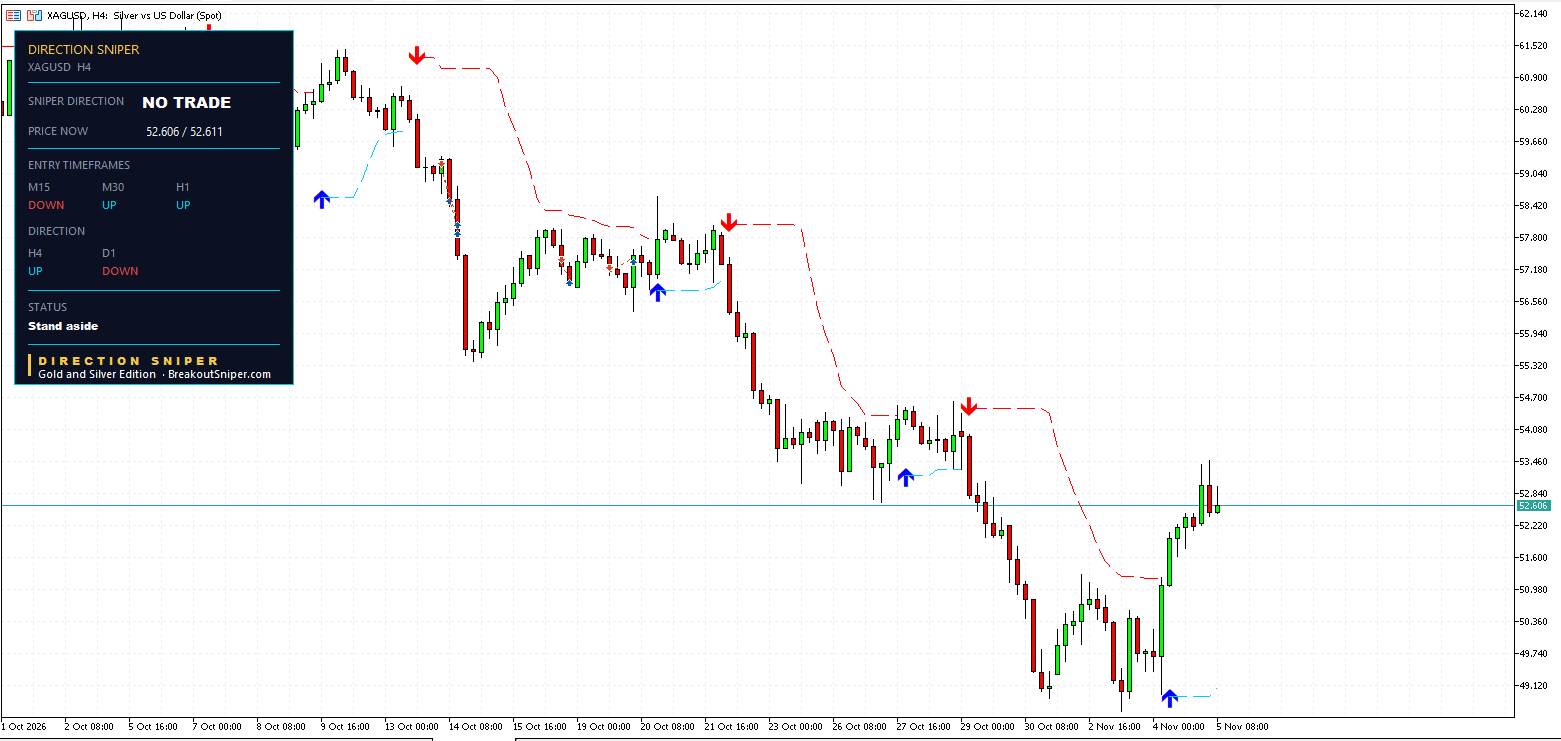
Silver shows the same picture, more sharply.
On the 4 hour, silver climbed from around 49 on 4 November to a high around 53.40, a rally of more than 8 percent in two days.
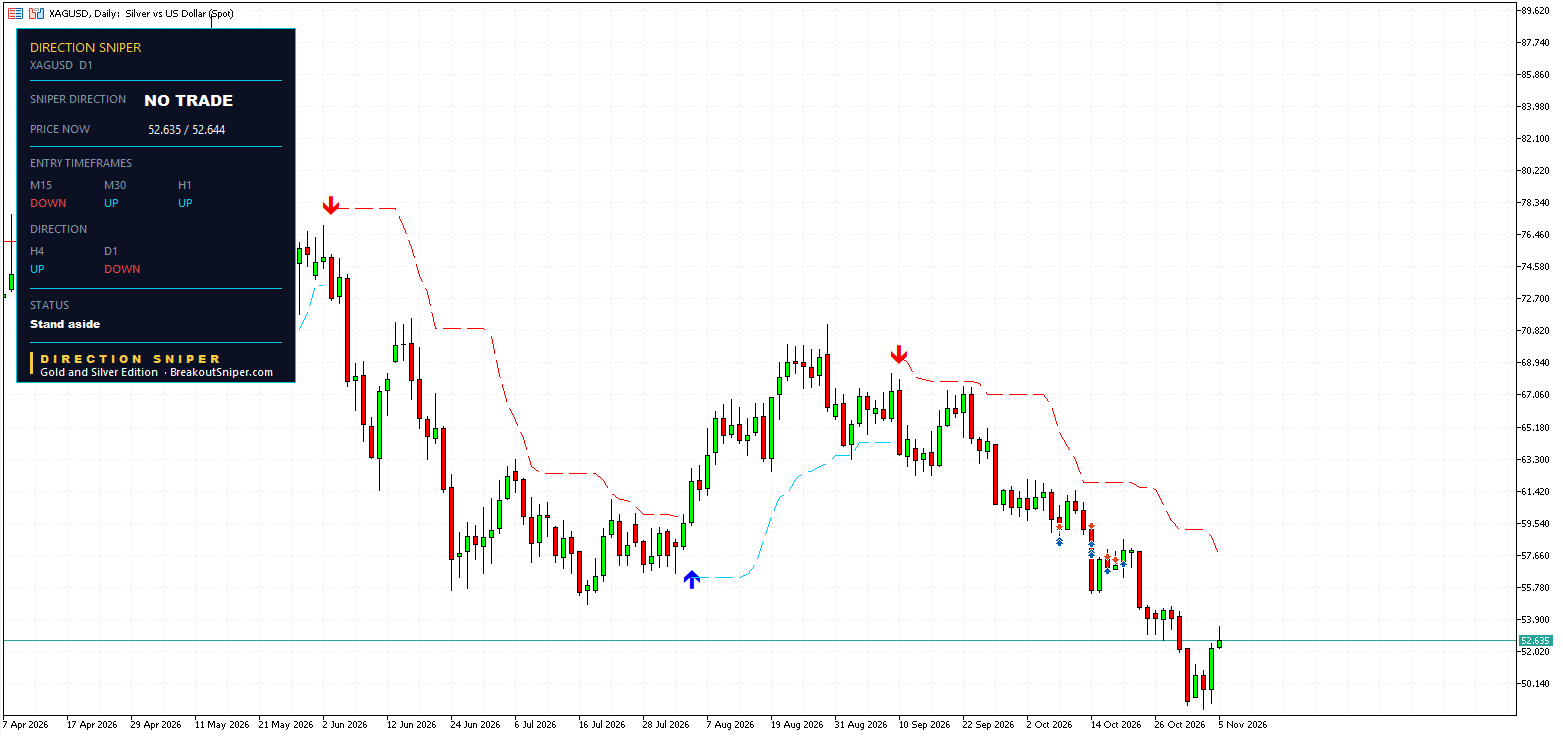
On the daily, silver is in a much deeper downtrend. It peaked around 77 in early June, rallied back to around 70.80 in late August, and has fallen since, through 60 and on toward 49. The daily trailing line sits up around 57.70, read from the chart, more than $5 above today’s price.
From the daily’s point of view, silver’s rally has not even reached the halfway mark back to the downtrend line.
5. Why We Are Not Buying
This is the question most traders are asking today: gold is up 270 points, so why not buy?
Because buying now means siding with the runner against the escalator. Here is what that looks like in practice:
- The daily still points DOWN. Every rally since August has failed below the daily line. Buying now assumes this one is different, before the daily has shown any sign that it is.
- You would be buying late. Gold has already moved 270 points. A buy here would need a stop below the rally to make sense, and from 4,121 that stop is far away, which means a small lot and a long way to fall.
- You would be buying into the ceiling. The daily line around 4,175 is exactly where the last two months of rallies have turned back. A buy from here has the ceiling right above it.
A rally against the bigger trend is not a reason to buy. It is a reason to wait and see whether the bigger trend changes.
6. Why We Are Not Selling Either
The other half of the question: if the daily is still DOWN, why not sell the rally?
Because that means standing in front of the runner. The 4 hour chart is UP, and it got there with real strength. Selling now means fighting the smaller trend while it is still running hard.
- The 4 hour has turned UP. Until it turns back DOWN, a sell has the short term momentum against it.
- There is no sell ticket. The panel only prints a sell when the faster charts turn back DOWN in line with the bigger charts. Right now, the 30 minute and 1 hour are still UP.
- Selling too early is how traders get caught. A rally can run further than anyone expects before it fails. Being right about the daily and early on the timing still costs money.
So the panel is not saying “gold is going down” or “gold is going up.” It is saying something more honest: the two charts that decide direction disagree, so there is no trade worth taking yet.
7. The Lesson: Never Fight The Bigger Trend, And Never Chase The Smaller One
If you feel left out of this rally, that feeling is normal. Watching 270 points go by without you is uncomfortable.
But look at what being “in” would have required. Yesterday, our gold and silver 4 hour sells were in the market, with the daily and the 4 hour both pointing down. Before this rally really began, both had already closed at their trailing stops, in front of their entries. The panel did not fight the rally. It stepped off the escalator in time.
Today, it is doing the same thing from the other side. It is not chasing the rally, and it is not standing in front of it.
That is the rule we follow on every chart, and the one we think every trader should:
- Never fight the bigger trend. If the daily points DOWN, do not buy against it just because a smaller chart is rallying.
- Never chase the smaller trend. If the 4 hour is racing UP, do not sell into it just because the daily disagrees.
- Wait until they agree. That is when the panel prints a ticket, with an entry, a stop and three targets, and both big charts are behind the move.
We explain how the 4 hour and the daily work together in our guide to multi timeframe analysis for gold.
8. What Would Bring Gold And Silver Back On
The panel will step back on the escalator in one of two ways.
SELL returns if the 4 hour turns back DOWN to join the daily. If that happens near the daily line, around 4,175 on gold and well above today’s price on silver, the next sell ticket could print with its stop close above the rally high, which is exactly the kind of entry worth waiting for.
BUY appears if the daily turns UP to join the 4 hour. That would mean the downtrend that started in August has actually ended, not just paused. A buy ticket on that basis would have both big charts behind it.
Until one of those happens, NO TRADE is the answer.
Levels to watch, read from the chart:
- Gold: the daily trailing line around 4,175, and this rally’s high around 4,145
- Gold: the 3 November dip around 3,895
- Silver: the rally high around 53.40, and the daily trailing line around 57.70
9. What This Means For The US Dollar
In today’s Currency Strength Today read, the US dollar slid back into the bottom three, 3rd weakest of 8. A weaker dollar fits with gold and silver rallying. But the dollar’s own picture changes from day to day, and gold’s daily still points down. That is why we read gold on its own charts first.
The Bank of England decision at 12:00 GMT today can move the dollar and the metals for a few minutes. Confirm the time on your own calendar.
10. The Best Lot Size Today Is Zero
We risk at most 2 percent per trade, usually 0.5 percent, so on a $10,000 account that is $50.
But on a day when the panel says NO TRADE, the right amount at risk on gold and silver is nothing at all. No ticket means no entry, no stop and no size. Not trading is a position too, and today it is the one with no risk attached.
When the next ticket does print, size it from its stop, not from how big the last move was. Here is how to calculate lot size for gold from any stop, or work it out in seconds with our free Gold and Silver Lot Size Calculator.
On a small account, a cent account makes the right sizes possible. For small balances we recommend a RoboForex Cent account or an XM Micro account. These are partner links, so we may receive a commission at no cost to you.
If you are worrying about every trade, your lot size is still too big.
The Runner, The Escalator, And The Wait
Put the board together.
Gold and silver have rallied hard. On the 4 hour chart, it looks like a new trend. On the daily chart, it is a bounce inside a downtrend that has held since August on gold and since June on silver. The two charts that decide direction disagree, so the panel reads NO TRADE on both metals.
It will not run up the down escalator. It will not stand in front of the runner. It waits until both charts agree, and then it prints a ticket.
Feeling left out of a move is temporary. Being caught on the wrong side of the bigger trend can last a lot longer.
That is Direction Sniper:
- Direction. One verdict from the 4 hour and the daily. When they disagree, it stands aside instead of guessing.
- Rallies and bounces that have not broken structure. This rally turned the 4 hour UP. It has not turned the daily.
- The stop loss. Every ticket arrives with its stop and three targets marked, and yesterday’s 4 hour tickets had already closed in front of their entries before the rally came.
The Direction Sniper Gold and Silver Edition puts this panel on XAUUSD and XAGUSD, on MT4 or MT5, so you can see both charts’ verdicts at a glance instead of guessing from one.
See the Gold and Silver Edition
Today’s other reads: the full board in Currency Strength Today, and our Pick of the Day in the EUR CHF forecast, where the trailing stop is already within 10 pips of the entry. Yesterday’s read, when the panel first stood aside on gold, is in yesterday’s gold and silver price forecast.
Want the next read in your inbox? Join The Daily Sniper Read, free, every trading day.
Gold and Silver Price Forecast Today: Frequently Asked Questions
Updated 5 November 2026, read at the 08:00 H4 close, server time. Levels are approximate readings from the chart.
1What is the gold and silver price forecast today, 5 November 2026?+
Both gold and silver read NO TRADE on the Direction Sniper panel. The 4 hour chart has turned UP on a strong rally, while the daily chart still points DOWN.
When the two charts that decide direction disagree, the panel stands aside.
2Why is there no buy signal after such a big gold rally?+
Because the daily chart still points down. Gold has made lower highs since peaking around 4,690 in late August, and the daily trailing line sits around 4,175, above today’s price.
On the daily, this rally is a bounce inside a downtrend, not yet a new uptrend.
3Why not sell the rally if the daily trend is down?+
Because the 4 hour has turned UP with real strength, and there is no sell ticket. Selling now means standing in front of the smaller trend while it is still running.
The panel waits for the 4 hour to turn back DOWN before it prints a sell.
4Have I missed the move if I am not in the gold rally?+
Feeling left out is normal, but buying against the daily trend after a 270 point rally means buying late and into the area where every rally since August has failed.
Our rule is never fight the bigger trend, and never chase the smaller one. Wait until both agree.
5What would make the panel buy gold?+
The daily chart turning UP to join the 4 hour. That would mean the downtrend since August has ended, not just paused, and a buy ticket would have both big charts behind it.
Until then, the answer is NO TRADE.
6What would make the panel sell gold again?+
The 4 hour turning back DOWN to join the daily. If that happens near the daily line around 4,175, the next sell ticket could print with its stop close above the rally high.
That is the kind of entry worth waiting for, rather than selling into a rally that is still running.
7Is silver in the same position as gold?+
Yes. Silver rallied from around 49 to around 53.40 on the 4 hour, but its daily has been falling since around 77 in June, with its trailing line around 57.70.
Both metals read NO TRADE, Stand aside.
8What lot size should I use on gold today?+
With no ticket on the panel, the right amount at risk on gold and silver today is zero. Not trading is a position too.
When the next ticket prints, size it from its stop. Use the Gold and Silver Lot Size Calculator to work it out. This is not a recommendation about how much anyone should trade.
DIRECTION SNIPER GOLD AND SILVER EDITION
See gold and silver the moment a ticket prints.
Direction, entry, stop and three targets on XAUUSD and XAGUSD. MT4 or MT5.
Disclaimer: This post reports what the Direction Sniper panel showed on XAUUSD and XAGUSD at the 08:00 H4 close, server time, on 5 November 2026. Prices will have moved by the time you read this. It is educational analysis, not financial advice and not a trade signal service, and nothing here is a recommendation to buy or sell. Levels such as rally highs, lows and daily trailing lines are approximate readings from the chart. Lot sizes are arithmetic for illustration, vary by broker, and are not a recommendation about how much anyone should trade. Trading gold and silver carries risk, and you should only trade money you can afford to lose.

