GBP CAD Forecast Today, 26 October 2026: Do All Timeframes Need To Agree Before You Trade? GBPCAD Says No
This GBP CAD forecast today answers one of the most common questions in multi timeframe trading: do all the timeframes need to agree before you take a trade?
This morning the Direction Sniper panel on GBPCAD reads SELL. The 4 hour and the daily both point down. The 15 minute and 30 minute have both lined up and printed fresh sell tickets. The 4 hour sell from last week has already reached its first target.
And the 1 hour? It points UP.
To a trader who waits for every chart to agree, that board looks confusing. To the panel, it is completely normal. Here is why, and why it matters every time you trade.
1. The Trap: Waiting For Every Chart To Agree
Multi timeframe traders often fall into one of two habits:
- They freeze. One chart disagrees, so they decide the picture is “unclear” and skip the trade, even when the bigger picture has not changed at all
- They follow the odd one out. The one chart pointing the other way catches their eye, and they trade against the bigger trend because of it
Both habits come from the same idea: that every timeframe has to point the same way before a trade is valid.
It does not. What matters is which charts agree, and what job each chart does.
2. How Direction Sniper Decides: Two Charts For Direction, Any One Chart To Trigger
The panel gives every timeframe a clear job.
Step 1: the direction. The 4 hour and the daily decide the direction. When both point down, the direction is confirmed as SELL. When both point up, it is BUY. When they disagree, it is NO TRADE, and the panel stands aside.
Step 2: every entry chart becomes trigger ready. Once the direction is confirmed by the 4 hour and the daily, each entry timeframe is trigger ready on its own. The entry timeframes are the 15 minute, the 30 minute, the 1 hour, and the 4 hour itself, since it agrees with the daily.
Step 3: any one chart can trigger. When any one of those charts lines up with the confirmed direction, that chart prints its own ticket, with its own entry, its own stop loss and its own three targets. It does not wait for the others.
And a chart pointing the other way simply waits. If an entry chart points against the confirmed direction, it has no ticket. It is not a warning and it does not cancel anything. It is a chart that has not lined up yet. The moment it turns back in line with the direction, it becomes a trigger again.
So the rule is simple:
The 4 hour and the daily must agree. After that, you only need one entry chart to line up.
That is why the status line on the panel lists the charts that have lined up, for example Sell on M15, M30, H4. It is telling you exactly which charts are triggered, and which one is still waiting.
3. Today’s GBPCAD Board
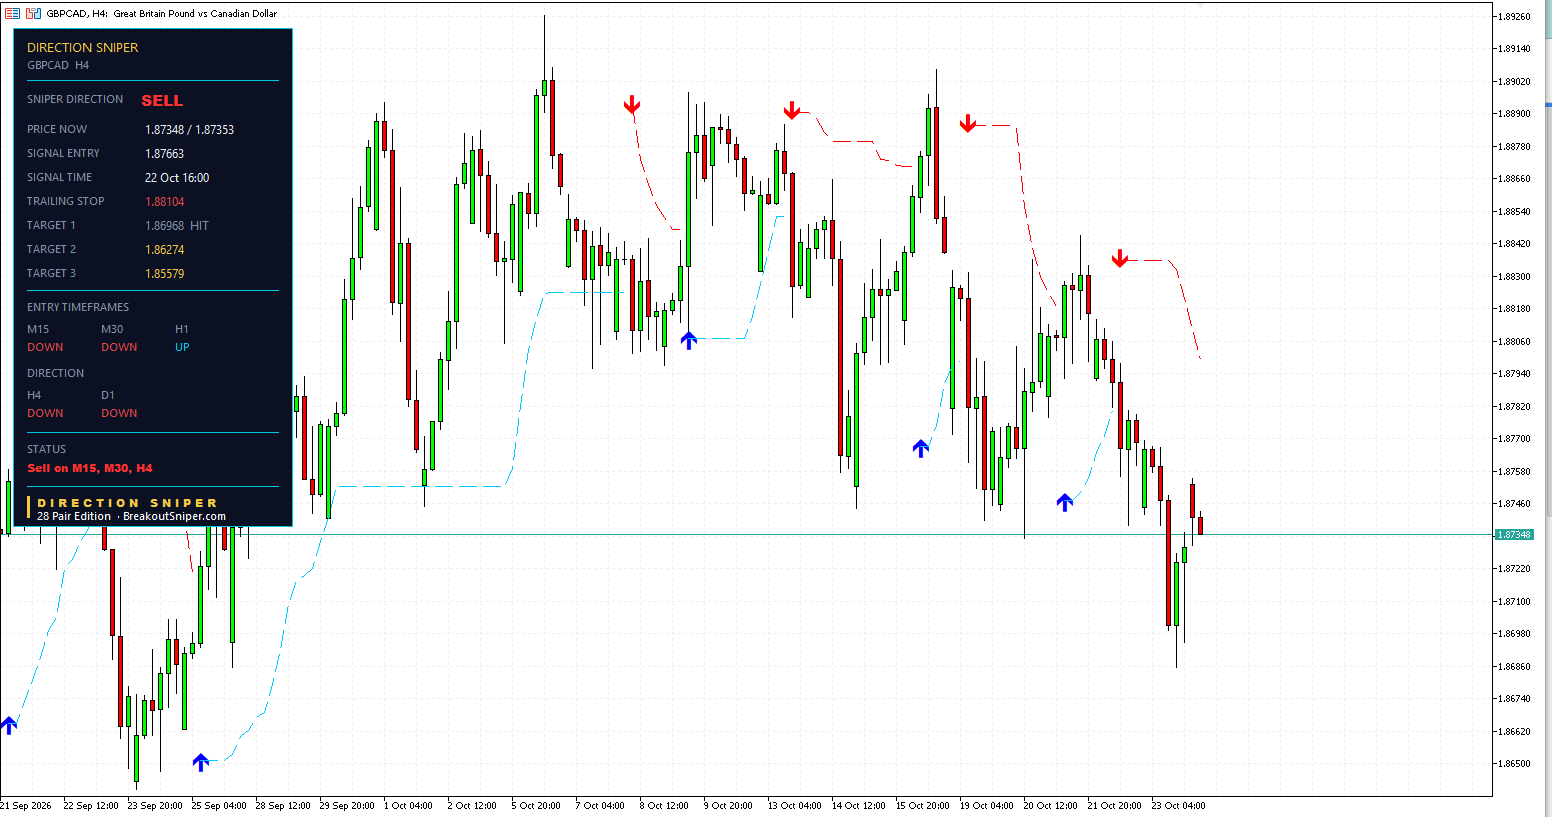
This is the GBPCAD 4 hour.
On 22 October, the 4 hour and the daily both pointed down. Direction confirmed: SELL. The 4 hour printed its ticket at 1.87663, with the stop already marked.
The next day, GBPCAD fell about 80 pips, and Target 1 at 1.86968 was reached.
Then came the bounce. Strong enough to turn the 1 hour up. But not strong enough to turn the 4 hour, or the daily.
So the direction never changed. The ticket is still running, and this morning the faster charts lined up to sell again.
A bounce turns the fast charts. The big charts decide.
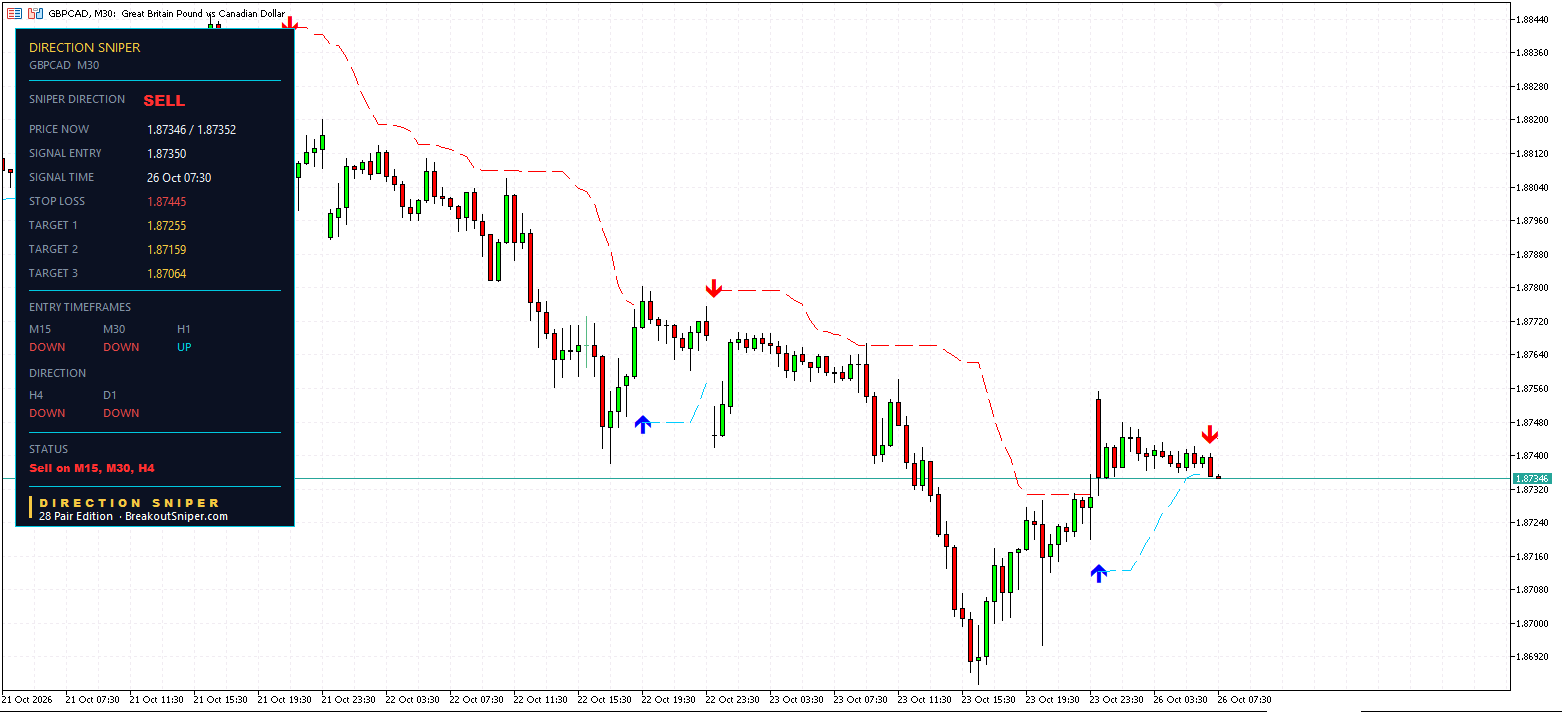
This is the GBPCAD 30 minute.
The 4 hour and the daily had already confirmed the direction: SELL. That made the 30 minute trigger ready. All it needed was to line up.
Last week’s bounce pushed it up for a while. This morning, it turned back down.
At 07:30, it printed its own ticket. Entry at 1.87350. Stop loss 9.5 pips above, at 1.87445. Three targets below, at 1.87255, 1.87159 and 1.87064.
It didn’t wait for the 1 hour. It didn’t need to. Direction first, then the trigger.
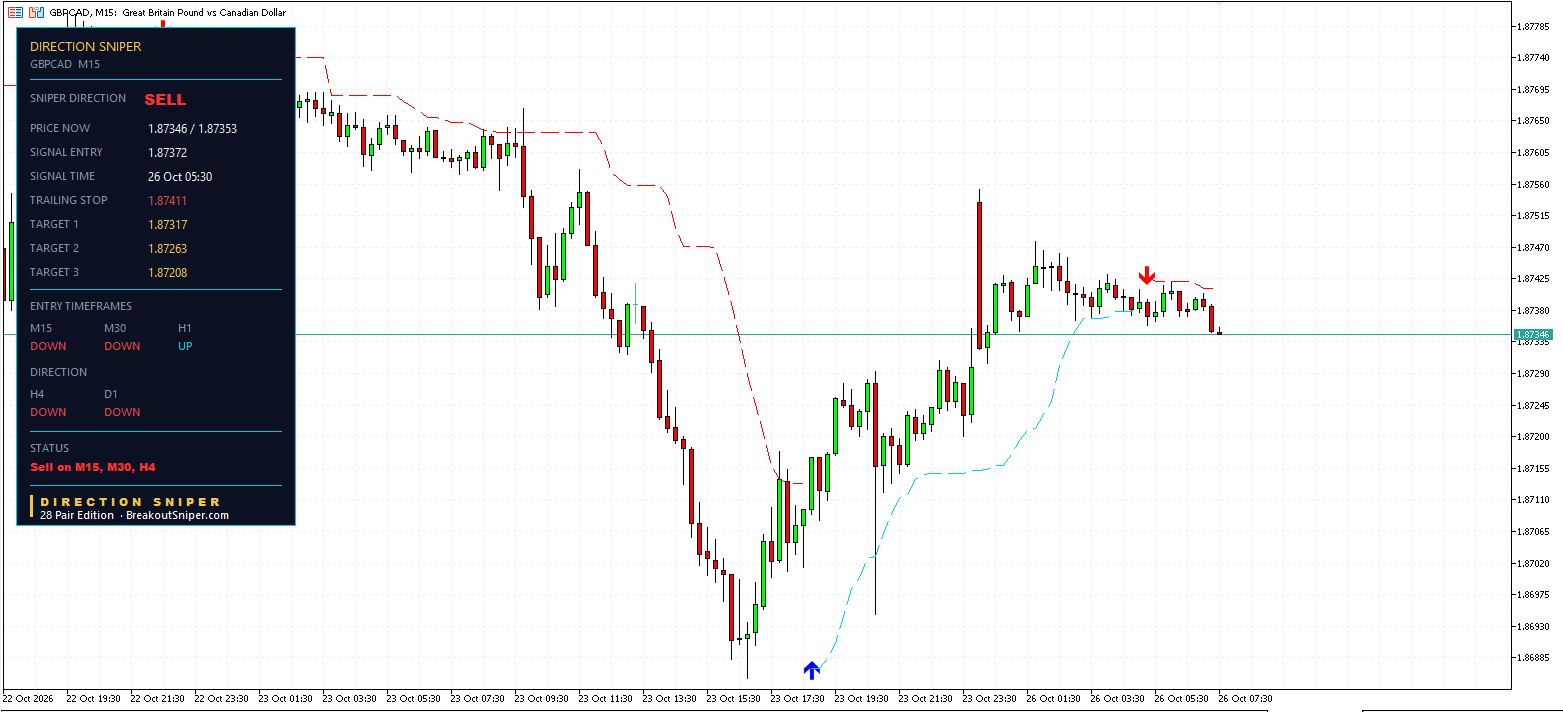
This is the GBPCAD 15 minute.
With the direction confirmed as SELL by the 4 hour and the daily, the 15 minute was trigger ready. And after the bounce, it was the first to line up.
At 05:30, it printed its ticket. Entry at 1.87372. Targets at 1.87317, 1.87263 and 1.87208.
The stop sits just 5.5 pips above. That’s tight. On a cross like GBPCAD, check your spread first, because a 2 pip spread uses more than a third of that stop before the trade even starts.
The fastest chart lines up first. Size it from the stop, and know your spread.
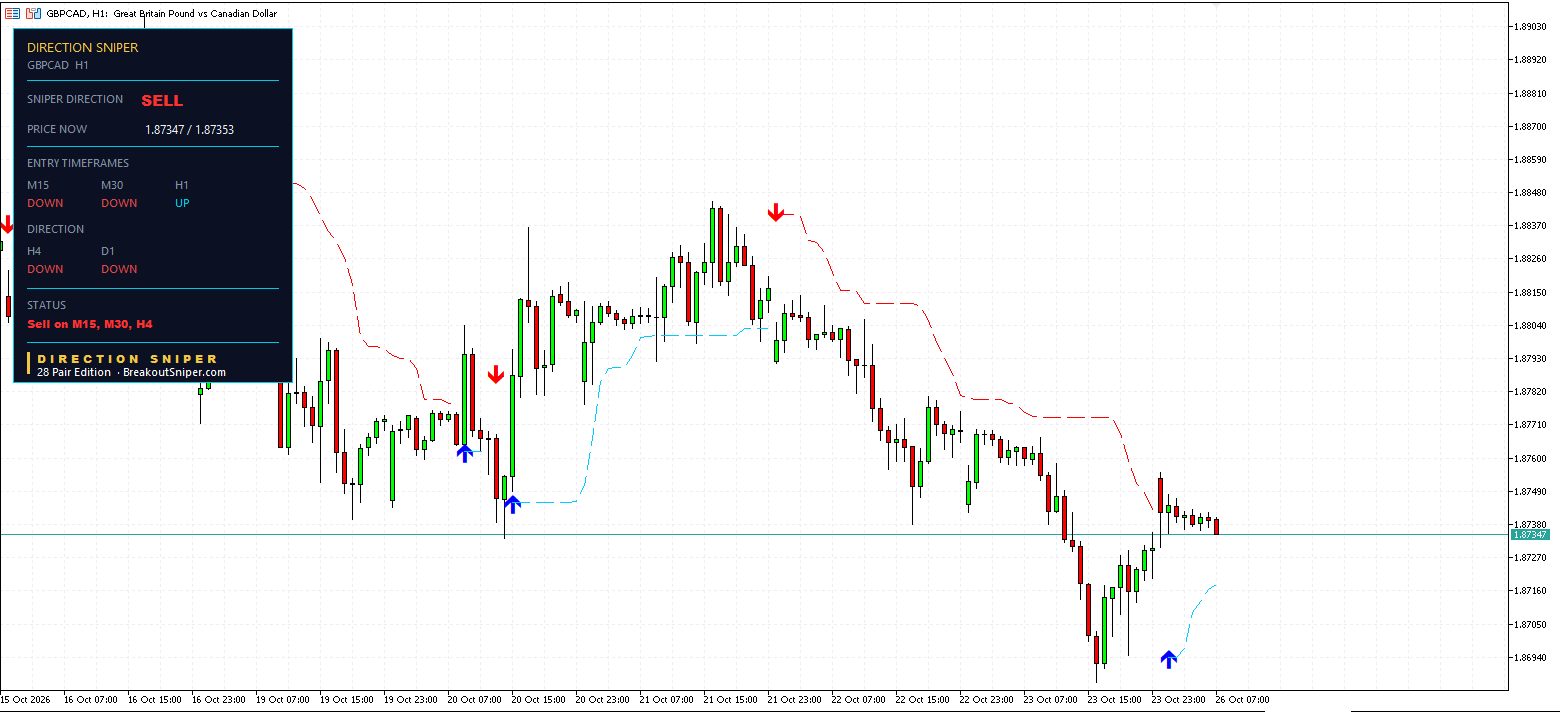
This is the GBPCAD 1 hour. And it’s pointing up.
Last week’s bounce turned it. So, should you buy?
No. The 4 hour and the daily still point down. The direction is still SELL. There’s no buy verdict to buy with.
That’s why this panel shows no ticket at all. The 1 hour isn’t warning you. It’s waiting.
The moment it turns back down, it lines up with the direction and prints a sell ticket of its own.
You don’t need every chart to agree. You need the big two to agree, and one entry chart to line up. Today, three already have.
| Chart | Role today | Entry | Risk | Targets | State |
|---|---|---|---|---|---|
| Daily | Direction | DOWN | |||
| H4 | Direction and entry | 1.87663 (22 Oct 16:00) | 69.5 pips | 1.86968 reached, 1.86274, 1.85579 | Running |
| H1 | Entry, waiting | UP, no ticket | |||
| M30 | Entry, triggered | 1.87350 (26 Oct 07:30) | 9.5 pips | 1.87255, 1.87159, 1.87064 | Fresh |
| M15 | Entry, triggered | 1.87372 (26 Oct 05:30) | 5.5 pips | 1.87317, 1.87263, 1.87208 | Fresh |
Price is around 1.8735.
Read the board the panel’s way:
- The direction is confirmed. The 4 hour and the daily both read DOWN, so the verdict is SELL
- Three entry charts are triggered. The 4 hour, the 30 minute and the 15 minute have all lined up with SELL, and each has its own ticket
- One entry chart is waiting. The 1 hour turned UP during last week’s bounce and has not turned back yet. It has no ticket. It is not saying “buy”, because there is no BUY verdict to buy with
A trader who waited for the 1 hour to agree would still be waiting. A trader who followed the 1 hour would be buying against both the 4 hour and the daily. The panel did neither.
4. The 4 Hour: Target 1 Reached, Then The Bounce
The 4 hour sell printed on 22 October at 16:00.
| Level | |
|---|---|
| Entry, sell | 1.87663 |
| Original stop | 1.88358, so 69.5 pips of risk |
| Target 1 | 1.86968, reached |
| Target 2 | 1.86274 |
| Target 3 | 1.85579 |
| Trailing stop now | 1.88104 |
On 23 October GBPCAD dipped to around 1.8686, about 80 pips below the entry, and Target 1 was reached.
Then came the bounce. GBPCAD climbed back to around 1.8755, and that is what turned the 1 hour UP. But the bounce never turned the 4 hour or the daily, so the direction stayed SELL. When the bounce ran out, the 15 minute and 30 minute were the first entry charts to line up again.
The honest part: the 4 hour trailing level has tightened about 25 pips, but it still sits 44.1 pips behind the entry, because a 4 hour structure moves slowly. Price is about 31.5 pips below the entry today.
5. A 5.5 Pip Stop On A Cross: Watch The Spread
Today’s board has a lesson about small stops that most traders never think about.
The 15 minute ticket risks just 5.5 pips. On a major like EURUSD that might be fine. On a cross like GBPCAD, the spread is usually wider, and at quiet hours it can be 2 pips or more. Check your own broker’s spread, because it varies.
If the spread is 2 pips, that is more than a third of a 5.5 pip stop used up the moment you enter. The trade starts a long way behind, and a normal flicker in price can reach the stop.
That does not make the 15 minute ticket wrong. It means:
- Know your spread before you take a ticket with a tight stop
- On crosses, the 30 minute and 4 hour tickets often give the spread less weight, because their stops are wider
- Size from the stop, so a wider stop simply means a smaller lot, and the risk stays the same
GBPCAD is quoted in Canadian dollars, so one pip on a standard lot is worth roughly $7.10 with USDCAD around 1.41. Check the exact figure on your platform. At 0.5 percent of a $10,000 account, which is $50 of risk:
| Chart | Stop distance | Lot size for $50 of risk |
|---|---|---|
| M15 | 5.5 pips | about 1.28 lots |
| M30 | 9.5 pips | about 0.74 lots |
| H4 | 69.5 pips | about 0.10 lots |
Same $50 on every ticket. The 15 minute needs more than twelve times the lot size of the 4 hour, and the larger the lot, the more every pip of spread costs you.
On a small account, a cent account makes the right size possible. For small balances we recommend a RoboForex Cent account or an XM Micro account. These are partner links, so we may receive a commission at no cost to you.
We risk at most 2 percent per trade, usually 0.5 percent. If you are worrying about every trade, your lot size is still too big.
6. What To Watch
The levels that matter:
- The 15 minute trailing stop at 1.87411, the closest level above price
- The 30 minute stop at 1.87445
- The 4 hour trailing stop at 1.88104, the level that would close the main ticket
- The next targets below: 1.87317 on the 15 minute, 1.87255 on the 30 minute, then 1.86274 on the 4 hour
The 1 hour: if it turns back DOWN, it lines up with the confirmed direction and becomes the fourth triggered chart, with a ticket of its own.
What would change the picture: if the 4 hour turned UP while the daily stayed DOWN, the direction would no longer be confirmed, the verdict would move to NO TRADE, and every entry chart would stop being trigger ready until the two big charts agreed again.
Nobody knows which level price reaches first. The panel shows you which charts are triggered, and which are waiting.
Direction First, Then The Trigger
Put the board together.
The 4 hour and the daily confirmed the direction: SELL. That made every entry chart trigger ready. Three of them lined up and printed tickets. One, the 1 hour, is still waiting after the bounce, and that is fine.
You never need every chart to agree. You need the two big charts to agree, and one entry chart to line up.
The Direction Sniper 28 Pair Edition puts this exact panel on GBPCAD and 27 other pairs:
- Direction. The 4 hour and the daily confirm one verdict, so you always know which way you are allowed to trade.
- Rallies that have not broken structure. A bounce can turn the 1 hour without changing the direction. The panel shows you that the big charts never turned.
- The stop loss. Every triggered chart prints its own ticket with its own stop, so you can choose the ticket whose stop suits your spread and your account.
28 pairs, one licence, MT4 or MT5.
Want a read like this in your inbox? Join The Daily Sniper Read, free, every trading day.
GBP CAD Forecast Today: Frequently Asked Questions
What is the GBP CAD forecast today, 26 October 2026?
The Direction Sniper panel reads SELL on GBPCAD, because the 4 hour and the daily both point down. The status reads Sell on M15, M30, H4.
The 1 hour reads UP after last week’s bounce, so it has no ticket. Price was around 1.8735 at the time of writing.
Do all timeframes need to agree before you trade?
No. With Direction Sniper, the 4 hour and the daily must agree to confirm the direction. Once they do, each entry timeframe is trigger ready on its own.
You only need one entry chart to line up with the confirmed direction. That chart prints its own ticket, without waiting for the others.
What does trigger ready mean on Direction Sniper?
When the 4 hour and the daily confirm a direction, every entry timeframe, the 15 minute, 30 minute, 1 hour and the 4 hour itself, becomes trigger ready.
The moment any one of them lines up with the confirmed direction, it prints a ticket with its own entry, stop loss and three targets. A chart pointing the other way simply waits until it turns back in line.
Why does the GBPCAD 1 hour read UP while the verdict is SELL?
The bounce on 23 October turned the 1 hour UP, but it never turned the 4 hour or the daily, so the direction stayed SELL.
The 1 hour has no ticket because it points against the verdict. It is not a buy, because there is no BUY verdict. If it turns back DOWN, it becomes another triggered chart.
Did the GBPCAD 4 hour ticket reach a target?
Yes. The 4 hour sell from 1.87663 on 22 October had a stop at 1.88358, which is 69.5 pips of risk. GBPCAD dipped to around 1.8686 on 23 October and reached Target 1 at 1.86968.
Its other targets are 1.86274 and 1.85579. Its trailing level at 1.88104 still sits 44.1 pips behind the entry. Price reaching a published target level is not the same as a realised result.
Why does the spread matter on a small stop?
The GBPCAD 15 minute ticket risks only 5.5 pips. On a cross the spread is often wider than on a major, and if it is 2 pips, more than a third of the stop is used the moment you enter.
Know your broker’s spread before taking a tight stop. On crosses, tickets with wider stops, such as the 30 minute or 4 hour, often give the spread less weight.
What lot size goes with the GBPCAD tickets?
One pip on a standard GBPCAD lot is roughly $7.10 with USDCAD around 1.41. To risk $50, which is 0.5 percent of a $10,000 account, a 5.5 pip stop needs about 1.28 lots, a 9.5 pip stop about 0.74 lots, and a 69.5 pip stop about 0.10 lots.
We risk at most 2 percent per trade, usually 0.5 percent. These figures are arithmetic for illustration, not a recommendation about how much anyone should trade.
Disclaimer: This post reports what the Direction Sniper panel showed on GBPCAD on 26 October 2026. It is educational analysis, not financial advice and not a trade signal service. The 4 hour, 30 minute and 15 minute tickets were still open at the time of writing. Price reaching a published target level is not the same as a realised result. High and low levels are approximate readings from the chart. Spreads, pip values and lot sizes are illustrations, depend on your broker and the exchange rate, and are not a recommendation about how much anyone should trade. Forex trading carries risk, and you should only trade money you can afford to lose.

