Gold and Silver Price Forecast Today, 3 November 2026: The Bounce Ran Out, And Both Metals Printed Fresh Sells. Here Is What Waiting Bought
Quick answer: gold and silver price forecast today, 3 November 2026: SELL on both metals. Every timeframe on the Direction Sniper panel, from the 15 minute to the daily, reads DOWN on gold and on silver. After yesterday’s bounce ran out, a fresh gold 1 hour sell printed at 3926.41 and a fresh silver 1 hour sell at 50.129. The gold 4 hour trailing stop is now 18.28 points in front of its entry, and silver’s 4 hour has reached two of its three targets.
Stand on a beach when the tide is going out and watch the waves.
Every so often, a big one rushes up the sand. It looks like the sea is coming back in. People step back. But if you wait a few minutes, you notice something: the next wave stops a little shorter. And the one after that, shorter again. The wave was real. The tide never changed.
That is what gold and silver did over the last 24 hours.
Yesterday, in our gold and silver price forecast, both metals were bouncing hard after Friday’s fall, and the lesson was simple: oversold means wait. Today you can see what waiting bought. The bounce ran out, the faster charts turned back DOWN, and fresh sell tickets printed on both metals.
But not every ticket made it through the wave. One gold ticket was caught by it, and it is the most useful thing in today’s read. We will get to it in section 4.
For the full currency board, today’s three pairs and what the US dollar is doing, see today’s Currency Strength Today read.
1. Gold And Silver Today: The Board
| Market | Chart | Entry | Targets reached | Status |
|---|---|---|---|---|
| Gold | H4 | 4007.13 | 1 of 3 | Running, trailing stop in front of the entry |
| Gold | H1 | 3926.41 | 0 of 3 | Fresh this morning |
| Gold | M30 | 3941.88 | 0 of 3 | Closed at trailing stop |
| Gold | M15 | 3940.69 | 1 of 3 | Running |
| Silver | H4 | 52.799 | 2 of 3 | Running, trailing stop in front of the entry |
| Silver | H1 | 50.129 | 1 of 3 | Running |
| Silver | M15 | 50.297 | 2 of 3 | Running |
| Chart | Gold | Silver |
|---|---|---|
| M15 | DOWN | DOWN |
| M30 | DOWN | DOWN |
| H1 | DOWN | DOWN |
| H4 | DOWN | DOWN |
| Daily | DOWN | DOWN |
Yesterday, the faster charts had turned UP on the bounce. This morning, every chart on both metals reads DOWN, and the status reads Sell on M15, M30, H1, H4. The wave has gone back out.
2. Gold Price Forecast Today: The 4 Hour Tide
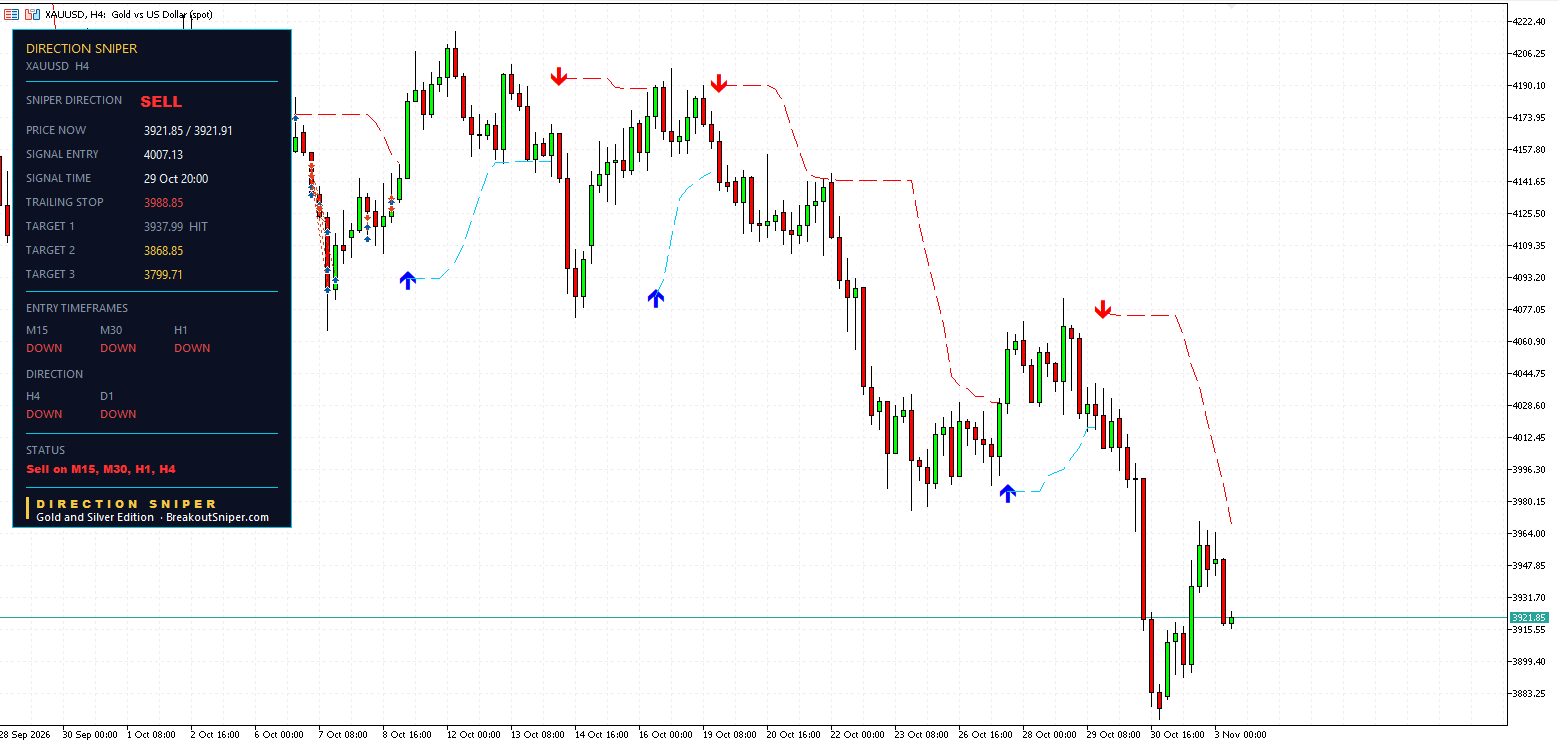
Zoom out to the 4 hour chart, and the tide is easy to see.
In early October, gold traded between roughly 4100 and 4215. It broke lower on 21 and 22 October, bounced to around 4080 on 28 October, then fell hard into Friday, down to around 3,875. Each rally stopped lower than the one before. Lower highs, lower lows. A tide going out.
The 4 hour sell printed on 29 October at 20:00 at 4007.13.
- Trailing stop: 3988.85
- Target 1: 3937.99, reached
- Target 2: 3868.85
- Target 3: 3799.71
Here is the quiet headline. On Friday, this stop sat at 4074.25. This morning it was at 4004.41. Now it has trailed to 3988.85, 18.28 points in front of the entry. If the stop is moved to the panel’s level, this ticket can no longer close at a loss, whatever the next wave does.
Gold is at 3921.85, and every timeframe reads DOWN. We explain how the 4 hour and the daily decide gold’s direction in our guide to multi timeframe analysis for gold.
3. Gold 1 Hour Analysis: The Fresh Sell After The Wave
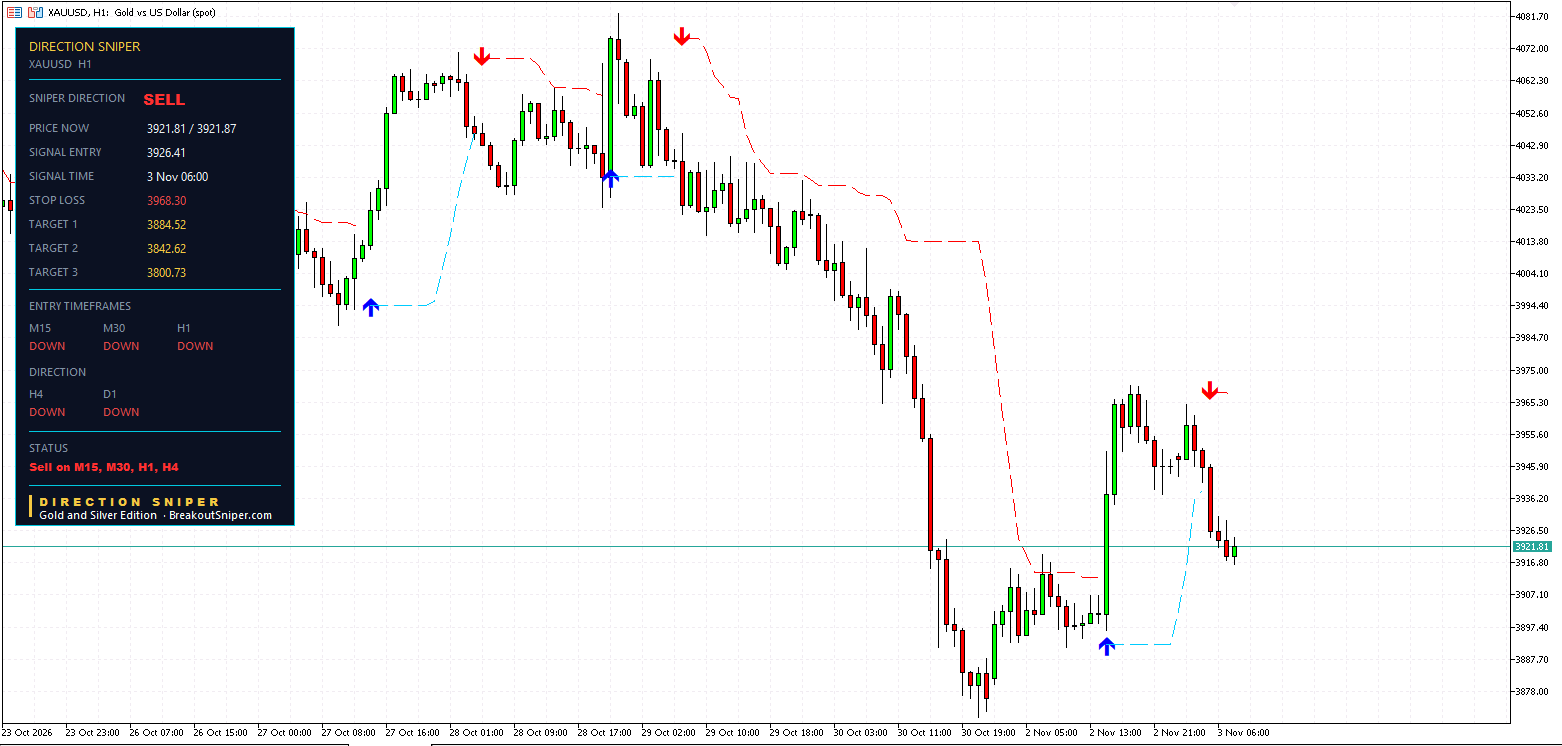
On the 1 hour chart, you can watch the whole wave.
Gold bottomed around 3,875 on Friday 30 October. On Monday 2 November it bounced, slowly at first, then sharply in the afternoon, up to around 3,970. That was the big wave rushing up the beach.
Then it stalled. A second, smaller push in the early hours of today stopped around 3,965, a little shorter than the first. And from there, gold turned back down. The 1 hour sell printed at 06:00 this morning at 3926.41.
- Stop: 3968.30
- Target 1: 3884.52
- Target 2: 3842.62
- Target 3: 3800.73
Look where the stop sits: 3968.30, just above the top of the wave. That is what waiting buys you. A trader who sold at Friday’s low had to sit through the whole bounce. A trader who waited got a ticket with the stop above the bounce, instead of in the middle of it.
Gold is at 3921.81, about 4.6 points below the entry.
4. Gold 30 Minute: The Ticket The Wave Caught
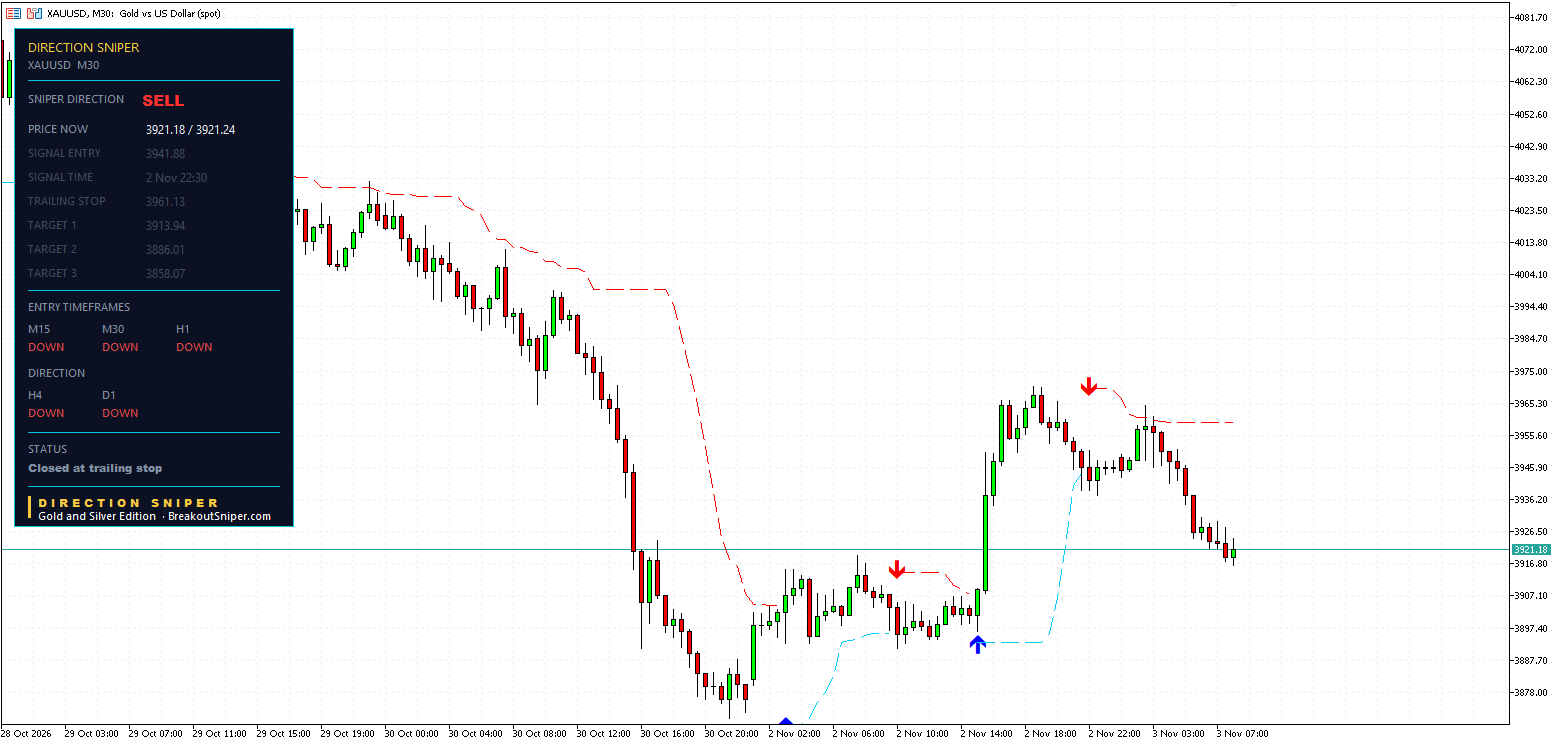
Not every ticket made it.
The 30 minute sell printed on 2 November at 22:30 at 3941.88, after the first wave had peaked. It looked like the bounce was over. But the second, smaller push came up the beach in the early hours of today, reached the trailing stop at 3961.13, and the ticket closed 19.25 points behind its entry. None of its targets were reached. Gold then fell.
It is tempting to skip a ticket like that. We think it is the most useful one on the board, for three reasons.
First, the direction was right. The tide was going out. The ticket was simply early, inside a wave that had one more push in it. Being right about the direction and still being stopped out is normal. It happens to every trader, on every method.
Second, the trailing stop made the miss smaller. This ticket printed with an original stop at 3969.82, 27.94 points above the entry. By the time the second push arrived, the panel’s trailing stop had already moved down to 3961.13. So the ticket closed 19.25 points behind its entry, not 27.94.
Here is what that difference looks like in money, on a $10,000 account risking 0.5 percent, or $50:
| At the original stop | At the trailing stop | |
|---|---|---|
| Distance behind the entry | 27.94 points | 19.25 points |
| Cost | $50.00 | $34.45 |
| Share of the planned risk | 100% | about 69% |
At $100 per point per lot, $50 of risk on a 27.94 point stop is about 0.018 lots. Closing at the trailing stop instead of the original stop saved $15.55, almost a third of the planned risk. On a broker that only allows 0.01 lots, the same ticket would have cost $19.25 instead of $27.94.
That is the job of the trailing stop. It does not stop a ticket from closing behind its entry. It makes sure that, when it does, the cost is smaller than the plan allowed.
Third, it is why the stop and the size come before the entry. A ticket closing behind its entry is a planned, measured cost when the lot size was set for the stop. It only becomes a problem when the size was too big. That is the whole job of section 8.
5. Gold 15 Minute: Target 1 Already Reached
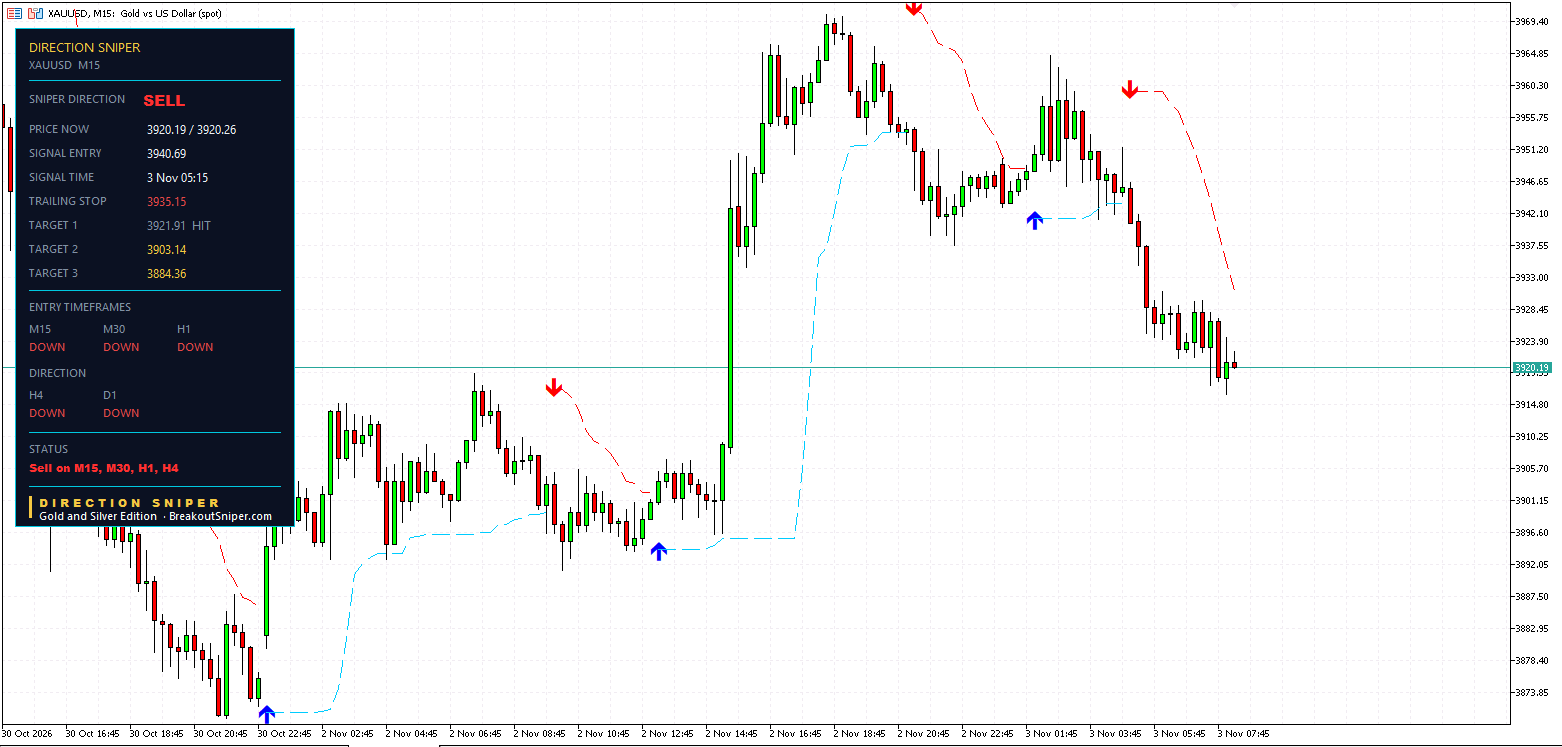
The 15 minute sell printed at 05:15 this morning at 3940.69, just after that second wave stalled. It has already reached Target 1 at 3921.91, and its trailing stop has moved to 3935.15, already 5.54 points in front of the entry.
- Target 2: 3903.14
- Target 3: 3884.36
Gold is at 3920.19.
6. Silver Price Forecast Today
Silver 4 Hour: Two Targets Reached, Stop Trailing Fast
Silver tells the same story, a little further along.
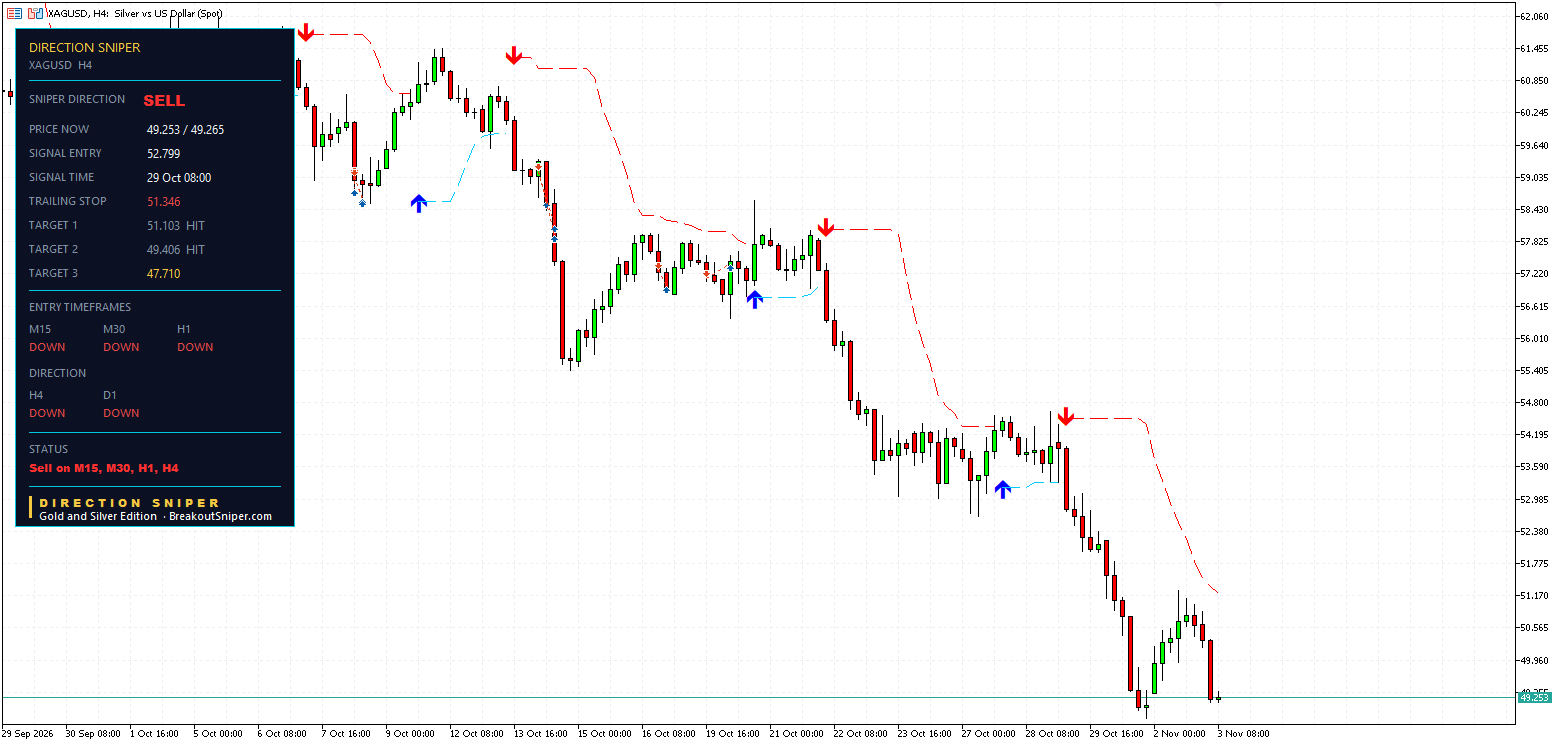
Since early October, silver has slid from above 61 to below 50, with each rally stopping lower than the last. The 4 hour sell printed on 29 October at 08:00 at 52.799 and has reached Target 1 at 51.103 and Target 2 at 49.406.
And the stop keeps moving. On Friday it sat at 54.495. Yesterday it was 53.335, just behind the entry. This morning it has trailed to 51.346, 145.3 cents in front of the entry.
- Trailing stop: 51.346
- Target 3: 47.710, still open
Silver is at 49.253.
Silver 1 Hour And 15 Minute: Fresh Sells, Already Working
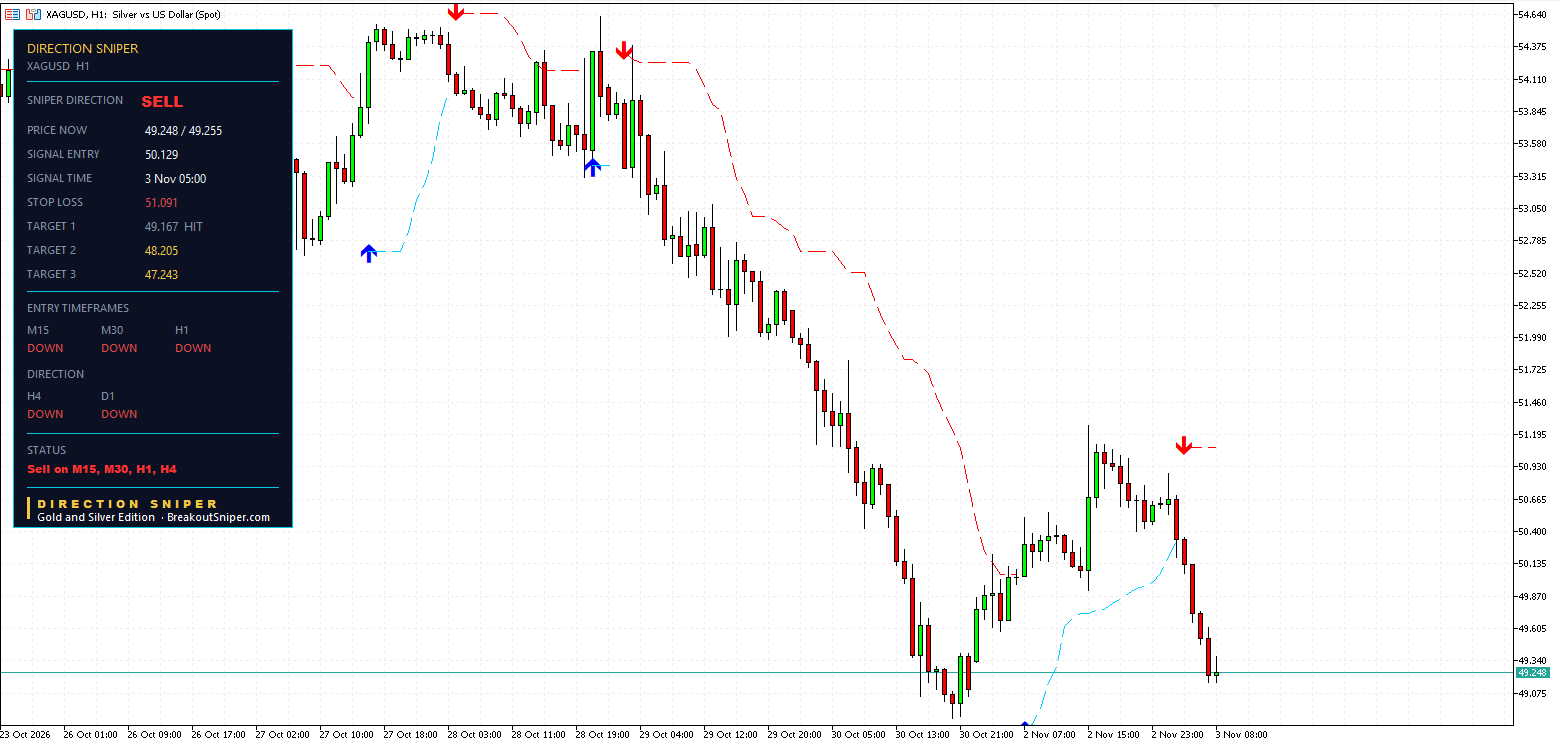
Silver’s wave peaked around 51.25 on the afternoon of 2 November. The fresh 1 hour sell printed at 05:00 this morning at 50.129, and it has already reached Target 1 at 49.167.
- Stop: 51.091
- Target 2: 48.205
- Target 3: 47.243
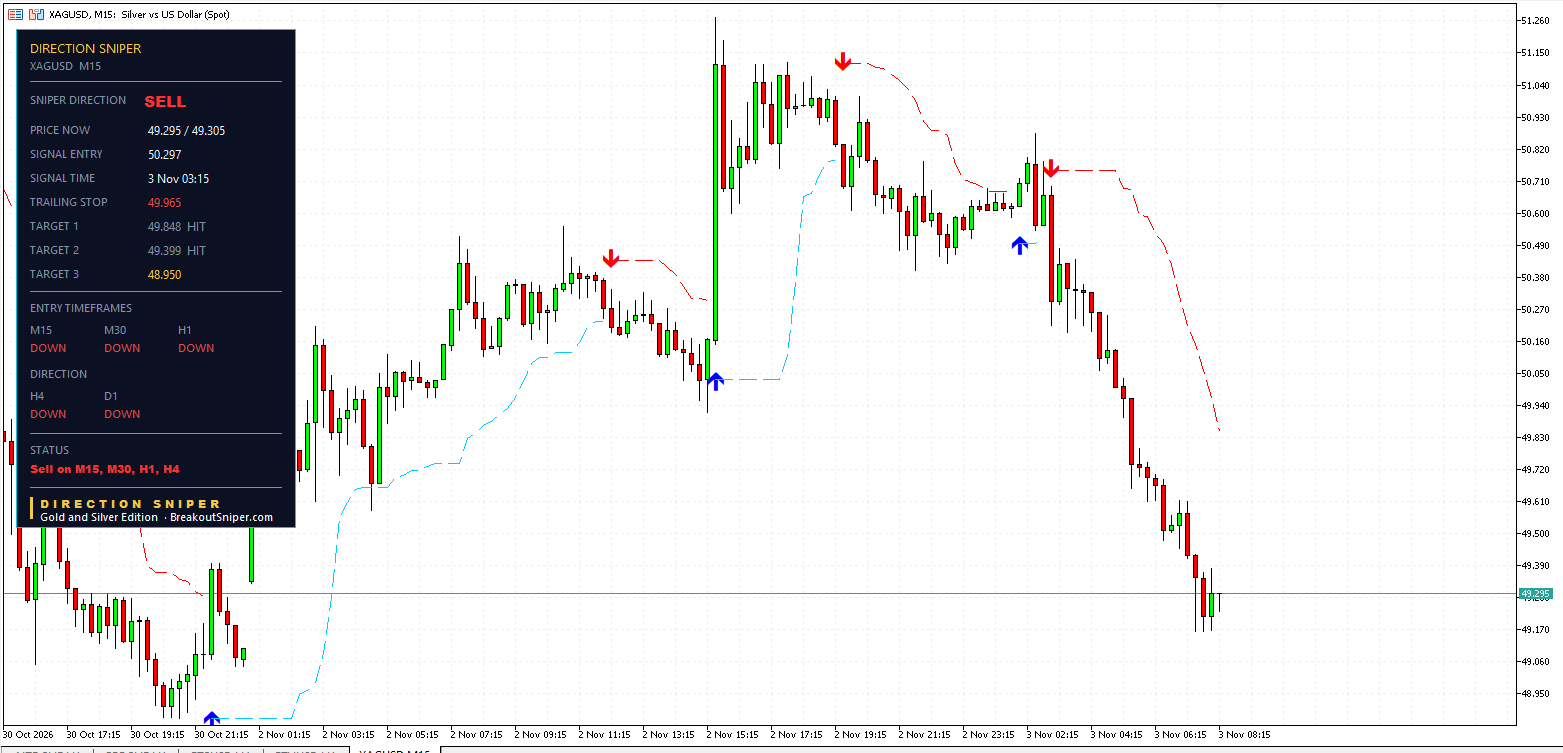
The 15 minute sell from 03:15 at 50.297 is further along. It has reached Target 1 at 49.848 and Target 2 at 49.399, and its trailing stop sits at 49.965, 33.2 cents in front of the entry. Target 3 is 48.950.
7. Which Gold And Silver Ticket Makes Sense Today?
A ticket is only useful if its numbers still make sense from where price is now. Think of parking a car: a big space in front is no use if there is a wall right behind your bumper.
| Ticket | Distance to its stop | Distance to its next target |
|---|---|---|
| Gold H4 | 67.00 points | 53.00 points to Target 2 |
| Gold H1 | 46.49 points | 37.29 points to Target 1, 79.19 to Target 2 |
| Gold M15 | 14.96 points | 17.05 points to Target 2 |
| Silver H4 | $2.093 | $1.543 to Target 3 |
| Silver H1 | $1.843 | $1.043 to Target 2, $2.005 to Target 3 |
| Silver M15 | $0.670 | $0.345 to Target 3 |
Distances are from gold at around 3,921 and silver at around 49.25, as shown on each chart.
Read it line by line.
Gold H1 is the freshest gold ticket, with price close to its entry. Its stop and Target 1 are roughly the same distance away, and Target 2 is further than the stop. From today’s price, it is the closest thing on the gold board to the plan as printed.
Gold H4 and Gold M15 are tickets to manage, not to start. Both already have their stops in front of the entry.
Silver is further along. The H1 and M15 have already reached targets, and from today’s price, every silver stop is further away than the next target. These are tickets for someone already in the trade.
These are the markets we are watching, not trade recommendations.
8. Gold Lot Size: Same Risk, Smaller Lot
We risk at most 2 percent per trade, usually 0.5 percent, so on a $10,000 account that is $50.
On most platforms, one standard lot of gold is 100 ounces, so a 1 point move is $100 per lot.
- The gold 1 hour ticket from today’s price: a 46.49 point stop, so $50 of risk is about 0.01 lots.
- The gold 15 minute ticket from today’s price: a 14.96 point stop, so $50 of risk is about 0.03 lots.
On silver, one standard lot is usually 5,000 ounces, so a 1 cent move is $50 per lot. From today’s price, the silver 1 hour stop is $1.843 away, so $50 of risk is about 0.005 lots, smaller than most standard accounts allow.
That is not a reason to round up. It is the reason the gold 30 minute ticket in section 4 was a small, planned cost and not a disaster. Here is how to calculate lot size for gold from any stop, or work it out in seconds with our free Gold and Silver Lot Size Calculator.
On a small account, a cent account makes the right sizes possible. For small balances we recommend a RoboForex Cent account or an XM Micro account. These are partner links, so we may receive a commission at no cost to you.
Lot size is the seatbelt. It does not stop the crash. It decides how badly you get hurt. If you are worrying about every trade, your lot size is still too big.
9. What This Means For The US Dollar
In today’s Currency Strength Today read, the US dollar is still the weakest currency on the bigger charts, for the third trading day in a row, even though it bounced over the last 24 hours.
Normally, a weak dollar lifts gold. It has not. Gold and silver both read SELL on every timeframe. That is why our US Dollar Today verdict stays MIXED, and why the lesson from last week still holds: trade gold on its own trend, not on a rule of thumb about the dollar.
10. What Would Change The Gold And Silver Forecast
What would keep the tickets moving: gold breaking below Friday’s low around 3,875, close to the 4 hour Target 2 at 3868.85, and silver breaking below its recent low around 49.00.
What would change the verdict: the 4 hour turning UP. If it did while the daily stayed DOWN, the panel would move to NO TRADE and stand aside.
Levels to watch, read from the chart:
- Gold: the top of yesterday’s wave around 3,970, and the 1 hour stop at 3968.30
- Gold: Friday’s low around 3,875
- Silver: the wave high around 51.25, and the 4 hour trailing stop at 51.346
The Tide, The Waves, And The Wait
Put the board together.
Yesterday’s bounce was a big wave. It was real, it was sharp, and it caught one gold ticket that was early. But the tide never changed. The 4 hour and the daily kept reading DOWN, the next wave stopped shorter, and this morning both metals printed fresh sells with their stops above the bounce instead of in the middle of it. The gold 4 hour and the silver 4 hour now both have their trailing stops in front of their entries.
That is Direction Sniper:
- Direction. One verdict from the 4 hour and the daily. On both metals, through the whole bounce, it read SELL.
- Rallies and bounces that have not broken structure. Yesterday’s bounce turned the fast charts UP. It never turned the verdict.
- The stop loss. Every ticket arrives with its stop and three targets marked. One closed behind its entry today, and that is exactly why size comes first.
The Direction Sniper Gold and Silver Edition puts this panel on XAUUSD and XAGUSD, on MT4 or MT5.
See the Gold and Silver Edition
Today’s other reads: the full table in Currency Strength Today, and our Pick of the Day in the CHF JPY forecast, where every timeframe reads UP. Every morning’s board lives on our Currency Strength Today page.
Want tomorrow’s read in your inbox before the tide turns? Join The Daily Sniper Read, free, every trading day.
Gold and Silver Price Forecast Today: Frequently Asked Questions
Updated 3 November 2026. Levels are as shown on the Direction Sniper panel at the time of writing.
1What is the gold and silver price forecast today, 3 November 2026?+
Every timeframe on the Direction Sniper panel, from the 15 minute to the daily, reads DOWN on both metals, so the direction is SELL.
After yesterday’s bounce ran out, a fresh gold 1 hour sell printed at 3926.41 and a fresh silver 1 hour sell at 50.129.
2Is gold still a sell after the bounce?+
Yes. Gold bounced from around 3,875 to around 3,970, then stalled, and every timeframe turned back DOWN. The 4 hour and the daily never changed.
A bounce turns the fast charts. A turn turns the big ones.
3Where is the gold 4 hour trailing stop?+
The gold 4 hour sell from 4007.13 has reached Target 1 at 3937.99. Its trailing stop has moved to 3988.85, 18.28 points in front of the entry.
If the stop is moved to that level, the ticket can no longer close at a loss. Target 2 is 3868.85.
4Why did the gold 30 minute ticket close?+
The 30 minute sell from 3941.88 printed after the first wave of the bounce had peaked. A second, smaller push reached its trailing stop at 3961.13, and it closed 19.25 points behind the entry, before gold fell.
Because the trailing stop had already moved down from the original stop at 3969.82, the ticket closed 19.25 points behind its entry instead of 27.94. On $50 of planned risk, that is a cost of about $34.45 instead of $50.
5Is silver still a sell?+
Yes. Every silver timeframe reads DOWN. The 4 hour sell from 52.799 has reached Targets 1 and 2, and its trailing stop is 51.346, 145.3 cents in front of the entry.
A fresh 1 hour sell from 50.129 has already reached Target 1 at 49.167.
6Which gold ticket has the most room today?+
From around 3,921, the gold 1 hour has its stop 46.49 points away and Target 1 37.29 points away, with Target 2 79.19 points away. Price is close to its entry of 3926.41.
The gold 4 hour and 15 minute are tickets to manage, not to start. This is not a trade recommendation.
7Why is gold falling when the US dollar is weak?+
Normally a weak dollar lifts gold, but this week it has not. The dollar is the weakest currency on our board, and gold and silver still read SELL on every timeframe.
That is why our US Dollar Today verdict is MIXED. Trade gold on its own trend, not on a rule of thumb about the dollar.
8What lot size should I use on gold today?+
We risk at most 2 percent per trade, usually 0.5 percent, which is $50 on a $10,000 account. At $100 per point per lot, the gold 1 hour stop of 46.49 points is about 0.01 lots.
Use the Gold and Silver Lot Size Calculator to work out your own size. These figures are arithmetic for illustration, not a recommendation about how much anyone should trade.
DIRECTION SNIPER GOLD AND SILVER EDITION
See gold and silver the moment a ticket prints.
Direction, entry, stop and three targets on XAUUSD and XAGUSD. MT4 or MT5.
Disclaimer: This post reports what the Direction Sniper panel showed on XAUUSD and XAGUSD on 3 November 2026. The tickets were running at the time of writing, and prices will have moved by the time you read this. It is educational analysis, not financial advice and not a trade signal service, and nothing here is a recommendation to buy or sell. Price reaching a published target or stop level is not the same as a realised result. A target shown as reached, or a ticket shown as closed, describes the panel and does not describe anyone’s trade. High and low levels are approximate readings from the chart. Contract sizes and lot sizes are arithmetic for illustration, vary by broker, and are not a recommendation about how much anyone should trade. Trading gold and silver carries risk, and you should only trade money you can afford to lose.

