USD CAD Forecast Today, 30 October 2026: The Weakest Currency Against The Strongest, And Every Chart Reads SELL
This USD CAD forecast today starts with the strength board.
In today’s currency strength today read, the US dollar is the weakest of the eight major currencies and the Canadian dollar is the strongest. USDCAD puts the two against each other, which is why it is today’s Pick of the Day.
The Direction Sniper panel agrees. Every timeframe reads DOWN, from the 15 minute to the daily, and all four entry charts have a sell ticket on the board. The 15 minute ticket has already reached Target 1 this morning.
Here is what each ticket says, and which one still makes sense from where price is now.
1. The Board: Four Tickets, One Direction
| Chart | Entry | Signal time | Risk | Targets reached | Status |
|---|---|---|---|---|---|
| H4 | 1.39928 | 29 Oct 00:00 | 81.0 pips | 0 of 3 | Running |
| H1 | 1.39710 | 29 Oct 19:00 | 33.8 pips | 0 of 3 | Running |
| M30 | 1.39710 | 29 Oct 19:00 | 36.5 pips | 0 of 3 | Running |
| M15 | 1.39812 | 30 Oct 00:15 | 12.7 pips | 1 of 3 | Running |
The status line on every chart reads Sell on M15, M30, H1, H4. The 4 hour and the daily both read DOWN, so the direction is settled. The only question left is the entry.
2. The 4 Hour: The Trend Behind The Pick
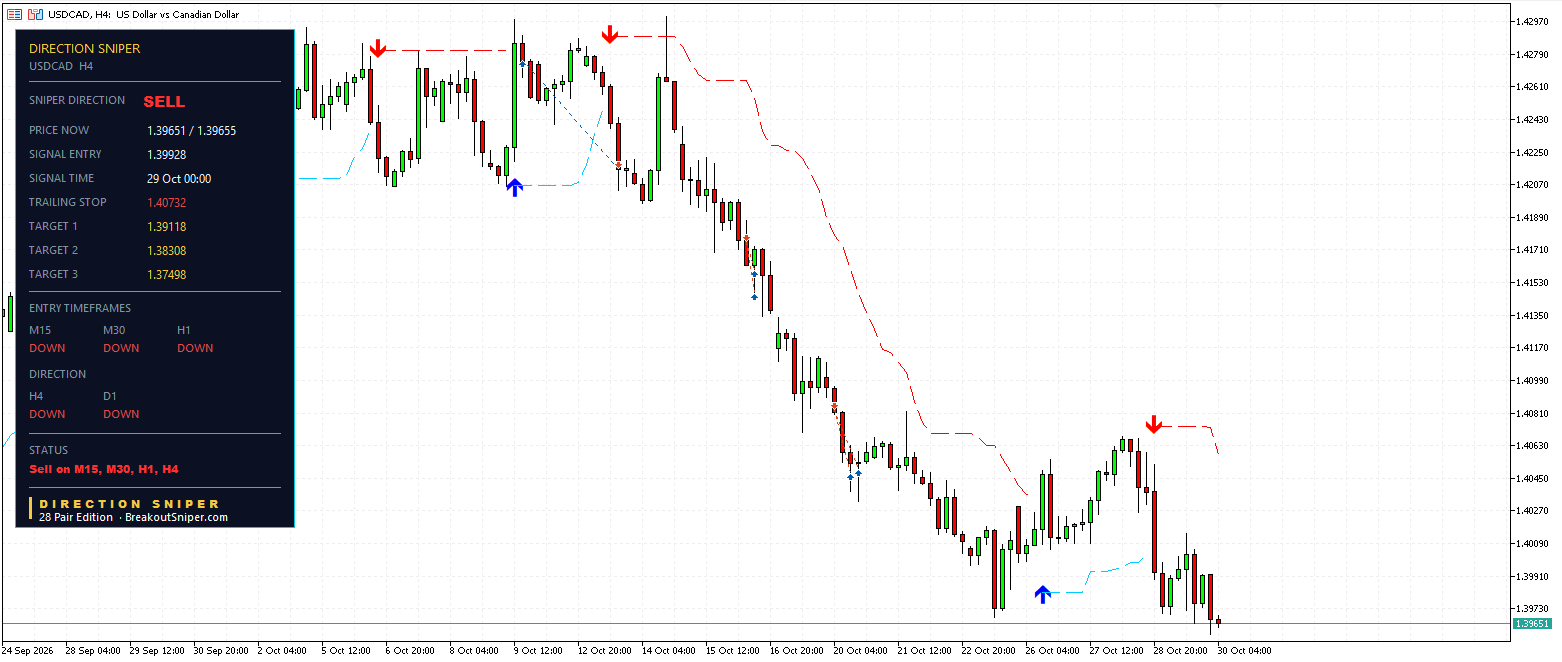
On the 4 hour chart, USDCAD topped out near 1.4300 in early October. From mid October it fell steadily to around 1.3975 by 22 October, and every bounce on the way down stopped below the one before it.
Then came a rally to around 1.4070 on 28 October. On the chart, that bounce could have looked like the start of a turn. The panel never treated it as one. The daily stayed DOWN, and once the 4 hour turned back, the sell ticket printed on 29 October at 00:00 at 1.39928.
USDCAD is now 1.39651, about 27.7 pips below that entry, and back near the October lows.
- Trailing stop: 1.40732
- Target 1: 1.39118
- Target 2: 1.38308
- Target 3: 1.37498
No target has been reached yet. This is the ticket that tells you the direction, not the one that gives the tightest entry.
3. The Faster Charts: Three Sells Since Yesterday
The 1 Hour
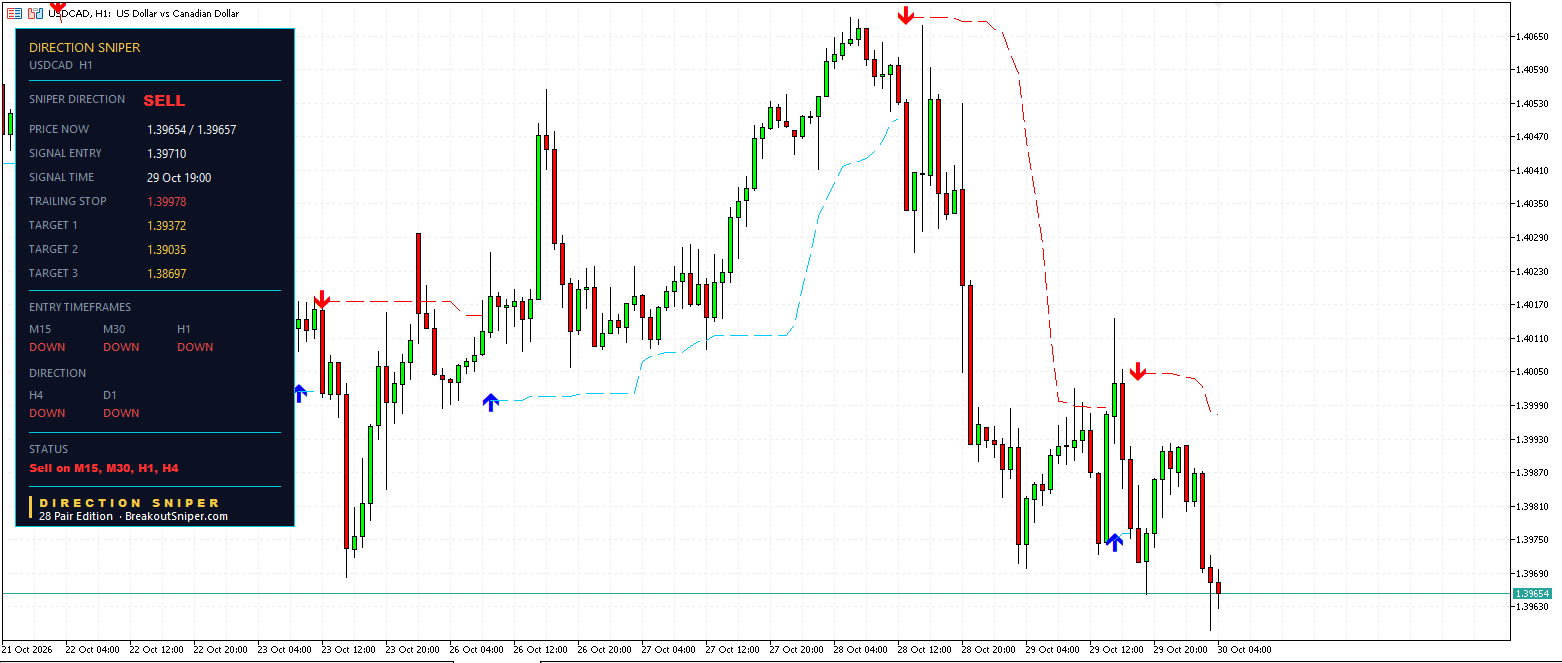
The 1 hour sell printed on 29 October at 19:00 at 1.39710, after a bounce to around 1.4015 failed. USDCAD has since slipped to 1.39654, just 5.6 pips below the entry.
- Trailing stop: 1.39978
- Target 1: 1.39372
- Target 2: 1.39035
- Target 3: 1.38697
The 30 Minute
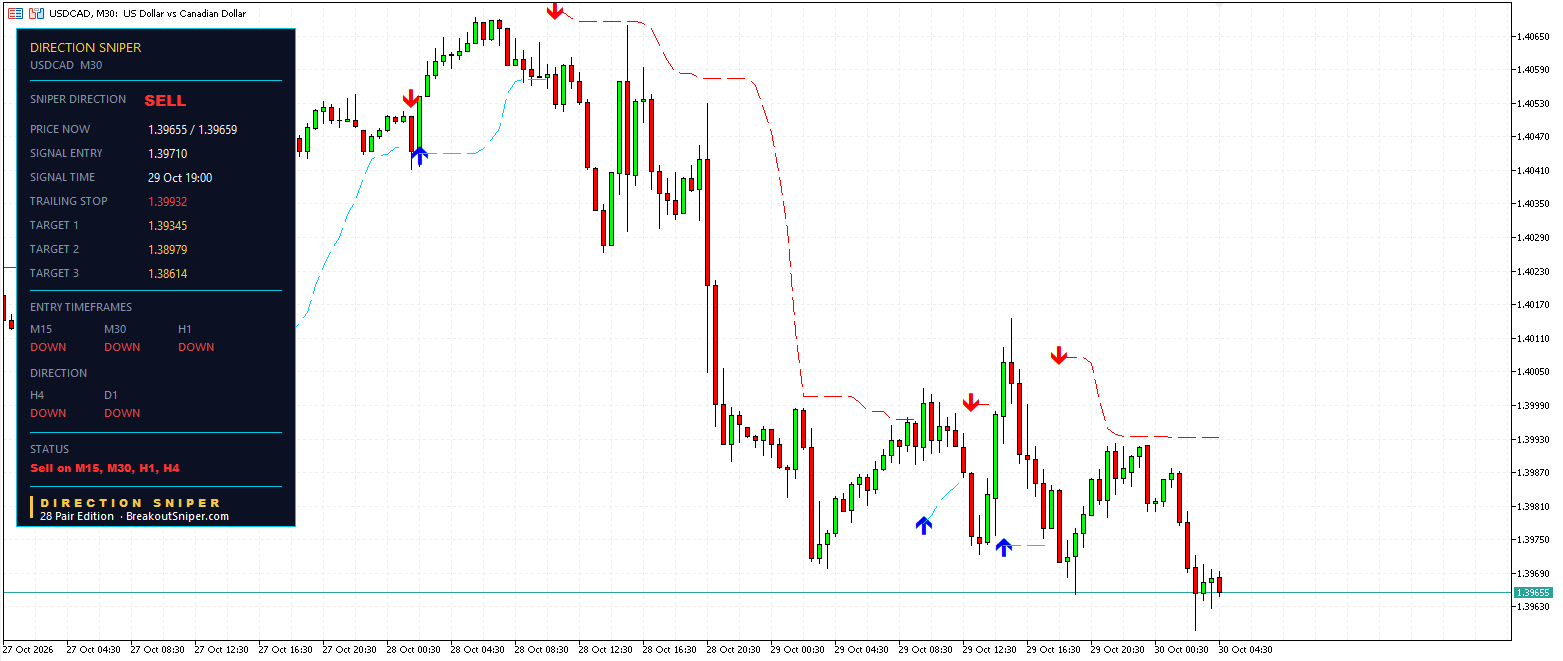
The 30 minute sell printed at the same time and the same price, 29 October at 19:00 at 1.39710. Two charts printing together is a sign the bounce ran out on more than one timeframe at once.
Its trailing stop has already come down to 1.39932, 22.2 pips behind the entry, so part of its original risk is gone. Target 1 is 1.39345, Target 2 is 1.38979 and Target 3 is 1.38614.
The 15 Minute
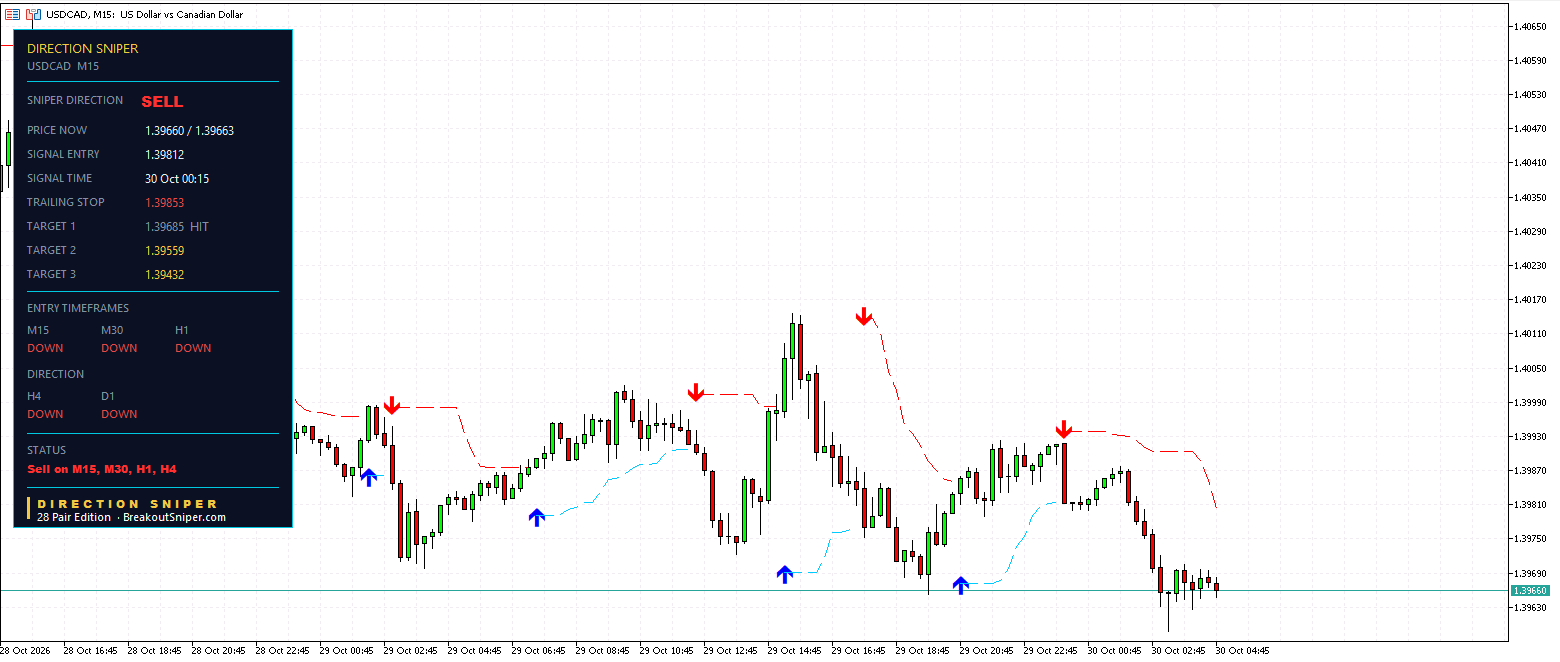
The newest ticket is on the 15 minute chart, printed at 00:15 this morning at 1.39812. Target 1 at 1.39685 was reached within hours, and USDCAD dipped to around 1.3960 before steadying.
Its trailing stop now sits at 1.39853, just 4.1 pips behind the entry. Target 2 is 1.39559 and Target 3 is 1.39432, both still open.
4. Which USDCAD Ticket Still Makes Sense Today?
The direction is not the question. Every chart agrees. The question for a trader arriving today is room: how far is the stop, and how far is the next target, from where price is now?
| Ticket | Distance to its stop from 1.39655 | Distance to its next target |
|---|---|---|
| H4 | 107.7 pips | 53.7 pips to Target 1 |
| H1 | 32.3 pips | 28.3 pips to Target 1 |
| M30 | 27.7 pips | 31.0 pips to Target 1 |
| M15 | 19.8 pips | 9.6 pips to Target 2 |
Look at the 30 minute and 1 hour lines. From today’s price, the stop and Target 1 are roughly the same distance away, with two more targets beyond each. That is the closest thing on this board to the plan as printed.
The 4 hour is the opposite. Anyone starting it from today’s price would need a stop more than 100 pips away to reach a first target about 54 pips away. It is a ticket to manage, not one to start.
The 15 minute has already done its first job. Its next target is less than 10 pips away, but so much of the move is behind it that it suits someone already in the trade more than someone arriving now.
This is the pair we are watching most closely today, not a trade recommendation.
5. It Is Friday: Plan For The Weekend
All four tickets are still open, and the market closes for the weekend tonight.
A ticket left open over the weekend can open on Monday beyond its stop, especially if there is news while the market is shut. If you hold a USDCAD position over the weekend, size for that gap. Or decide before the close whether to hold at all.
6. Same Risk, Very Different Lot Sizes
Every ticket gets the same risk. We risk at most 2 percent per trade, usually 0.5 percent, so on a $10,000 account that is $50, whichever chart the ticket is on.
USDCAD is quoted in Canadian dollars, so one pip on a standard lot is 10 Canadian dollars, roughly $7.16 with USDCAD near 1.3965. Check the exact figure on your platform.
- The 30 minute ticket from today’s price: a 27.7 pip stop, so $50 of risk is about 0.25 lots.
- The 4 hour ticket from today’s price: a 107.7 pip stop, so the same $50 of risk is about 0.06 lots.
Same pair, same direction, same $50 at risk, and one lot size is four times the other. A wider stop does not mean more risk. It means a smaller lot. To work out your own size in seconds, use our free USDCAD Lot Size Calculator.
On a small account, a cent account makes sizes like that possible. For small balances we recommend a RoboForex Cent account or an XM Micro account. These are partner links, so we may receive a commission at no cost to you.
If you are worrying about every trade, your lot size is still too big.
7. What Would Change The Picture
The verdict stays SELL while the 4 hour and the daily both read DOWN.
What would keep the tickets moving: USDCAD breaking below this morning’s low around 1.3960. That would put the 15 minute ticket on its way to Target 2, and bring the 30 minute and 1 hour first targets closer.
What would change the verdict: the 4 hour turning UP. If the 4 hour turned UP while the daily stayed DOWN, the panel would move to NO TRADE and stand aside, the same split that turned EURAUD to NO TRADE overnight in yesterday’s EUR AUD forecast.
Levels to watch, read from the chart:
- This morning’s low around 1.3960
- The 1 hour trailing stop at 1.39978
- The 28 October high around 1.4070
Right Direction, Right Size
Put the board together.
The strength board ranks the US dollar as the weakest currency and the Canadian dollar as the strongest. The 4 hour and the daily both read DOWN on USDCAD. Four sell tickets are on the board, and the 15 minute has already reached Target 1.
That is Direction Sniper:
- Direction. One verdict from the 4 hour and the daily. On USDCAD it reads SELL.
- Rallies and bounces that have not broken structure. The 28 October rally to around 1.4070 could have looked like a turn. The daily never turned, and the sell tickets followed.
- The stop loss. Every ticket arrives with its stop and three targets marked, so you know your risk before you place the order.
The 28 Pair Edition puts this panel on USDCAD and 27 other pairs, MT4 or MT5, on one licence.
Want the strongest and weakest currencies in your inbox every trading day? Join The Daily Sniper Read, free.
USD CAD Forecast Today: Frequently Asked Questions
Updated 30 October 2026. Levels are as shown on the Direction Sniper panel at the time of writing.
1What is the USD CAD forecast today, 30 October 2026?+
The Direction Sniper panel reads SELL on USDCAD on every timeframe, from the 15 minute to the daily, so the status shows Sell on M15, M30, H1, H4.
USDCAD was around 1.39651 at the time of writing, about 27.7 pips below the 4 hour sell from 29 October.
2Why is USDCAD falling?+
On the currency strength board for 30 October 2026, the US dollar is the weakest of the eight major currencies and the Canadian dollar is the strongest.
USDCAD puts the weakest against the strongest, which is why it is today’s Pick of the Day.
3Which USDCAD ticket still makes sense today?+
From 1.39655, the 30 minute and 1 hour tickets have their stop and Target 1 roughly the same distance away: 27.7 and 31.0 pips on the 30 minute, 32.3 and 28.3 pips on the 1 hour.
The 4 hour would need a stop more than 100 pips away to reach a first target about 54 pips away, so it is a ticket to manage, not one to start. This is the pair we are watching, not a trade recommendation.
4Which USDCAD targets have been reached?+
One. The 15 minute sell from 1.39812 reached Target 1 at 1.39685 this morning.
Its trailing stop level is now 1.39853, just 4.1 pips behind the entry. Price reaching a published target level is not the same as a realised result.
5Should I hold a USDCAD trade over the weekend?+
That is your decision, but plan for it. A ticket left open over the weekend can open on Monday beyond its stop, especially if there is news while the market is shut.
If you hold over the weekend, size for that gap, or decide before Friday’s close whether to hold at all.
6What would change the USDCAD verdict?+
The verdict only changes if the 4 hour turns UP. If the 4 hour turned UP while the daily stayed DOWN, the panel would move to NO TRADE and stand aside.
Levels to watch are this morning’s low around 1.3960, the 1 hour trailing stop at 1.39978 and the 28 October high around 1.4070.
7What lot size should I use on USDCAD?+
We risk at most 2 percent per trade, usually 0.5 percent, which is $50 on a $10,000 account. With one USDCAD pip worth about $7.16 per standard lot, a 27.7 pip stop is about 0.25 lots and a 107.7 pip stop is about 0.06 lots for the same $50.
Use the USDCAD Lot Size Calculator to work out your own size. These figures are arithmetic for illustration, not a recommendation about how much anyone should trade.
8Does Direction Sniper move my stop loss for me?+
No. Direction Sniper calculates the trailing stop level and shows it on your chart as the trade develops.
You move the stop on your own order to match it.
DIRECTION SNIPER 28 PAIR EDITION
See USDCAD and 27 more pairs the moment a ticket prints.
Direction, entry, stop and three targets on all 28 pairs. MT4 or MT5, one licence.
Disclaimer: This post reports what the Direction Sniper panel showed on USDCAD on 30 October 2026. The tickets were running at the time of writing, and prices will have moved by the time you read this. It is educational analysis, not financial advice and not a trade signal service, and nothing here is a recommendation to buy or sell. Price reaching a published target level is not the same as a realised result. A target shown as reached means price touched that level on the chart, and does not describe anyone’s trade. High and low levels are approximate readings from the chart. Pip values and lot sizes are arithmetic for illustration, depend on the exchange rate, and are not a recommendation about how much anyone should trade. Forex trading carries risk, and you should only trade money you can afford to lose.

