USD CAD Forecast Today, 19 October 2026: Most Traders Quit After A Stop Loss. USDCAD Fell 119 Pips Without Them
This USD CAD forecast today is about the moment that decides more trading careers than any strategy ever will: the minute after a stop loss.
On 14 October, a sharp rally reached the stop on the Direction Sniper 4 hour sell. The ticket closed. For most traders, that is where the story ends. They close the platform, decide the read was wrong, and walk away.
Here is what they missed.
USDCAD now trades at about 1.41210. That is 119 pips below where the 4 hour first called the sell, 2.5 times that ticket’s original risk, and past the levels where its first two targets sat. And since that stop out, the panel has found three fresh entries and seven targets have been reached, all in the same direction.
The read was never wrong. Only the room was. Here is the whole story, every number, and the lesson that keeps traders in the game.
The Board Today
| Chart | Entry | Stop or trailing level | Targets | State |
|---|---|---|---|---|
| M30 | 1.41738 | 1.41287 (trailing) | 1.41481, 1.41224, 1.40967 | Targets 1 and 2 reached, stop 45.1 pips in front of entry |
| M15 | 1.41486 | 1.41226 (trailing) | 1.41330, 1.41175, 1.41019 | Targets 1 and 2 reached, stop 26.0 pips in front of entry |
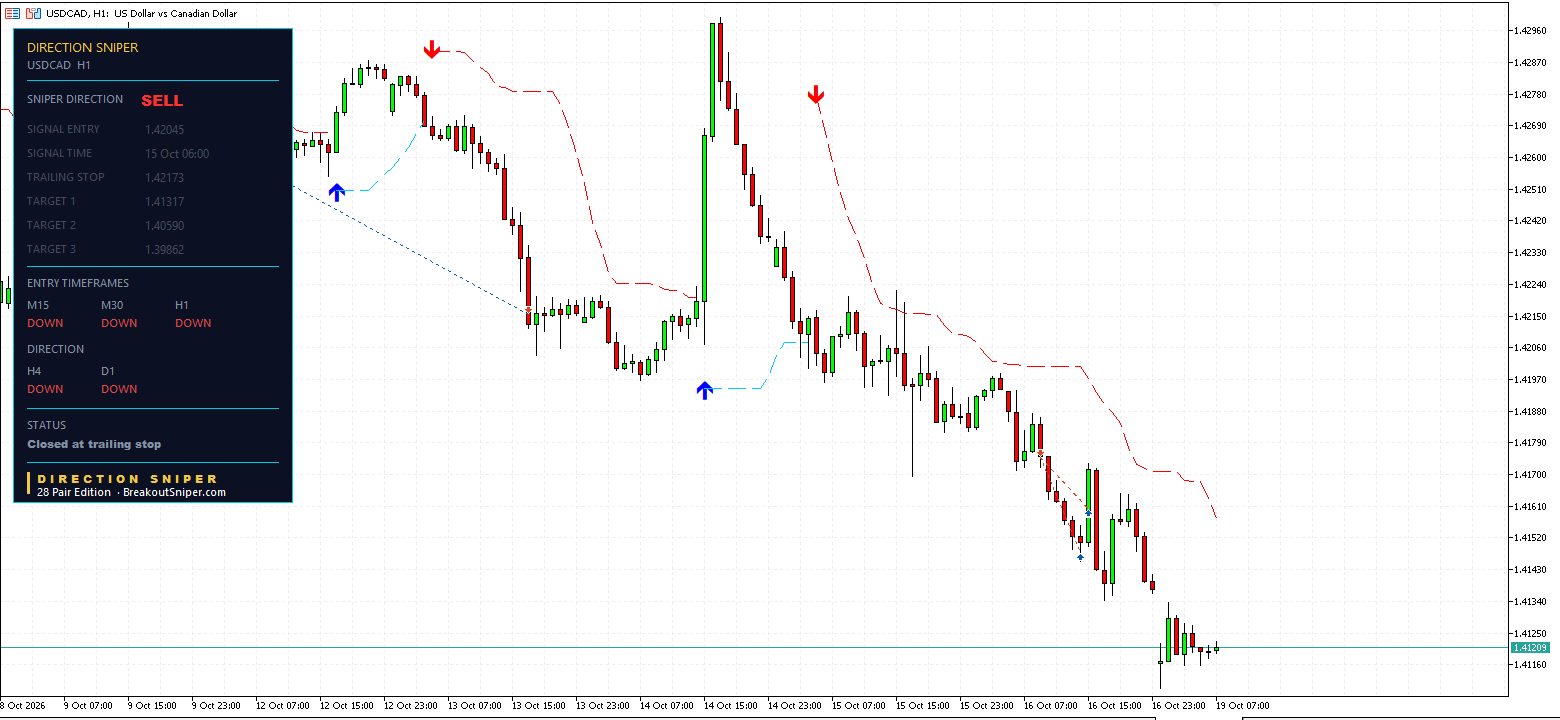
| H1 | 1.42045 | 1.42173 (trailing) | 1.41317, 1.40590, 1.39862 | Closed at trailing stop |
| H4 | 1.42408 | 1.42887 (stop loss) | 1.41929, 1.41450, 1.40971 | Closed at stop loss |
Every timeframe reads DOWN: the 15 minute, the 30 minute, the 1 hour, the 4 hour and the daily. The status reads Sell on M15, M30, H1, H4. Both live tickets have their stops in front of their entries.
1. The Week In Five Moves
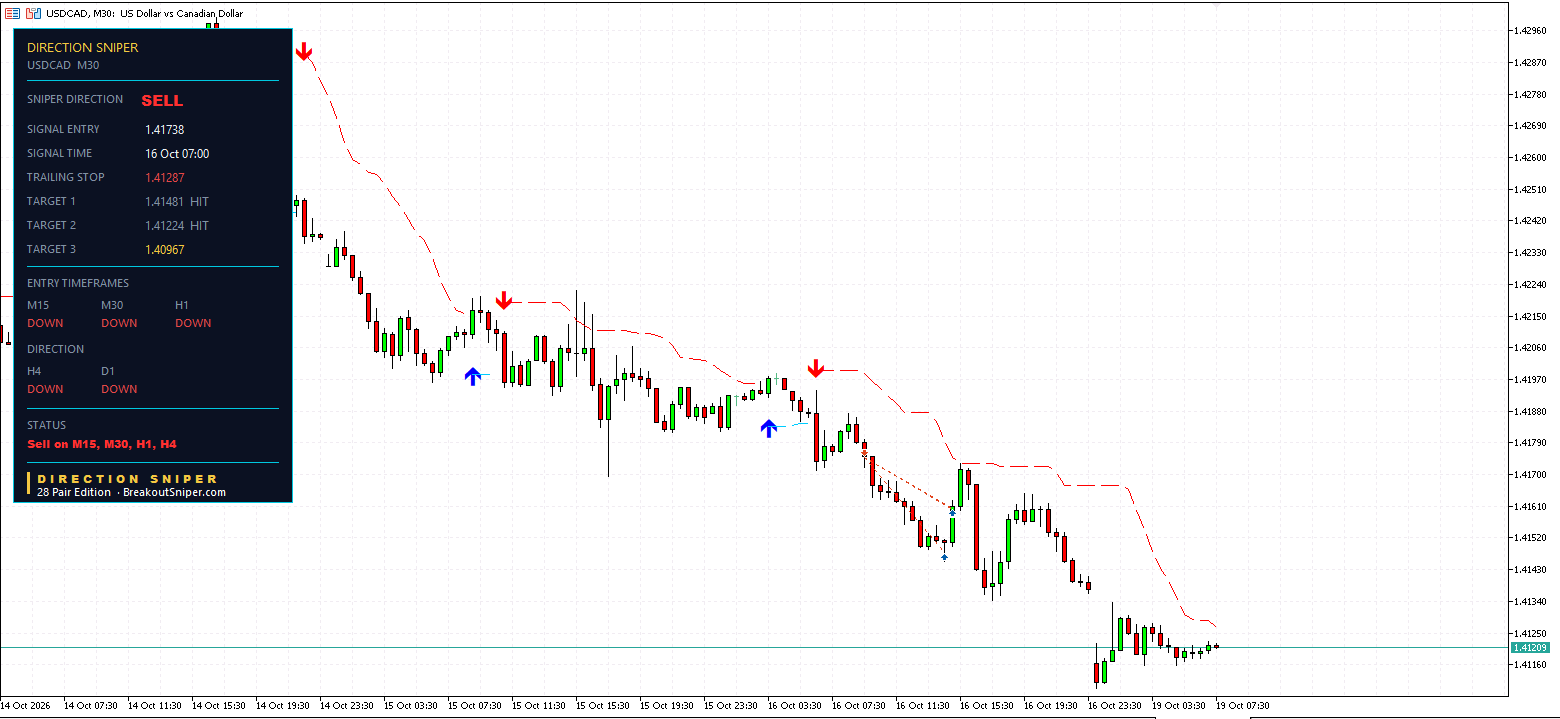
Move one: the 4 hour called it first. On 13 October at 16:00 the 4 hour printed a sell at 1.42408, with a stop at 1.42887. That is 47.9 pips of risk.
Move two: the shakeout. On 14 October USDCAD ran a sharp rally to around 1.4298. It reached the 4 hour stop and the ticket closed. But look at what did not change: the 4 hour and the daily direction both stayed DOWN. The verdict never flipped.
Move three: the 1 hour stepped in, and its trail did its job. On 15 October, after that rally, the 1 hour printed a sell at 1.42045 with a wide 72.8 pip stop. The trailing level tightened all the way to 1.42173 before a smaller rally reached it. The ticket closed 12.8 pips behind its entry, using less than a fifth of its planned risk.
Move four: the move arrived, and the fast charts caught it. On 16 October the shakeouts were over and the faster charts lined up with the verdict:
- The 15 minute at 05:45, entry 1.41899: all three targets reached, at 1.41808, 1.41717 and 1.41626
- The 30 minute at 07:00, entry 1.41738: Target 1 at 1.41481 reached, Target 2 at 1.41224 reached
- The 15 minute again at 22:15, entry 1.41486: Target 1 at 1.41330 reached, Target 2 at 1.41175 reached
Seven targets reached, every one of them after the 4 hour stop out.
Move five: today. Price sits at about 1.41210. Both live tickets have their stops in front of their entries, and every chart still points down.
If you read our USD CAD forecast on 16 October, you saw moves one to three as they happened, and the 30 minute ticket the day it printed. Today is how it ended up.
2. The 30 Minute: Two Targets Reached, Stop Well In Front
The 30 minute ticket from 16 October:
- Entry 1.41738
- Original stop 1.41995, so 25.7 pips of risk
- Target 1 at 1.41481, reached
- Target 2 at 1.41224, reached
- Target 3 at 1.40967, about 24 pips away
- Trailing level now 1.41287, which is 45.1 pips in front of the entry
Price is 52.9 pips below the entry, just over twice the original risk. The stop has crossed break even by a wide margin. If that level is ever reached, the ticket closes well in front of where it started.
Our guide on when to move stop loss to break even walks through exactly how that crossing works, with five real panels.
3. The 15 Minute: Fresh Ticket, Same Result
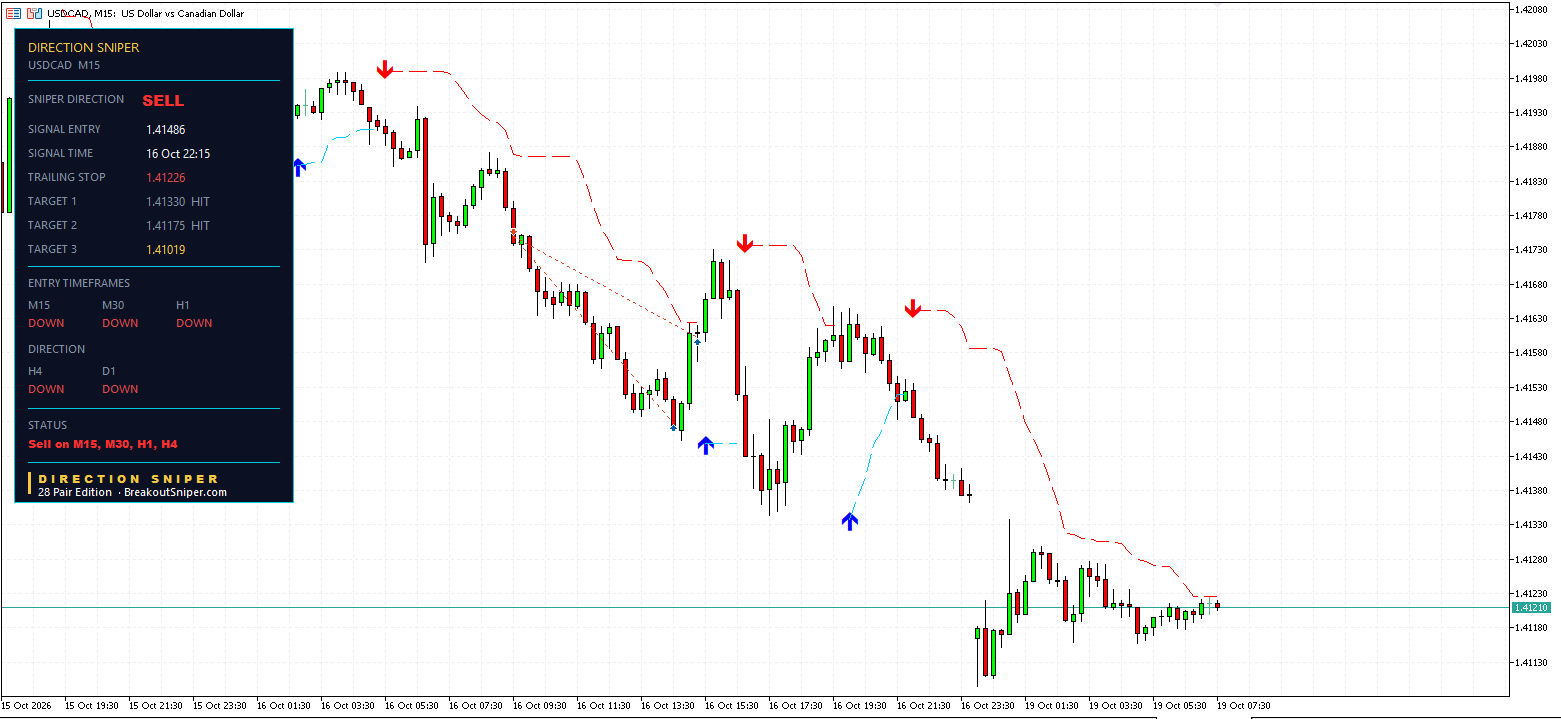
The second 15 minute ticket printed on 16 October at 22:15:
- Entry 1.41486
- Original stop 1.41642, so 15.6 pips of risk
- Target 1 at 1.41330, reached
- Target 2 at 1.41175, reached
- Target 3 at 1.41019
- Trailing level now 1.41226, which is 26.0 pips in front of the entry
One thing to watch today: that trailing level sits only about 1.6 pips above price. If price reaches it, the ticket closes there, 26.0 pips in front of its entry. If price keeps falling instead, Target 3 is about 19 pips away. The panel shows you both levels, so you know exactly where you stand.
4. Why The Big Charts Lost And The Fast Charts Won
This is the part worth understanding, because it happens on every market, every week.
The 4 hour and the 1 hour were not wrong about the direction. They were early. The bigger timeframes see a turn first, so they enter first. That means they sit through every rally on the way down. This week, the rallies reached their stops before the move arrived.
The fast charts were not smarter. They were later. By the time the 15 minute and 30 minute lined up with the verdict, the shakeouts were already on the chart. They entered lower, with the rally highs behind them.
And here is what made the whole week work: the verdict never changed. Because the 4 hour and the daily held DOWN through both rallies, the panel kept looking for the next entry. One stop out did not end anything. It just moved the entry to a better place.
5. The Lesson: The Trade After The Stop Loss
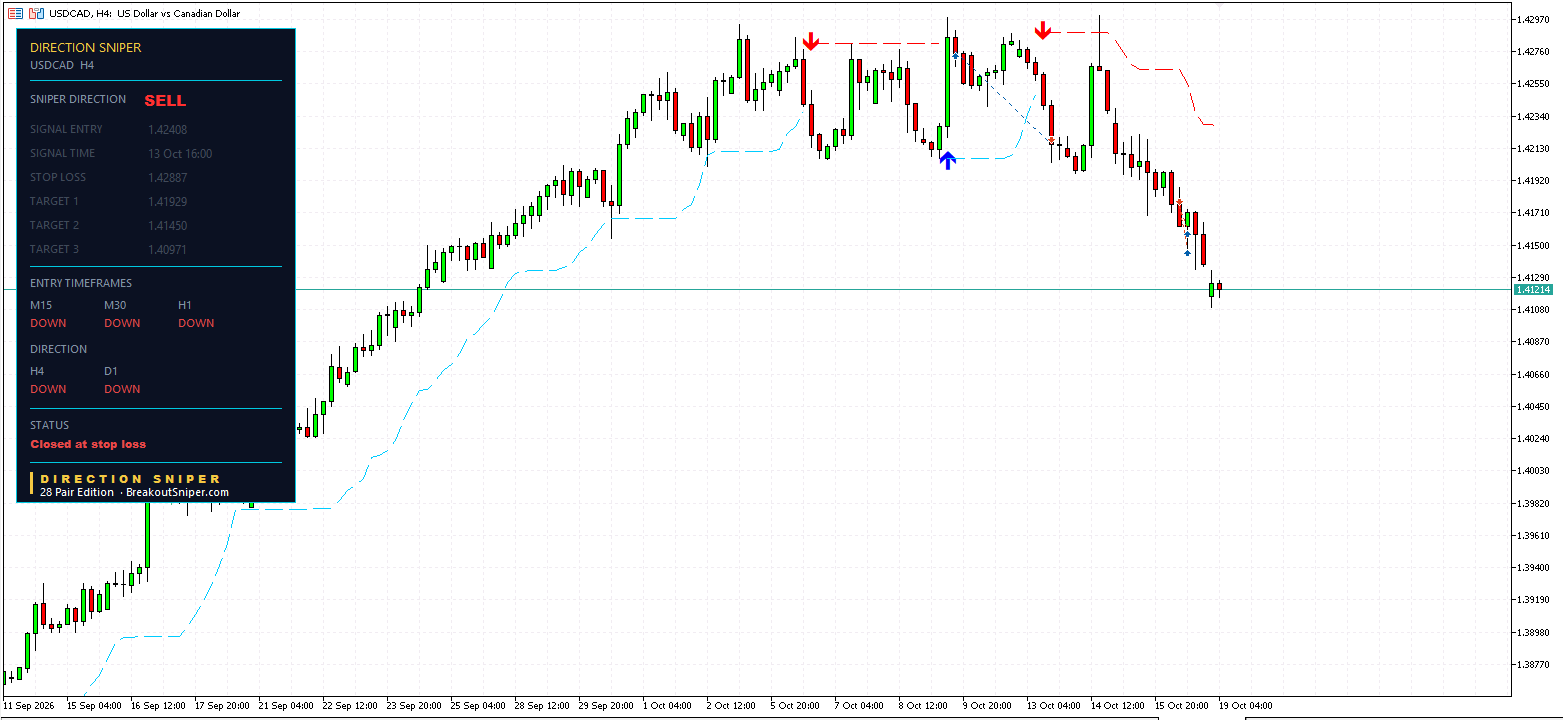
On Friday we wrote that a stop out is not the end of the move. Today is the proof.
The trader who quit after 14 October watched USDCAD fall 119 pips below the first sell, from the sidelines.
The trader who kept reading the panel saw three fresh tickets in the same direction and seven targets reached.
The difference between those two traders was not skill. It was not prediction. It was simply still being there when the next ticket printed. And the only thing that keeps you there after a stop out is how much that stop cost you.
6. Lot Size: Why The Stop Out Did Not Cost The Week
Every one of these tickets came with its stop printed before entry, so every one could be sized to the same dollar risk.
USDCAD is priced in Canadian dollars, so one pip on a standard lot is worth 10 Canadian dollars, about 7.08 US dollars at today’s price. At 50 US dollars of risk per ticket, which is 0.5 percent of a 10,000 dollar account:
- H4, 47.9 pips: about 0.15 lots
- H1, 72.8 pips: about 0.10 lots
- M30, 25.7 pips: about 0.28 lots
- M15 at 22:15, 15.6 pips: about 0.45 lots
- M15 at 05:45, 9.1 pips: about 0.78 lots
Sized like that, the 4 hour stop out cost exactly what was planned, 50 dollars. The 1 hour cost less than a fifth of that, because its trail had tightened. Neither one was big enough to knock a trader out of the market.
That is the real job of position size. Not to make the winners bigger. To make the losers small enough that you are still there for the next ticket.
Contract specifications vary between brokers, so check your own.
7. Why We Risk Just 0.5 Percent Per Trade
This week is the best argument for small risk we could ask for.
We risk at most 2 percent of the account on a single trade, and usually 0.5 percent. The bigger the account, the smaller the percentage. Here is why.
This week’s two stop outs, at 0.5 percent each:
- The 4 hour cost its full planned risk: 0.5 percent of the account
- The 1 hour cost less than a fifth of its planned risk: about 0.09 percent
- Together, about 0.59 percent of the account
Less than two thirds of one percent. That is a bad day you barely feel. And because you barely felt it, you were still there, calm and ready, when the panel printed the three tickets that followed.
Now look at what a losing streak does at different risk levels. Every trader hits a run of losses eventually. Here is what ten losses in a row do to an account:
| Risk per trade | After 10 losses in a row | Gain needed just to get back |
|---|---|---|
| 0.5 percent | down about 4.9 percent | about 5.1 percent |
| 2 percent | down about 18.3 percent | about 22.4 percent |
| 5 percent | down about 40.1 percent | about 67.0 percent |
At 0.5 percent, ten straight losses is an uncomfortable month. At 5 percent, it is an account that needs to grow by two thirds just to get back to where it started. That is the hole most traders never climb out of.
Small risk also does something no indicator can do: it keeps your head clear. When a single loss costs half a percent, you do not panic at the first rally, you do not move your stop, and you do not quit after a stop out. If you are worrying about every trade, your lot size is still too big.
What If Your Account Is Too Small For 0.5 Percent?
This is the question we get most from traders starting out, so here is the honest answer.
On a 100 dollar account, 0.5 percent is just 50 cents. To risk 50 cents on this week’s 4 hour ticket, with its 47.9 pip stop, you would need about 0.0015 lots. Most brokers will not let you trade smaller than 0.01 lots.
So what happens? You take 0.01 lots because it is the smallest size allowed, and that 0.01 lot risks about 3.39 dollars. That is 3.4 percent of the account on one trade, nearly seven times what you planned, without changing anything except the minimum lot size.
That is how small accounts get blown. Not by bad trades. By a minimum lot size that is too big for the account.
The fix is a cent account. On a cent account your balance is shown in cents, so 100 dollars becomes 10,000 cents, and lot sizes work in hundredths of a standard lot. The 0.0015 standard lots you need becomes 0.15 cent lots, comfortably above the minimum. The trade is identical. Only now your account can hold the right size.
If your account is too small to trade 0.5 percent properly, we highly recommend a cent account before anything else:
Get the size right first. Everything else comes after.
We may earn a commission if you open an account through our links. It does not change the price you pay or the advice above.
Technical analysis is a game of probability. There is no holy grail, and every system has losing trades. Small, consistent risk is what lets you stay in the game long enough for the probabilities to play out.
8. Where The Levels Sit Now
USDCAD (price about 1.41210)
- M30: Target 3 at 1.40967, trailing level 1.41287
- M15: Target 3 at 1.41019, trailing level 1.41226
- H1 and H4: closed, waiting for the next ticket
- Every timeframe DOWN. Verdict SELL. Status: Sell on M15, M30, H1, H4
Why We Publish This
Every read on this site comes straight from the Direction Sniper panel. We publish the tickets that close at their stops alongside the ones that reach their targets, and we come back to show how the story ended. You can check every number against the chart yourself.
Stay In The Game Long Enough To Catch The Move
USDCAD is in both the Direction Sniper Forex Majors Edition and the 28 Pair Edition.
- Direction. The 4 hour and daily held DOWN through two rallies. The panel never flipped, and price ended up 119 pips below the first sell.
- Rallies that do not change the bigger picture. Both rallies reached stops. Neither changed the verdict, and the panel kept offering fresh entries lower down.
- The stop loss. Every ticket prints its stop before you enter, so every loss is sized before it happens. And both live tickets now have their stops in front of their entries.
The 28 Pair Edition covers USDCAD and 27 other pairs in one file, so when one chart shakes you out, the panel is already lining up the next entry, on this pair or another.
See the Forex Majors and 28 Pair Editions
Want a read like this in your inbox? Join The Daily Sniper Read, free, every trading day.
Frequently Asked Questions
What is the USD CAD forecast today, 19 October 2026?
Every timeframe on the Direction Sniper panel reads DOWN on USDCAD, so the verdict is SELL.
The 30 minute ticket from 1.41738 and the 15 minute ticket from 1.41486 have each reached two targets, and both have their trailing stops in front of their entries.
Price sits at about 1.41210, which is 119 pips below where the 4 hour first called the sell on 13 October.
What should I do after a stop loss is hit?
First check whether the bigger picture has actually changed.
On USDCAD the 4 hour stop was reached on 14 October, but the 4 hour and daily direction stayed DOWN, so the Direction Sniper verdict stayed SELL.
The panel then lined up three fresh entries on the faster charts, and seven targets were reached after that stop out.
A stop out that is sized small is one trade, not the end of the move.
Why did the 4 hour and 1 hour tickets close while the faster tickets reached their targets?
The bigger timeframes saw the turn first, so they entered first and sat through the rallies of 14 and 15 October, which reached their stops.
The 15 minute and 30 minute lined up with the verdict later, after those rallies were already on the chart, so they entered lower with the rally highs behind them.
The direction was the same on every chart. The difference was timing and room.
How much should I risk per trade?
We risk at most 2 percent of the account on a single trade, and usually 0.5 percent, and the bigger the account, the smaller the percentage.
At 0.5 percent, ten losses in a row leaves an account down about 4.9 percent, against about 40.1 percent at 5 percent per trade.
If you are worrying about every trade, your lot size is still too big.
What if my account is too small to risk 0.5 percent per trade?
On a 100 dollar account, 0.5 percent is 50 cents, and this week’s 4 hour USDCAD ticket would need about 0.0015 lots, below the usual 0.01 minimum.
Taking 0.01 lots instead would risk about 3.39 dollars, which is 3.4 percent of the account.
A cent account solves it, because lot sizes work in hundredths of a standard lot, so 0.0015 standard lots becomes 0.15 cent lots.
We recommend a RoboForex Cent account or an XM Micro account for small balances.
How much is one pip worth on USDCAD?
USDCAD is priced in Canadian dollars, so one pip on a standard lot is worth 10 Canadian dollars.
At a price of about 1.4121 that is roughly 7.08 US dollars a pip, not 10 US dollars.
Does a reached target mean a trader made money?
No. Price reaching a published target level is not the same as a realised result.
Fills, spreads, lot size and when each trader closed the position all change the outcome.
These posts report what the Direction Sniper panel showed, for education, and they are not a trade signal service.
Disclaimer: This post reports what the Direction Sniper panel showed on 19 October 2026. It is educational analysis, not financial advice and not a trade signal service. The 30 minute and 15 minute tickets were still open at the time of writing. Price reaching a published target level, or passing a level where a closed ticket’s target sat, is not the same as a realised result. Lot sizes are arithmetic for illustration and are not a recommendation about how much anyone should trade. Trading carries risk, and you should only trade money you can afford to lose.

