EUR USD Forecast Today, 6 October 2026: Does a Tight Stop Mean You Can Trade Bigger?
Executive Summary
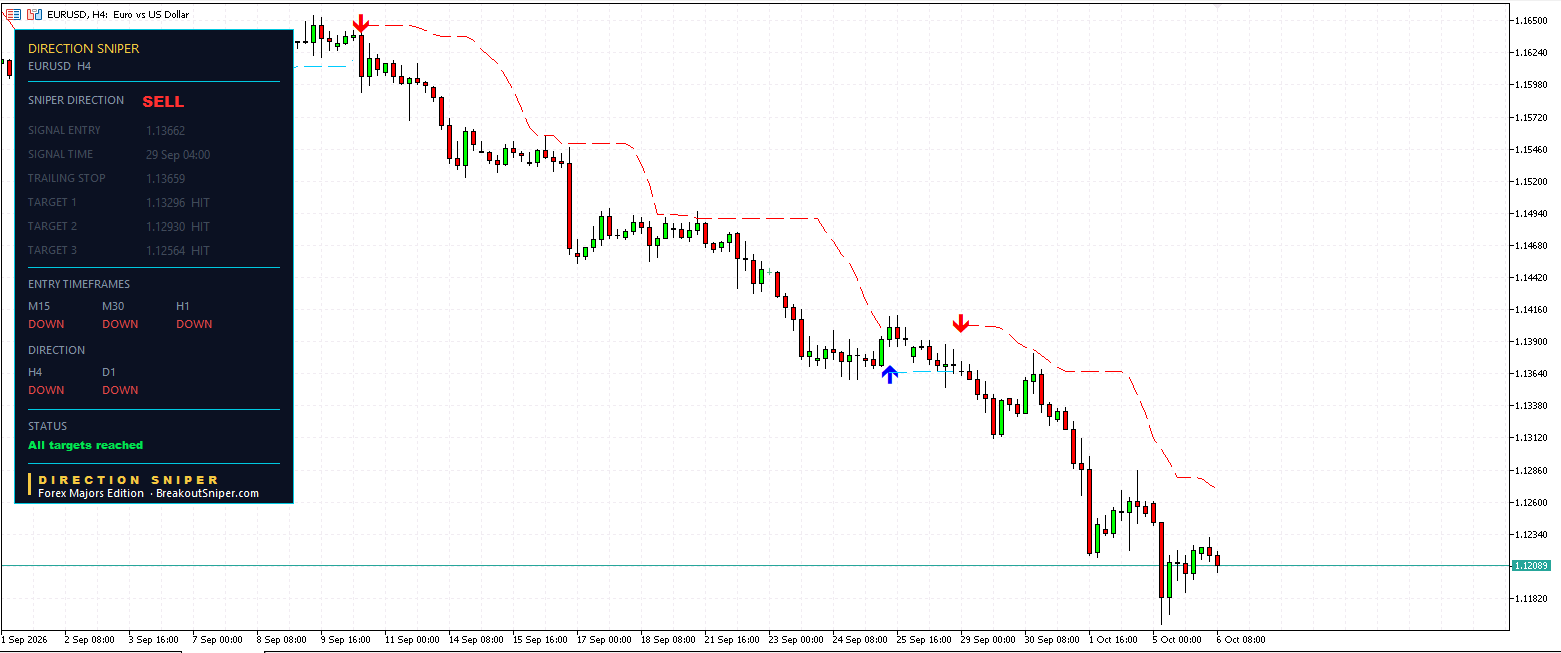
EUR USD is in SELL mode and every chart agrees. Daily down, four hour down, fifteen minute, thirty minute and one hour all down. No disagreement anywhere.
Four sell tickets. The four hour has already finished. The other three opened this morning within four pips of each other.
The euro is at 1.12100.
| Chart | Entry | Risk | Status |
|---|---|---|---|
| H4 | 1.13662 | 36.6 pips | All three targets reached |
| H1 | 1.12104 | 14.0 pips | 0.7 pips behind |
| M30 | 1.12143 | 12.8 pips | 3.6 pips ahead |
| M15 | 1.12144 | 15.1 pips | 4.8 pips ahead |
Look at the risk column on those three new tickets. Twelve to fifteen pips.
Yesterday the gold four hour ticket wanted 80.79 points and the GBP USD four hour wanted 111.7 pips. This morning the euro is asking for twelve.
That difference is worth more than it looks, and it is the whole of this post.
1. One Direction, No Argument
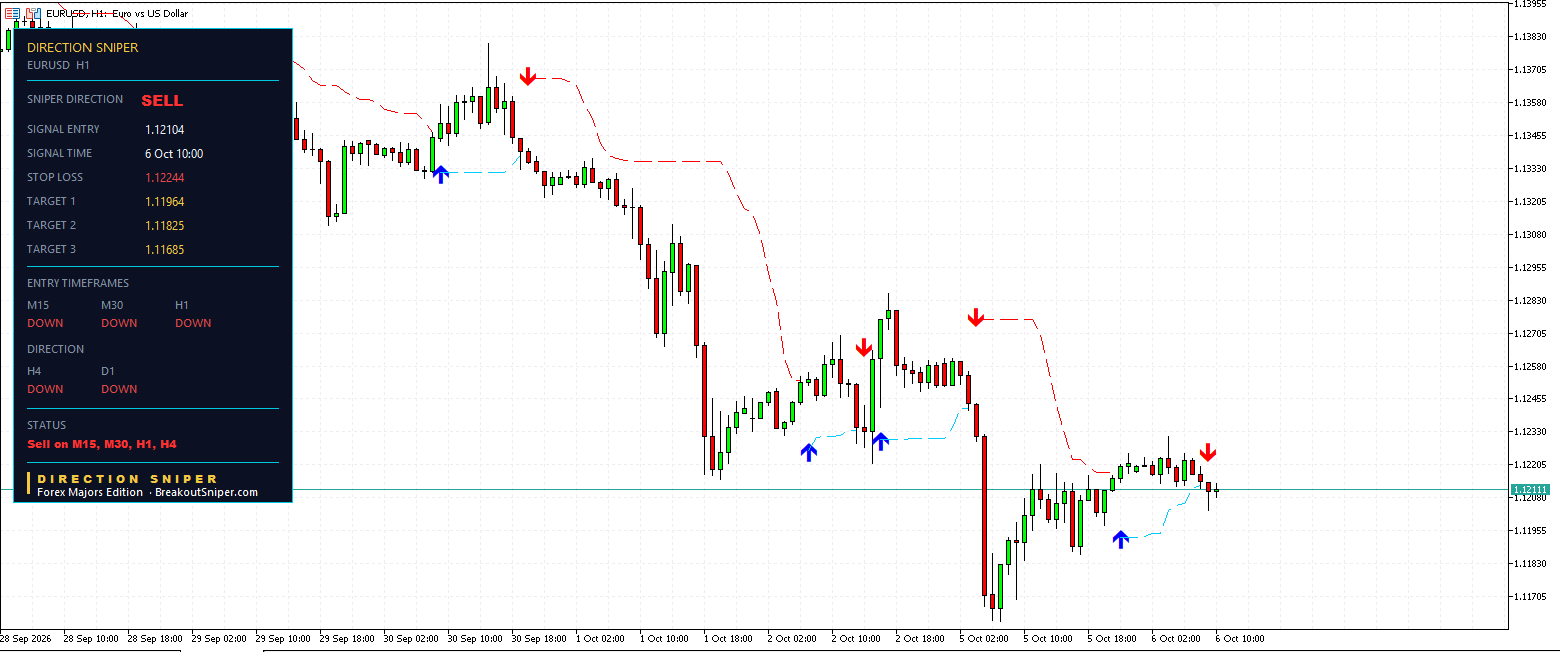
The daily and the four hour both read DOWN, which sets the verdict for the pair, and all three entry charts read DOWN as well. The status line on every panel says the same thing: Sell on M15, M30, H1, H4.
There is nothing to interpret this morning. No chart disagreeing, no bounce to argue about, no decision to make about which timeframe to believe.
What the tool does for you here: on a day when every chart agrees, the value is not finding the trade. It is that you were not tempted into the opposite one at any point during five quiet hours, because the verdict never wavered while price went nowhere.
2. Three Entries, Five Hours, Four Pips
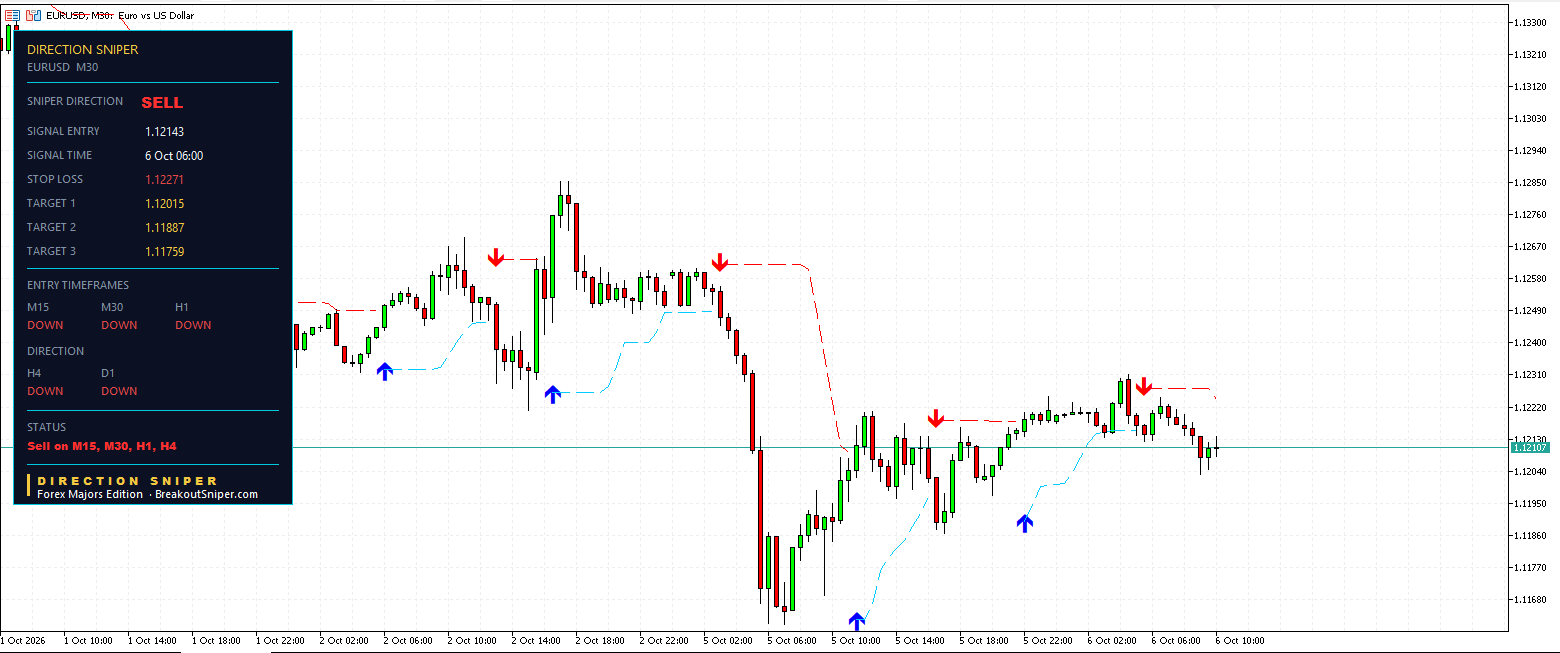
Now look at when each of those three tickets opened, and at what price.
M15 at 05:15, entry 1.12144
M30 at 06:00, entry 1.12143
H1 at 10:00, entry 1.12104
Three different charts, firing nearly five hours apart, entering within four pips of each other.
Price has effectively gone nowhere since before six this morning. That is a compressed market, and most traders read compression as a reason to go and look somewhere else.
It is also why the stops are so tight. A stop sits beyond the structure the chart is measuring, and when the structure is twelve pips wide, the stop is twelve pips away.
What the tool does for you here: it prices the stop off the actual structure on each chart rather than off a fixed number of pips. On a wide day you get a wide stop and on a compressed day you get a tight one, without you deciding anything. That is what makes the next section possible.
3. What a Twelve Pip Stop Is Actually Worth
Here is the part nobody talks about.
Your position size comes from your stop. Risk divided by stop distance, times the pip value. We covered that on the GBP USD post yesterday.
So a tighter stop does not mean a smaller trade. It means a bigger one for the same money at risk.
On a ten thousand dollar account risking half a percent, which is fifty dollars, with EUR USD at roughly ten dollars per pip per standard lot:
| Ticket | Stop | Lot size for $50 risk |
|---|---|---|
| Gold H4, yesterday | 80.79 points | 0.01 lots |
| GBP USD H4, yesterday | 111.7 pips | 0.04 lots |
| EUR USD M15, today | 15.1 pips | 0.33 lots |
| EUR USD H1, today | 14.0 pips | 0.36 lots |
| EUR USD M30, today | 12.8 pips | 0.39 lots |
Same fifty dollars. Ten times the position.
That is the thing a quiet market is actually offering you. Not a smaller opportunity. A cheaper one. Every pip the market eventually moves is worth ten times more to you today than it was on yesterday’s gold ticket, because your fifty dollars bought ten times the size.
The trader who skipped this morning because the chart looked boring skipped the cheapest entry of the week.
What the tool does for you here: none of that arithmetic exists without a precise stop. If you place stops by eye, or use a fixed thirty pips on everything, you are carrying the same position size whether the market is compressed or wild, which means you are taking far too much risk on the wide days and far too little size on the tight ones. The panel gives you the exact number, and the number is what the position is built from.
4. But It Is Not Free, And Here Is The Catch
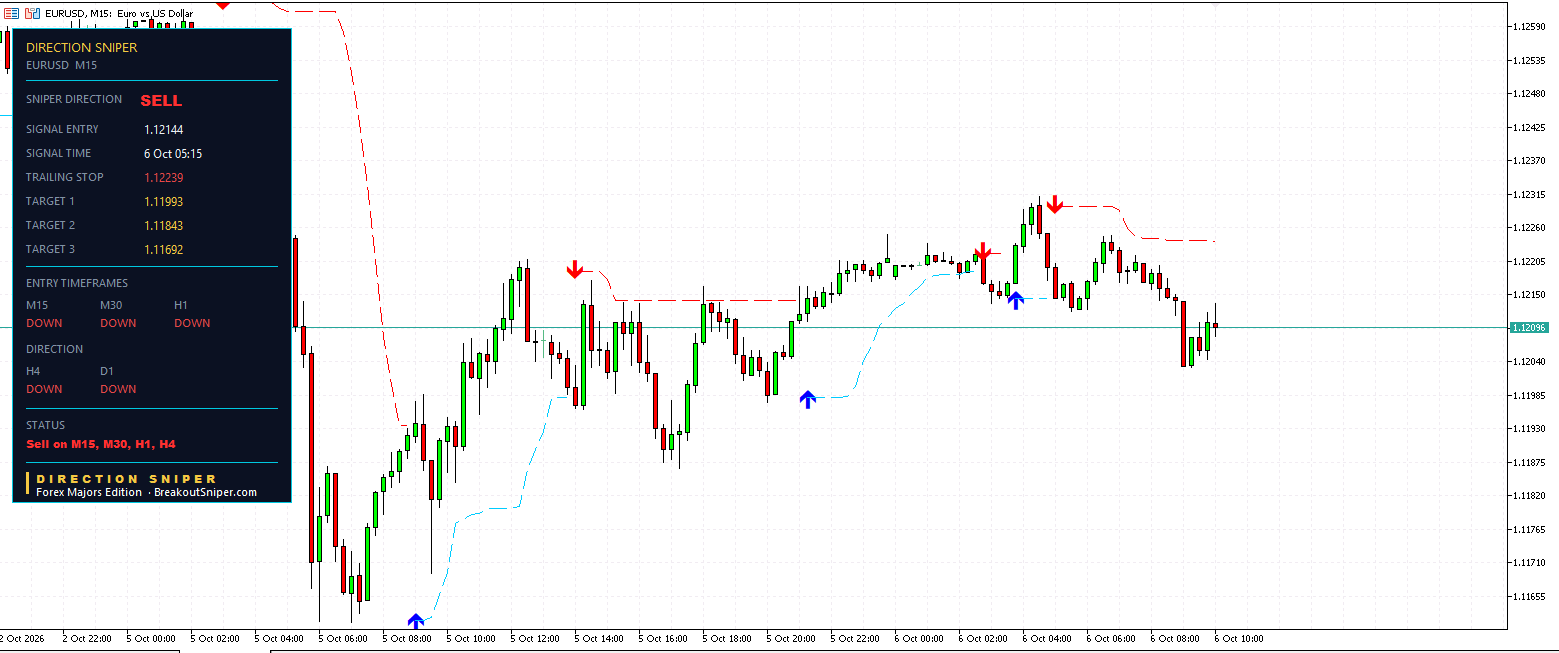
The same compression that gives you a twelve pip stop makes that stop much easier to hit.
A range can run through twelve pips in a few minutes without anything changing about the daily or the four hour. On a wide stop day you have eighty points of room and the market has to genuinely go against you to take it. On a day like this, noise alone can do it.
So this is not a bigger position for free. It is a different trade off:
More size per dollar. Higher chance of being stopped on nothing.
Both of today’s live tickets are sitting within five pips of their entry, and the H1 is actually behind. That is what twelve pip stops look like in practice. They resolve quickly, in both directions.
What you are buying with a tight stop is not a better chance of being right. It is more exposure to the move if it comes, and a faster, cheaper answer if it does not.
What the tool does for you here: the M15 stop has already started trailing, from 1.12295 down to 1.12239. On a day of tiny stops that matters more than usual, because there is so little room to begin with. Worth remembering that the panel calculates that level and shows it to you. You still move the order on your platform yourself.
5. And The Four Hour, For Context
The H4 ticket is greyed out because it finished. It entered at 1.13662 on 29 September, risked 36.6 pips, and reached all three targets at 1.13296, 1.12930 and 1.12564.
Price is now 1.12089, another 47 pips below the final target.
That is the slow version of the same idea, running for a week while this morning’s three tickets opened and closed inside a few hours. Same direction, same pair, four completely different speeds.
Where Things Go From Here
The M30 and the M15 resolve first. The M30 has 9 pips to its first target at 1.12015 and 16 to its stop at 1.12271. The M15 has 10 pips to its first target at 1.11993 and 14 to its trailing stop at 1.12239. Both are close enough to either side that today settles them.
The H1 needs price below 1.12104 to start working. It is 0.7 pips above that, so it is effectively at the line.
The level that governs everything is the cluster of stops between 1.12239 and 1.12271. Above that, all three of this morning’s tickets are finished.
Those are the levels on the chart and how far price sits from each. None of it is a forecast.
What You Are Actually Buying
Direction, settled once. The daily and the four hour decide it, no shorter chart overrules them, and it held steady through five hours of a market doing nothing.
A stop measured off the structure, not off a habit. That is what made today’s stops twelve pips and yesterday’s gold stop eighty points. It is also the only reason you can size a position properly on either day.
A trailing stop level recalculated as price moves, with the label changing from STOP LOSS to TRAILING STOP so you can see it has begun. You move the order yourself. The arithmetic is done for you, the click is yours.
Direction Sniper puts the panel on your charts in MetaTrader and keeps it live.
🔸 EURUSD Edition, $7 is the pair in this post, and the cheapest way to put the panel on a chart and decide for yourself.
🔹 Forex Majors Edition, $47, the seven majors, and the edition these four panels came from
🔹 28 Pair Edition, $77, every major, minor and cross, under three dollars a pair
🥇 Gold and Silver Edition, the original and still the one most of our traders run
Worth reading alongside this: the GBP USD post on sizing from the stop, the gold post on reading a live trade against its own stop, and the USD JPY post on spotting when several trades are secretly one trade.
One question. Do you change your lot size when the stop gets tighter, or do you trade the same size every time? Tell me on the reviews and feedback page.
Trading foreign exchange and other leveraged products carries a high level of risk and is not suitable for everyone. The levels above describe where the indicator placed entries, stops and targets at the time the charts were read, and the positions described were still open. A stop is a level rather than a guarantee, and gaps or fast markets can fill you past it. Lot sizing figures are arithmetic for illustration and are not a recommendation about how much anyone should trade. Check your own broker’s contract specifications. Nothing here is financial advice. Past performance does not guarantee future results.

