AUD USD Forecast Today, 5 October 2026: Why Is My 15 Minute Chart Bullish When Everything Else Says Sell?
Executive Summary
AUD USD is in SELL mode. The daily and the four hour both point down, which sets the verdict for the pair.
But the fifteen minute chart is pointing up.
That is the whole story this morning, and it is the position most short term traders find themselves in without realizing it. They are looking at a rising fifteen minute chart in a market where everything above it is falling.
The Aussie is at 0.69434.
| Chart | Direction | Ticket | Status |
|---|---|---|---|
| D1 | DOWN | Gatekeeper | Permission to sell |
| H4 | DOWN | Entry 0.71111 | All three targets reached |
| H1 | DOWN | Entry 0.69338 | Running, 10.3 pips behind |
| M30 | DOWN | Entry 0.69440 | Running, 1.5 pips ahead |
| M15 | UP | No ticket | Waiting for alignment |
Three charts carrying sell tickets. One chart pointing the other way and producing nothing.
And the four hour trade on that list is the most useful thing on the page, because it already answers the question the fifteen minute is asking.
The Verdict Comes From Above
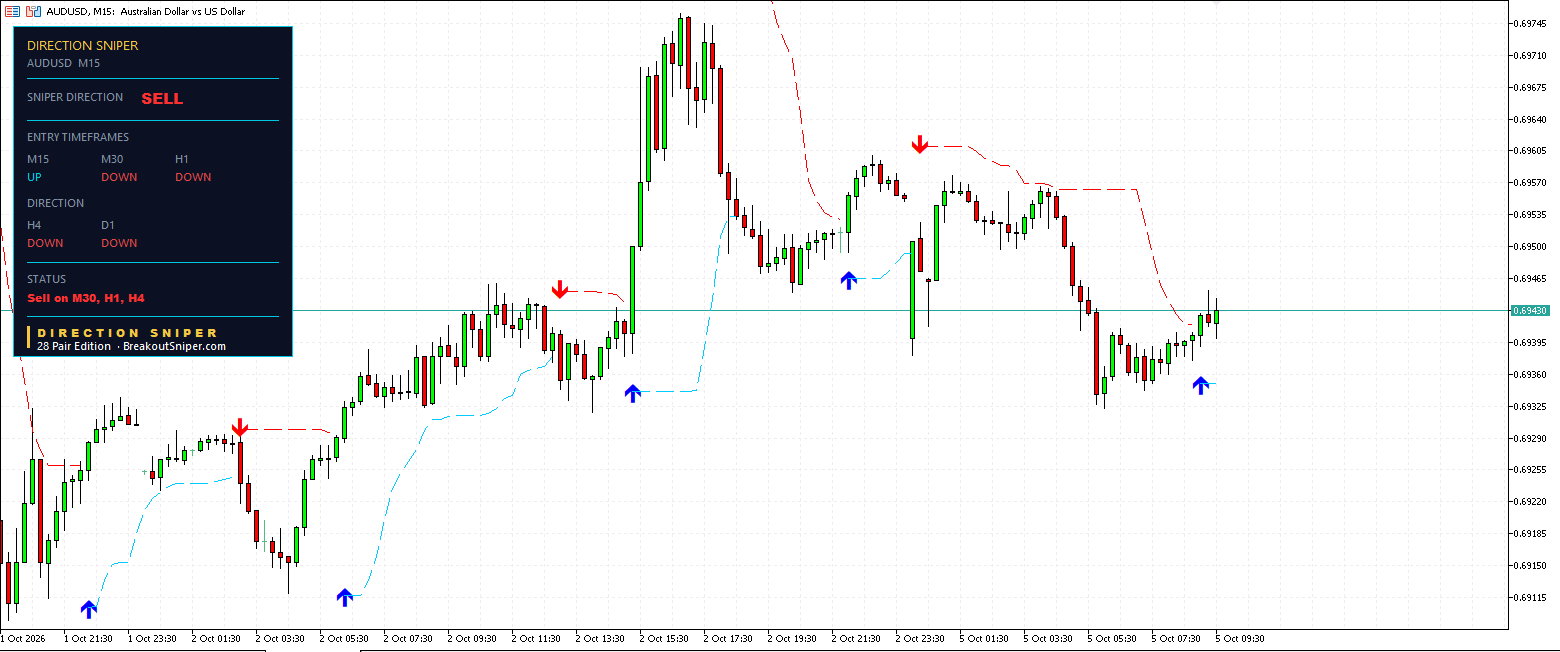
The daily and the four hour are the gatekeepers. They do not find entries. They decide which direction is allowed, and today both read DOWN. That makes the verdict SELL for the whole pair.
The status line says Sell on M30, H1, H4. Three charts, three sell tickets.
The fifteen minute is missing from that list, and the panel has no entry, no stop and no targets on it at all. Not a weaker signal. Nothing.
That is because the M15 row reads UP. The chart is rising, the verdict is to sell, and the tool will not build a sell ticket on a chart currently pointing the other way. So it stands aside and waits.
Here is what that looks like to a trader who only watches the fifteen minute. Price is lifting. Candles are green. The last two hours look like a floor forming. If that is your only chart, you have a clean, well formed reason to buy.
You would be buying into a market where the daily, the four hour, the one hour and the thirty minute are all falling.
The Two Live Tickets
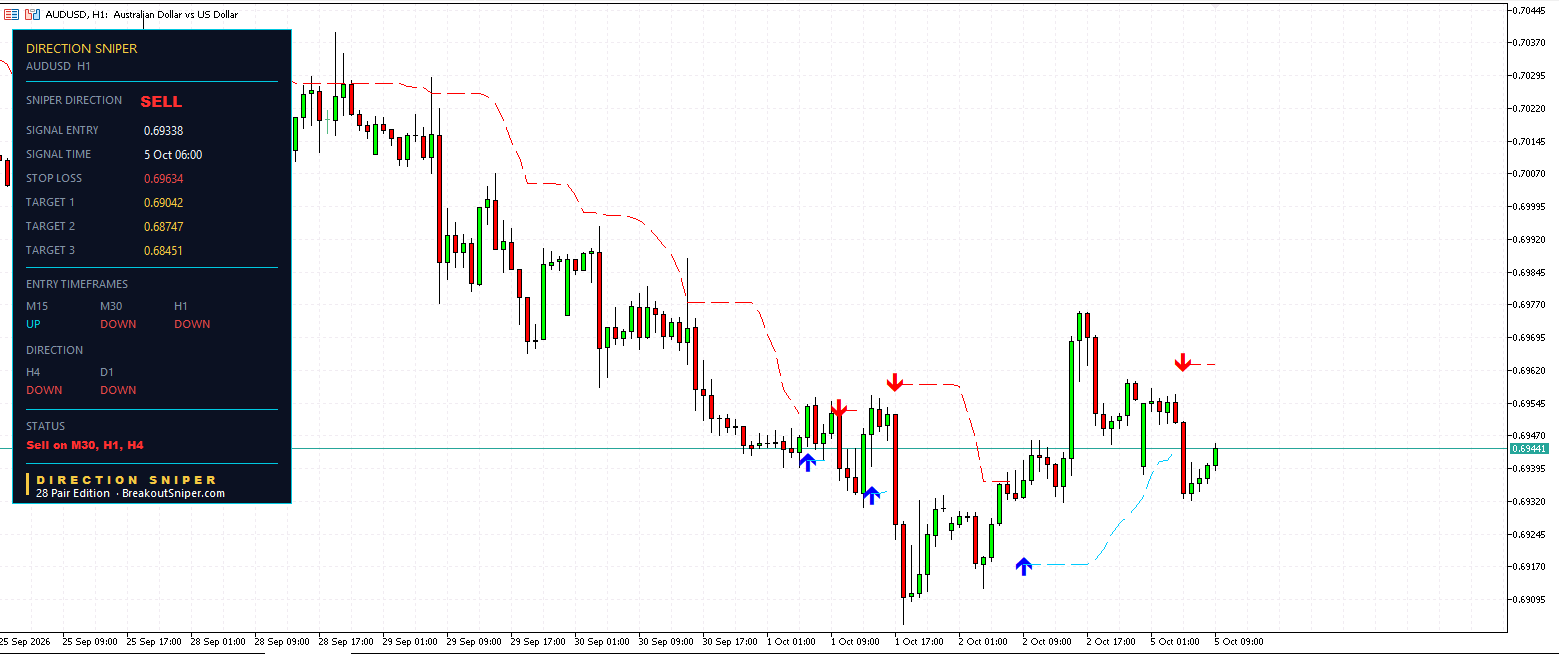
H1
Entry at 0.69338, taken at 06:00 this morning. Stop loss at 0.69634, so 29.6 pips of risk. Targets at 0.69042, 0.68747 and 0.68451, each at one, two and three times the risk.
Price at 0.69441 is above the entry, which on a sell means this one is behind, by 10.3 pips. The level still reads STOP LOSS rather than TRAILING STOP, so the trade has not yet moved far enough for the tool to pull it down.
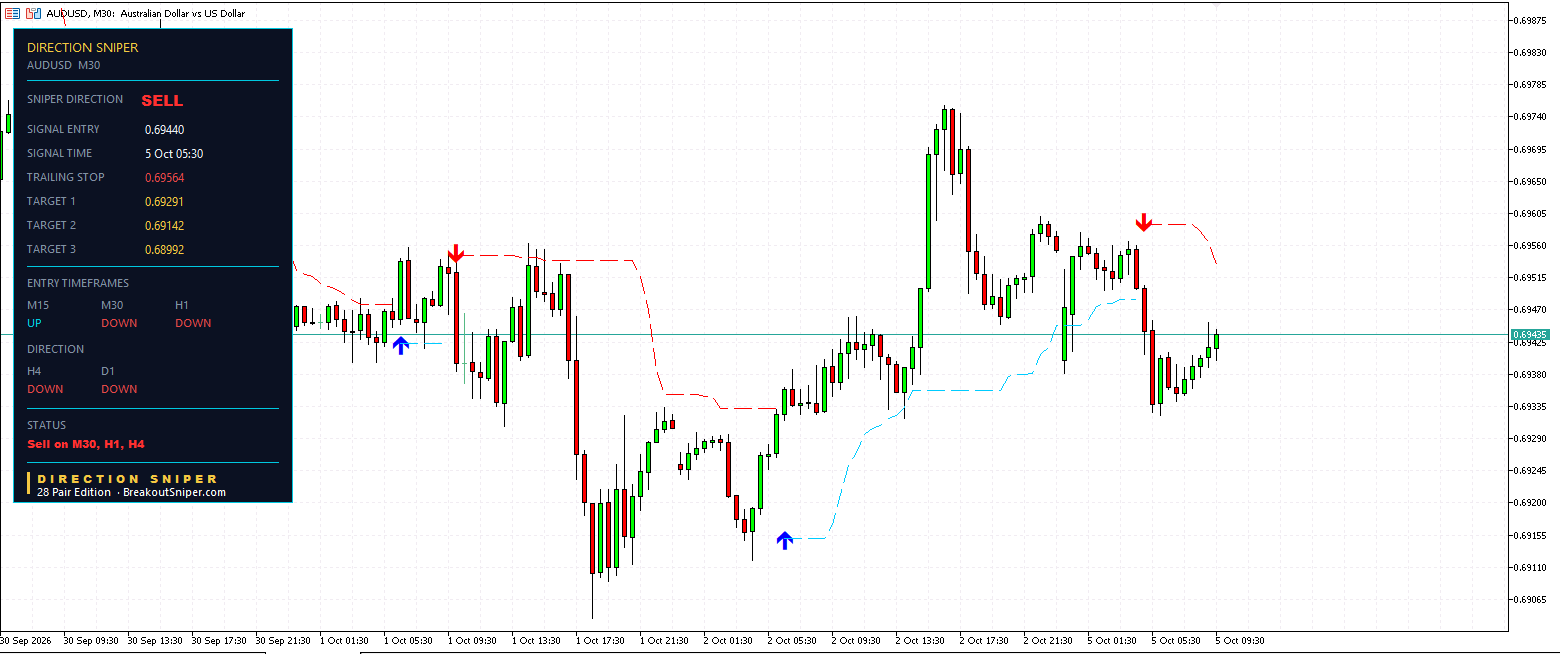
M30
Entry at 0.69440 at 05:30. Original stop at 0.69589, so 14.9 pips of risk. Targets at 0.69291, 0.69142 and 0.68992.
The level now reads as a trailing stop at 0.69564, so it has already come down a little from where it started. Price at 0.69425 is 1.5 pips below entry, which is effectively flat.
Both of these are small, recent, and currently unremarkable. The interesting one is the chart above them.
What Happened Last Time This Chart Looked Bullish
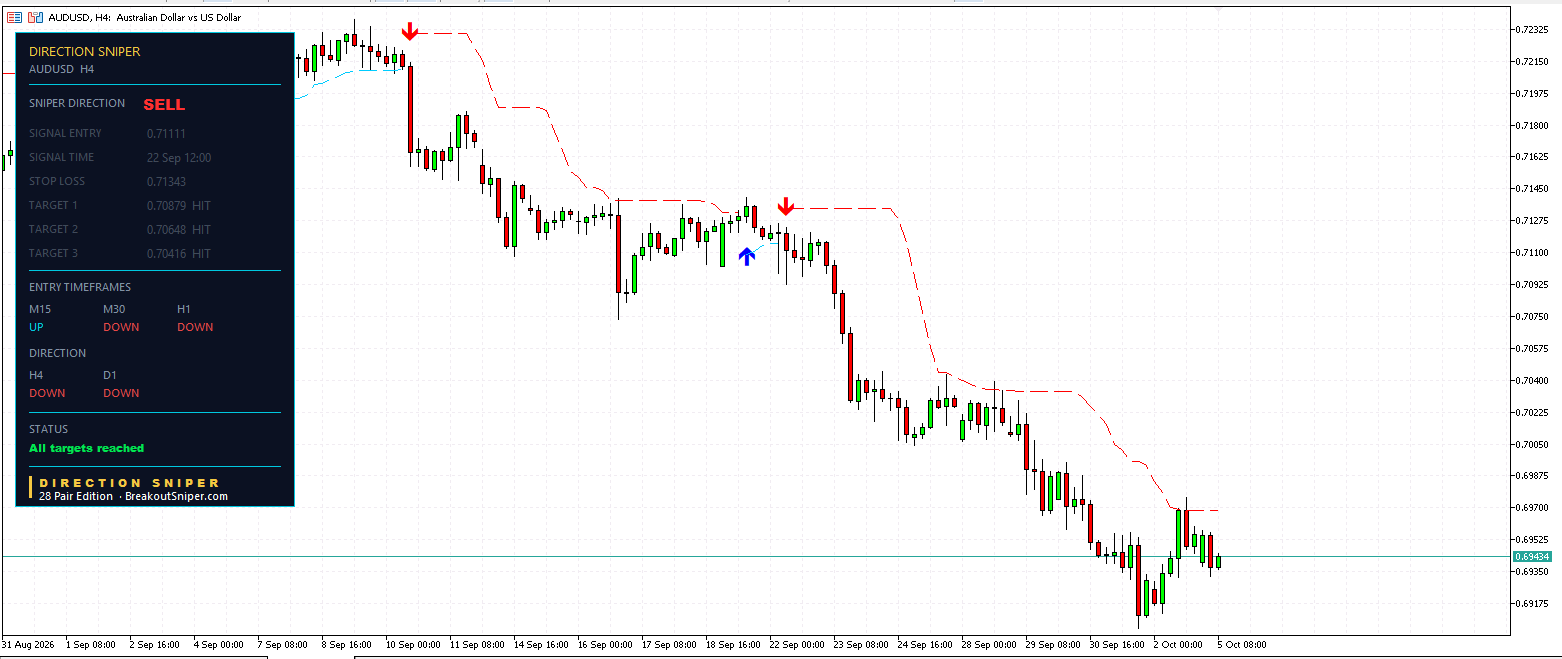
This is the four hour ticket, and every field on it is greyed out because the trade is finished.
Entry at 0.71111, taken on 22 September at 12:00. Stop at 0.71343, so 23.2 pips of risk. Targets at 0.70879, 0.70648 and 0.70416.
Status: All targets reached.
Now look at where price is today. 0.69434.
That is 98 pips below the final target and 167 pips below the entry, thirteen days later.
Target three sat 69.5 pips from the entry. Price has travelled roughly two and a half times that distance.
And here is why that matters for the fifteen minute chart in front of you right now. Over those thirteen days there were plenty of bounces. Every one of them looked, on a fifteen minute chart, exactly like this morning looks. Green candles, a floor forming, a reason to buy. None of them changed what the daily and the four hour were doing.
The structure above never broke. So every one of those bounces was a place to sell into rather than a reason to turn around.
So When Do You Sell Into Strength?
This is the useful question, and it has an answer with conditions rather than a yes or a no.
First, the direction has to already be decided above you. The daily and the four hour must agree, and they must agree before the bounce starts, not because of it. Today they do. If they disagreed, there would be no verdict and the correct number of trades would be zero.
Second, the strength must not have broken structure. A rally inside a downtrend is one that has not produced a higher high on the bigger chart. The moment it does, it is no longer strength to sell into. It is a change, and your stop is where you find out.
Third, you sell on the chart that has already turned back down, not the one still rising. That is the part most people get wrong. They see the bigger trend is down, they see the small chart rising, and they sell immediately into the rise. That is how you get stopped out by a bounce that had another thirty pips left in it.
Which is exactly what the panel is doing this morning. The M30 and the H1 have turned back down, so they have tickets. The M15 is still rising, so it has none. The tool is not refusing to trade. It is refusing to trade on the one chart that has not finished going up yet.
Fourth, and this is the part nobody writes down. Sometimes the small chart turning up is the start of the reversal, and the bigger charts simply have not caught up. That is a real outcome and it happens. It is the entire reason the stop loss exists and the entire reason the position gets sized from that stop.
One finished trade on one pair is an example, not a system. The four hour trade above worked. The next one may not. What makes it repeatable is not the outcome, it is having the conditions written down before the bounce appears, so that the decision is already made while everyone else is deciding in the moment.
Where The Next Trades Come From
The M15 is the one to watch. The verdict is already SELL, so the permission is in place. The only thing missing is for that chart to turn back down. When it does, a fourth ticket opens with the tightest risk on the board, and nothing has to change on the daily or the four hour for it to happen.
The H1 needs price below 0.69338 before it starts working, which is 10.3 pips from here. Its first target is at 0.69042.
The M30 is almost exactly at its entry, with its trailing stop at 0.69564 above and its first target at 0.69291 below. It will resolve one way or the other quickly.
The level that matters above everything: 0.69564, the M30 trailing stop. Below, the first shelf is the M30 Target 1 at 0.69291, then the H1 Target 1 at 0.69042.
None of that is a forecast. It is where the levels sit and how far price is from each one.
What You Are Actually Buying
Everything above came off four panels. The verdict, the entry, the stop, the exact risk in pips, three targets, and on one chart the honest absence of a ticket because that chart had not finished rising.
That last part is the one nobody sells you. Any tool will give you a signal. The ones worth owning tell you when they have nothing, and tell you why.
Direction Sniper puts that panel on your charts in MetaTrader and keeps it live.
AUD USD sits in one edition:
🔹 28 Pair Edition, $77 covers every major, minor and cross including AUD USD, at under three dollars a pair, and it is the edition these screenshots came from
🔹 Forex Majors Edition, $47 covers the seven majors
🥇 Metals trader? The Gold and Silver Edition is the original and still the one most of our traders run.
🔸 Want to see the panel before anything else? The EURUSD Edition is $7.
If you want the deeper AUD USD breakdown, the AUD USD technical analysis page is the permanent version of this. And yesterday’s GBP USD post covers how to size a position once you have a stop distance, which is the next thing you need after deciding what to trade.
One question I would like answered. When your small chart disagrees with your big chart, do you wait, or do you take the small chart anyway? Tell me on the reviews and feedback page.
AUD USD Today: Common Questions
Is AUD USD a buy or a sell today?
On 5 October 2026 the Direction Sniper panel reads SELL on AUD USD. The daily and the four hour both point down, which sets the verdict for the pair, and the thirty minute and one hour point down as well. The fifteen minute is the only chart pointing up. This describes what the indicator displays and is not a recommendation to trade.
Why is there no signal on the AUD USD 15 minute chart today?
Because that chart is still rising while the verdict is to sell. The panel will not build a sell ticket on a timeframe currently pointing the other way, so it issues no entry, no stop and no targets and waits for alignment. It is not a weaker signal or a warning. It is the absence of one.
What are the AUD USD key levels today?
With price at 0.69434, the M30 trailing stop at 0.69564 is the level above. Below it, the M30 target one sits at 0.69291 and the H1 target one at 0.69042. The H1 entry at 0.69338 is the line price needs to cross before that ticket starts working. Further out, the H1 targets two and three are at 0.68747 and 0.68451.
Is the AUD USD bounce a reversal or a pullback?
Nobody can know that in advance, which is the honest answer. The test used here is structural: a rally inside a downtrend is one that has not produced a higher high on the bigger chart. At the time these charts were read, the daily and the four hour had not produced one. That describes the current structure rather than predicting what happens next.
When should you sell into strength?
Four conditions. The direction must already be decided by the daily and four hour before the bounce starts. The strength must not have broken structure. You act on the chart that has already turned back down rather than the one still rising. And you accept that sometimes the small chart is early and the bigger charts simply have not caught up, which is why the stop exists and why position size comes from it.
How far did the last AUD USD four hour trade travel?
That ticket entered at 0.71111 on 22 September with 23.2 pips of risk, and reached all three targets at 0.70879, 0.70648 and 0.70416. Price is now at 0.69434, which is 98 pips below the final target and 167 below the entry, thirteen days later. One finished trade is an example rather than a system.
Trading foreign exchange and other leveraged products carries a high level of risk and is not suitable for everyone. The levels above describe where the indicator placed entries, stops and targets at the time the charts were read. They are not forecasts and nothing here is financial advice. Past performance does not guarantee future results.

