Why Currency Strength Meters Disagree: 24 Hour Momentum Vs Trend Structure, And Which One We Trust
Open two currency strength meters on the same afternoon and you can get opposite answers. Here is why currency strength meters disagree, and which one to trust.
On 29 October 2026, a popular online currency strength meter showed the Japanese yen near the top of the board and the Australian dollar near the bottom. At the same time, our own currency strength board ranked the Australian dollar as one of the two strongest currencies, and the yen as one of the weakest.
Same market. Same eight currencies. Opposite conclusions.
Neither meter was broken. They were answering two different questions. Once you know which question each one answers, you know which one to use, and when.
1. Two Meters, One Afternoon
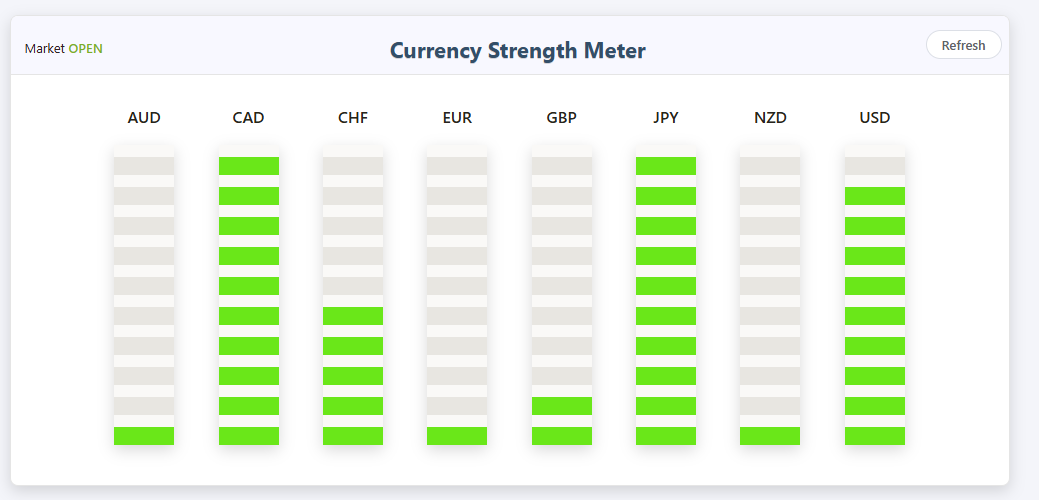
| 24 hour meter | Our structure read | |
|---|---|---|
| Strongest | CAD, JPY, USD | CAD, AUD, GBP |
| Weakest | AUD, EUR, NZD | EUR, JPY, NZD |
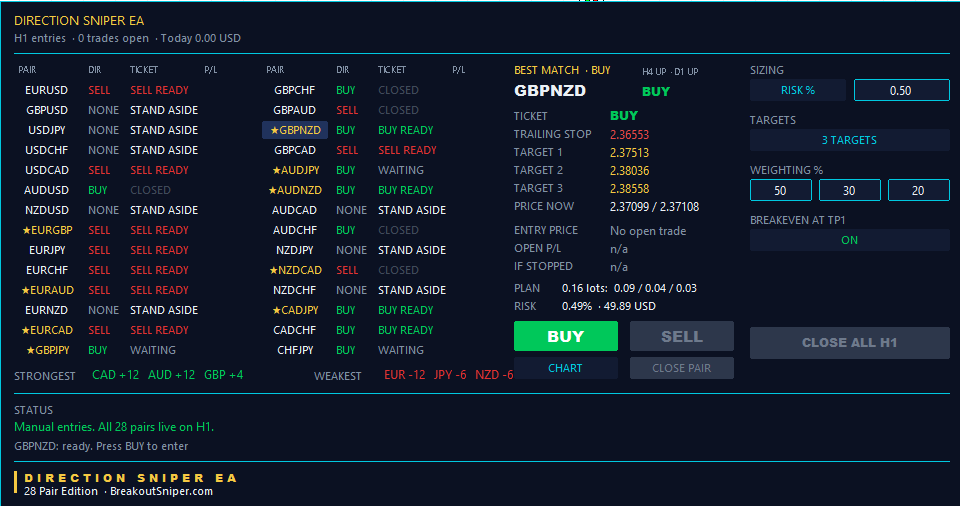
The two agree on some things. The Canadian dollar was strong on both, and the euro and New Zealand dollar were weak on both.
But look at the yen and the Australian dollar. They sit on opposite ends of the two boards. If you picked a pair from one meter, the other would tell you to do the exact opposite.
2. What A 24 Hour Meter Measures
Most online currency strength meters work the same way.
- Take each currency’s price change over the last 24 hours against the other seven.
- Average those changes into one score per currency.
- Rescale the eight scores so the strongest fills the bar and the weakest shows almost nothing.
That last step matters. A full bar does not mean a currency is strong in any absolute sense. It means it moved up the most in the last day, compared with the other seven.
So a 24 hour meter answers one question very well: who moved the most today?
That is useful information. It is fast, it reacts to news within minutes, and for an intraday trader who wants to ride today’s momentum, it is the right tool.
3. What A Structure Read Measures
A structure read asks a different question: who is in charge of the trend?
Instead of measuring how far price moved in a day, it looks at the direction of the trend on the bigger charts, across all 28 pairs, and ranks the eight currencies from strongest to weakest.
That makes it slow on purpose. A one day bounce does not flip it. It only changes when the bigger charts themselves turn.
So a structure read answers: which currency has the trend behind it, right now?
4. Why Do Currency Strength Meters Show Different Results?
The yen on 29 October is the clearest example.
For days, the bigger charts had the yen on the weak side. On CADJPY, for example, the 4 hour and daily trends both pointed up, so the Canadian dollar was in charge and the yen was not.
Then, over the last day, the yen bounced. Yen pairs pulled back. A 24 hour meter sees that pullback as yen strength, because over that one day, the yen did gain. So it pushed the yen near the top.
The structure read saw the same bounce and did not move, because the bigger charts had not turned. To a trend trader, that bounce is not a new trend. It is a pullback inside the old one.
Both readings are true at the same time. The yen was strong today, and weak in the trend.
5. Are Currency Strength Meters Accurate?
Yes, at what each one measures. A 24 hour meter is an accurate record of the last day’s price change. A structure read is an accurate record of which way the bigger charts are trending.
What no meter can do is predict what price does next. Treat any currency strength meter as a map of where the market stands, not a forecast of where it is going.
6. Which Currency Strength Meter Should You Trust?
We trust the structure read for choosing pairs, and we think most traders should.
Here is why.
1. A 24 hour meter tends to be loudest at the wrong moment. When a weak currency bounces hard, the meter shows it as strong, right when the bounce may be running out. Traders who buy that strength are often buying the top of a pullback.
2. A pair should be chosen on the trend, and entered on the timing. The trend tells you which side to be on. Today’s move only tells you whether now is a good moment. Mixing those two jobs up is how traders end up trading against the bigger picture.
3. Slow and steady is easier to trade. A ranking that flips several times a day is hard to plan around. A ranking that only changes when the bigger charts turn gives you time to think, check your levels and size the trade.
That said, a 24 hour meter is not useless. We think it is best used as a timing clue, not a pair picker.
| If you are… | Use |
|---|---|
| Choosing which pair to trade | The structure read |
| Choosing the direction | The structure read |
| Looking for a pullback to enter on | The gap between the two |
| Scalping today’s momentum only | The 24 hour meter |
7. The Gap Between Them Is The Interesting Part
Here is the idea we like most.
When a currency is weak in the trend but strong on the day, as the yen was on 29 October, the market is pulling back against the bigger direction. For a trend trader, that is not a reason to switch sides. It is a reason to get ready.
The pullback is where the next entry in the trend’s direction usually comes from. The question is never whether to follow the bounce. It is when the bounce has finished.
That is the part neither meter can answer on its own. It needs a tool that reads the trend on the bigger charts and waits for a faster chart to turn back in the same direction before it prints an entry.
8. How To Use A Currency Strength Meter, Step By Step
- Rank the currencies on structure. Find the strongest and weakest of the eight. We publish this every trading day in our Currency Strength Today reads.
- Pair the strong with the weak. Those are the pairs most likely to keep trending cleanly.
- Glance at the 24 hour picture. If a structurally weak currency is bouncing today, expect a pullback on its pairs, and do not chase it.
- Wait for the entry. Let a faster chart turn back in the trend’s direction before acting. On the Direction Sniper panel, that is when a ticket prints, with its entry, stop and three targets.
- Size it. Decide how much you are willing to lose before you place the order.
9. The Step Most Traders Skip
No meter, ours included, removes risk. Technical analysis is a game of probability, and there is no holy grail.
What you control is how much a wrong read costs you. We risk at most 2 percent per trade, usually 0.5 percent. On a $10,000 account, that is $50, whichever pair the meter points to.
A wider stop does not mean more risk. It means a smaller lot. To work out your exact size in seconds, use our free Lot Size Calculator. It covers all 28 forex pairs, as well as gold, silver, Bitcoin and Ethereum.
On a small account, a cent account makes the right sizes possible. For small balances we recommend a RoboForex Cent account or an XM Micro account. These are partner links, so we may receive a commission at no cost to you.
If you are worrying about every trade, your lot size is still too big.
Trend First, Timing Second
A 24 hour meter tells you who moved today. A structure read tells you who is in charge. When they disagree, the market is usually pulling back, and that pullback is where patient traders find their entries.
That is the thinking behind Direction Sniper:
- Direction. One verdict from the 4 hour and the daily, so a one day bounce does not flip it.
- Rallies and bounces that have not broken structure. When a weak currency bounces, the panel keeps the trend’s direction until the bigger charts actually turn.
- The stop loss. Every ticket arrives with its stop and three targets marked, so you know your risk before you place the order.
The 28 Pair Edition puts this panel on all 28 pairs, MT4 or MT5, on one licence.
Want the strongest and weakest currencies in your inbox every trading day? Join The Daily Sniper Read, free.
Currency Strength Meters: Frequently Asked Questions
1Why do currency strength meters disagree?+
Because they measure different things. A 24 hour meter ranks currencies by how far they moved in the last day, while a structure read ranks them by the direction of the trend on the bigger charts.
When a currency bounces against its trend, the 24 hour meter shows it as strong and the structure read still shows it as weak. Both are true at the same time.
2How does a 24 hour currency strength meter work?+
It takes each currency’s price change over the last 24 hours against the other seven, averages them into one score, and rescales the eight scores so the strongest fills the bar.
A full bar means the currency moved up the most in the last day compared with the others, not that it is strong in any absolute sense.
3Are currency strength meters accurate?+
Yes, at what each one measures, but they answer different questions. In our opinion, a structure read is better for choosing the pair and the direction, and a 24 hour meter is better as a timing clue or for intraday momentum.
No currency strength meter predicts what price will do.
4Why was the yen strong on one meter and weak on another on 29 October 2026?+
Yen pairs pulled back over the last day, so the yen gained and a 24 hour meter pushed it near the top. The 4 hour and daily trends had not turned, so our structure read kept the yen on the weak side.
To a trend trader, that bounce was a pullback inside the old trend, not a new one.
5Should I buy a currency that shows as strong on a 24 hour meter?+
Not on that alone. When a currency that is weak in the trend shows as strong on the day, it is often a pullback near its end, and buying it means trading against the bigger direction.
Choose the pair and direction on the trend, then wait for a faster chart to turn back in that direction before entering.
6How do you use currency strength to pick forex pairs?+
Rank the eight currencies on structure, pair a strong currency against a weak one, and check whether today’s move is a pullback against that trend. Then wait for an entry, and size the trade before you place it.
We publish the strongest and weakest currencies every trading day in our Currency Strength Today reads.
7How much should I risk per trade?+
We risk at most 2 percent per trade, usually 0.5 percent, which is $50 on a $10,000 account. A wider stop does not mean more risk, it means a smaller lot.
Use the Lot Size Calculator to work out your exact size. These figures are arithmetic for illustration, not a recommendation about how much anyone should trade.
DIRECTION SNIPER 28 PAIR EDITION
Trend first, timing second, on all 28 pairs.
One verdict from the bigger charts, an entry when a faster chart agrees, and a stop on every ticket. MT4 or MT5, one licence.
Disclaimer: This guide, why currency strength meters disagree, compares two ways of measuring currency strength, using readings from 29 October 2026 as an example. It is educational analysis and our opinion, not financial advice and not a trade signal service. No currency strength meter predicts what price will do. Lot sizes and risk figures are arithmetic for illustration and are not a recommendation about how much anyone should trade. Forex trading carries risk, and you should only trade money you can afford to lose.

