EUR JPY Forecast Today, 22 October 2026: How Do You Catch A Big Move Before It Happens? 11 Targets Reached As EURJPY Falls 210 Pips
This EUR JPY forecast today is about the kind of day every trader wishes they had been ready for.
EURJPY started 22 October around 177.75. By the afternoon it was trading near 175.65. That is a fall of roughly 210 pips in a single session.
Most traders only notice a move like that once it is on the chart in big red candles. By then the best of it is gone.
The Direction Sniper panel was lined up before the steepest part of the fall. Sell tickets printed on the 15 minute, 30 minute and 1 hour, all between 177.28 and 177.54, with their stops already marked. Eleven targets were reached in one session, and the 4 hour ticket is now about 14 pips from its third target.
Here is how the board lined up, step by step, and what it teaches about catching big moves.
1. The Trap: You Only See A Big Move After It Has Happened
When a pair drops 210 pips, the chart afterwards looks obvious. The trap is that it never looks obvious beforehand.
Before a move like this, the chart usually looks quiet. A few candles drift, nothing dramatic happens, and there is no reason to pay attention. Then the big candles arrive, and the trader who was not watching faces two bad choices:
- Chase it. Sell near the bottom after the move is mostly done, with a stop placed on a guess
- Fight it. Decide it has “fallen too far” and buy, against a 4 hour and daily chart that both point down
Nobody can predict when a big move will start. That is not the job. The job is to be lined up with the direction when it does, with the stop already decided.
That is exactly what the panel does.
2. How The Board Lined Up Before The Drop
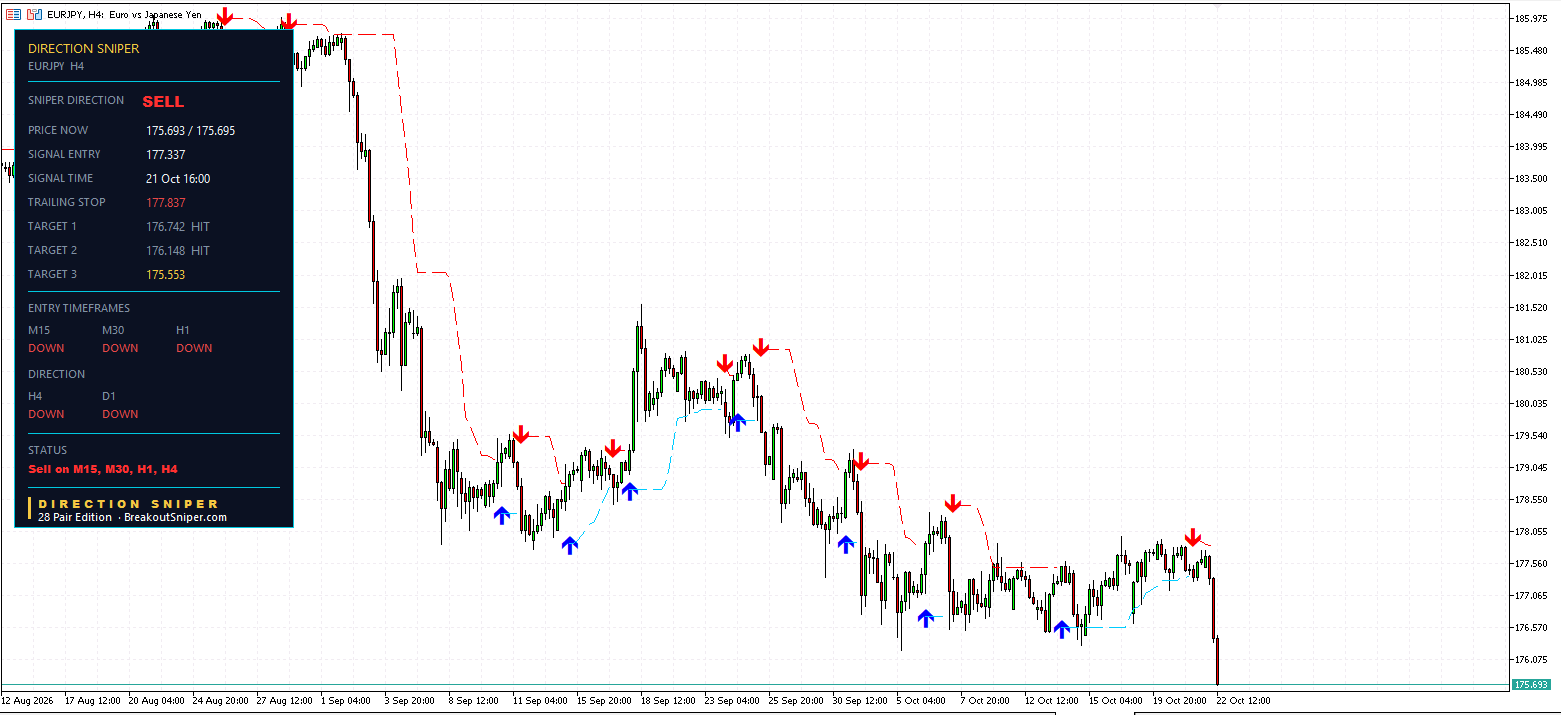
The board lined up in the same order the Direction Sniper method always follows: the big charts first, then the fast ones.
Step 1: the verdict. On 21 October at 16:00 the 4 hour turned DOWN and joined the daily. The verdict became SELL, and the 4 hour printed its own ticket at 177.337.
Step 2: the first entry charts. Overnight EURJPY drifted quietly. Then, at 04:45 on 22 October, the 15 minute lined up with the verdict and printed a sell at 177.538. Fifteen minutes later the 30 minute printed at 177.529.
Step 3: the 1 hour. At 07:00 the 1 hour printed a sell at 177.281.
At that point the status line read Sell on M15, M30, H1, H4. Every entry chart and both direction charts agreed.
Step 4: the move. Then the big candles came.
Notice what the panel did not do. It did not predict 210 pips. It did not know how far the move would go. It simply showed that every timeframe agreed on the direction, printed tickets with their stops marked, and let the targets do the rest.
3. Eleven Targets Reached
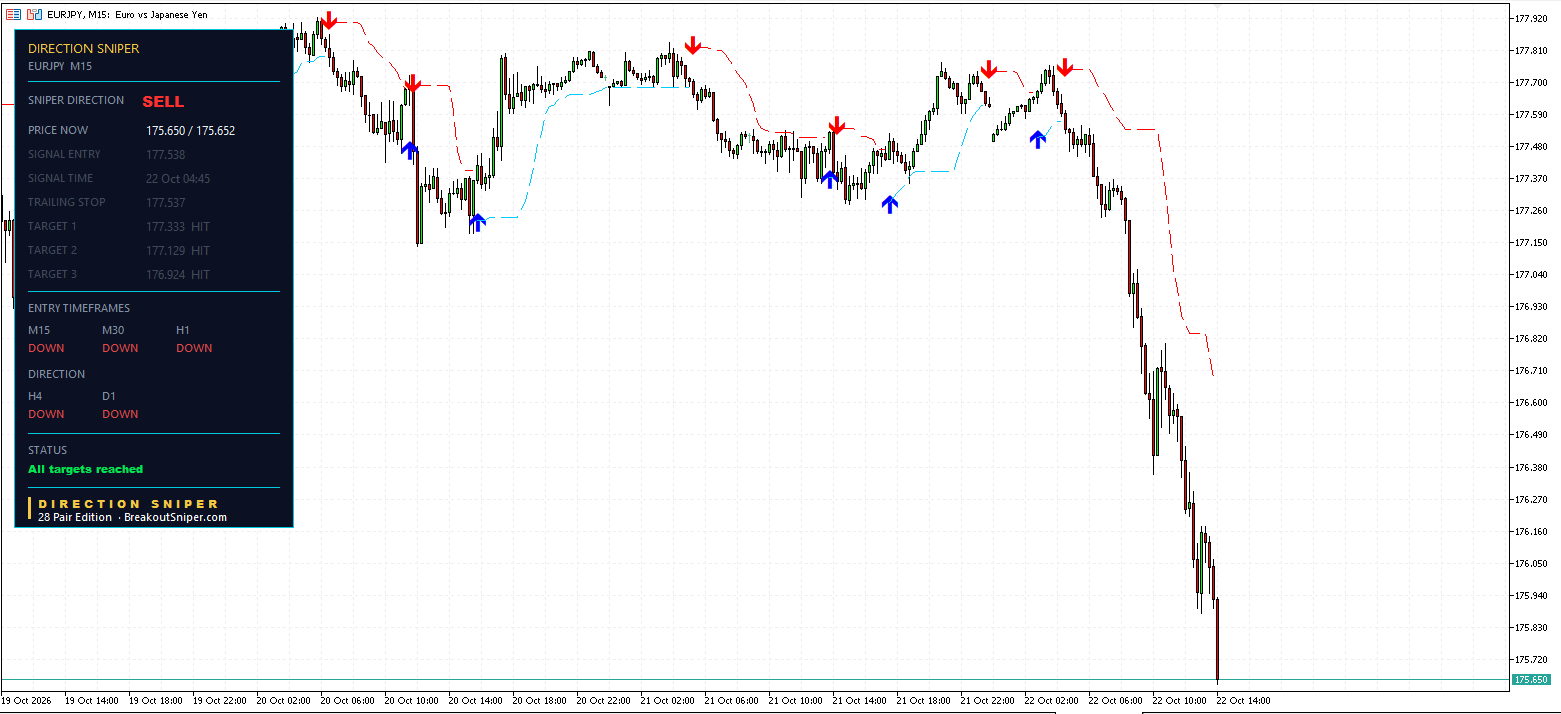
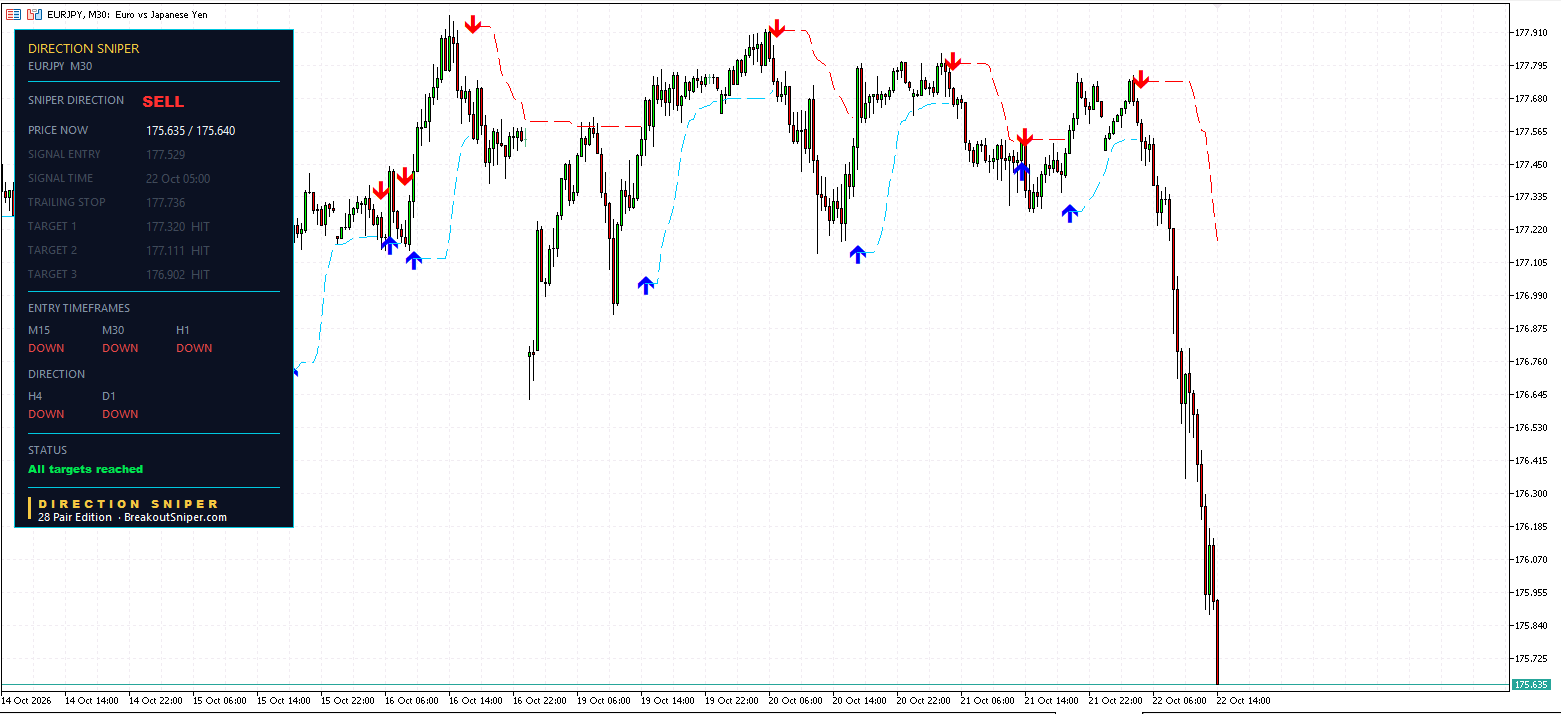
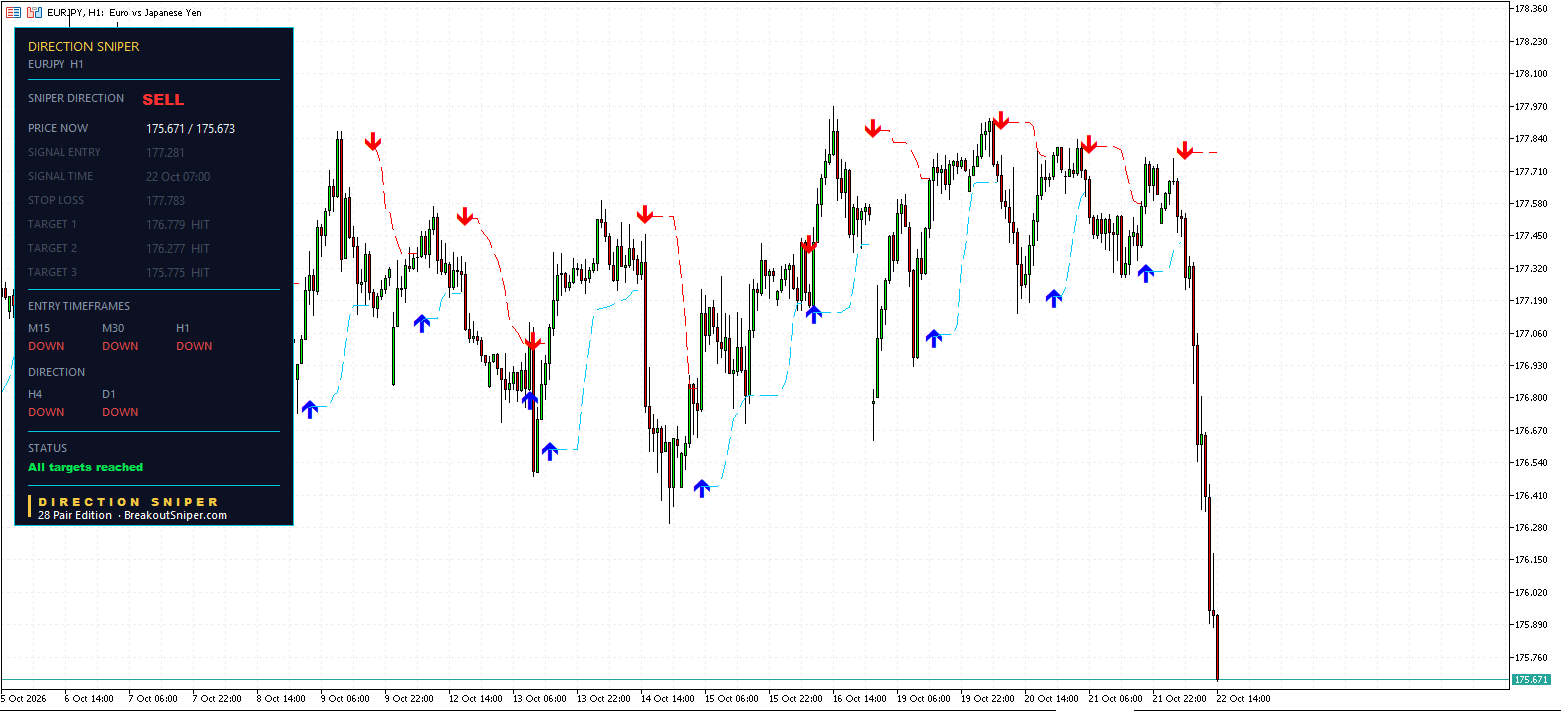
| Chart | Entry | Risk | Targets | Status |
|---|---|---|---|---|
| M15 | 177.538 (22 Oct 04:45) | 20.5 pips | 177.333, 177.129, 176.924 | All targets reached |
| M30 | 177.529 (22 Oct 05:00) | 20.9 pips | 177.320, 177.111, 176.902 | All targets reached |
| H1 | 177.281 (22 Oct 07:00) | 50.2 pips | 176.779, 176.277, 175.775 | All targets reached |
| H4 | 177.337 (21 Oct 16:00) | 59.5 pips | 176.742 reached, 176.148 reached, 175.553 | Running |
Three tickets completed their whole plan. The 4 hour has reached two of its three.
One detail worth noticing on the 1 hour: its panel still reads STOP LOSS, not TRAILING STOP. The stop never needed to move. All three targets were reached before the trailing level had any reason to tighten. On the 15 minute and 30 minute, the trailing levels barely moved either.
That is a good reminder of something we showed on silver last week: targets measure distance, the trail measures structure. On a fast, clean move, price can reach every target before the structure behind it has time to change.
4. The 4 Hour: About 14 Pips From Target 3
The 4 hour ticket is the one still running.
| Level | |
|---|---|
| Entry, sell | 177.337 (21 Oct 16:00) |
| Original stop | 177.932, so 59.5 pips of risk |
| Trailing stop now | 177.837 |
| Target 1 | 176.742, reached |
| Target 2 | 176.148, reached |
| Target 3 | 175.553 |
Price is about 175.69, which is 164 pips below the entry, about 2.76 times the original risk. Target 3 sits about 14 pips lower.
Here is the honest part. The 4 hour trailing level has only tightened about 9.5 pips. It still sits 50 pips behind the entry. On a 4 hour chart, structure moves slowly, and a fast one day fall does not change that. If EURJPY bounced hard from here, the trailing level would not protect the gain the way a tighter level would.
That is why the targets exist. Two of them are already reached, and the third is close. Target 3 ends the plan, not necessarily the move, and the plan is what the panel was built to give you.
5. What To Watch Next
After a 210 pip day, the trap flips. The new temptation is to sell now, at the bottom, because the move looked so strong.
The panel does not chase. Every entry chart has completed its ticket, so the next fresh sell would need a bounce first, then a faster chart turning back DOWN to line up with the verdict again. That is the same rule we showed on AUDUSD this week in the opposite direction: a strong trend hands you a fresh ticket every time it pulls back.
The levels that matter:
- The 4 hour Target 3 at 175.553, about 14 pips below price
- The 4 hour trailing stop at 177.837, the level that would close the last open ticket
- The verdict: if the 4 hour turned UP while the daily stayed DOWN, it would move to NO TRADE and the panel would stop looking for sells. Today every timeframe reads DOWN
Nobody knows whether EURJPY keeps falling or bounces first. The panel gives you the map, not a prediction.
6. A 210 Pip Day, And The Same 0.5 Percent
Big days tempt traders to size up. This is exactly when not to.
EURJPY is quoted in yen, so one pip on a standard lot is 1,000 yen. With USDJPY near 157, that is roughly $6.40 per pip. Check the exact figure on your own platform, because it moves with the yen.
At 0.5 percent of a $10,000 account, which is $50 of risk:
| Chart | Stop distance | Lot size for $50 of risk |
|---|---|---|
| M15 | 20.5 pips | about 0.38 lots |
| M30 | 20.9 pips | about 0.37 lots |
| H1 | 50.2 pips | about 0.16 lots |
| H4 | 59.5 pips | about 0.13 lots |
Every one of those tickets risked the same $50, whether it was the 15 minute or the 4 hour. Nobody knew this would become a 210 pip day when the tickets printed at 04:45. The day before might just as easily have ended with a stop loss.
That is the point. You cannot tell which ticket will be the big one, so every ticket gets the same risk. The big days pay for the small losses only if you were still around, with your account intact, when the big day came.
On a $100 account, 0.5 percent is 50 cents, and even 0.01 lots on the 4 hour ticket would risk about $3.80, which is 3.8 percent. A cent account makes the right size possible. For small balances we recommend a RoboForex Cent account or an XM Micro account. These are partner links, so we may receive a commission at no cost to you.
We risk at most 2 percent per trade, usually 0.5 percent. If you are worrying about every trade, your lot size is still too big.
You Cannot Predict A Big Move. You Can Be Lined Up For It.
Put the day together.
The verdict turned SELL the afternoon before. The fast charts lined up in the quiet early hours. Every ticket arrived with its stop marked and three targets set. Then EURJPY fell 210 pips, and eleven targets were reached in one session.
No prediction. No chasing. No guessing where the stop goes.
The Direction Sniper 28 Pair Edition puts this exact panel on EURJPY and 27 other pairs:
- Direction. One verdict from the 4 hour and the daily. On EURJPY it turned SELL the afternoon before the move.
- Rallies that have not broken structure. After a big day, the panel waits for the bounce and the next alignment, instead of chasing the bottom.
- The stop loss. Every ticket arrives with its stop marked, so you size it before you enter, and every ticket risks the same, big day or not.
With 28 pairs on one panel, there is almost always a chart lined up with its verdict somewhere. Today it was EURJPY.
28 pairs, one licence, MT4 or MT5.
Want a read like this in your inbox? Join The Daily Sniper Read, free, every trading day.
EUR JPY Forecast Today: Frequently Asked Questions
What is the EUR JPY forecast today, 22 October 2026?
The Direction Sniper panel reads SELL on EURJPY, because the 4 hour and the daily charts both point down.
Every entry chart also reads DOWN, so the status shows Sell on M15, M30, H1, H4. EURJPY fell from around 177.75 to about 175.65 during the session, roughly 210 pips.
How do you catch a big move before it happens?
Nobody can predict when a big move will start. What you can do is be lined up with the direction when it does, with the stop already decided.
On EURJPY the verdict turned SELL on 21 October at 16:00, and the 15 minute, 30 minute and 1 hour printed sells between 177.28 and 177.54 early on 22 October, before the steepest part of the fall. Each ticket arrived with its stop marked and three targets set.
How many EURJPY targets were reached on 22 October 2026?
Eleven. The 15 minute ticket from 177.538, the 30 minute ticket from 177.529 and the 1 hour ticket from 177.281 each reached all three of their targets. The 4 hour ticket from 177.337 reached Target 1 at 176.742 and Target 2 at 176.148.
Price reaching a published target level is not the same as a realised result.
Why does the EURJPY 1 hour panel still say STOP LOSS after all targets were reached?
The 1 hour stop never needed to move. EURJPY fell fast enough that all three targets, 176.779, 176.277 and 175.775, were reached before the trailing level had any reason to tighten.
Targets measure distance and the trailing level measures structure, so on a fast, clean move price can reach every target before the structure behind it changes.
Where is the EURJPY 4 hour ticket now?
The 4 hour sell from 177.337 started with a stop at 177.932, which is 59.5 pips of risk. Price is about 164 pips below the entry, and Target 3 at 175.553 sits about 14 pips lower.
Its trailing level at 177.837 still sits 50 pips behind the entry, because a 4 hour structure moves slowly. Direction Sniper calculates and shows the trailing level; the trader adjusts the order on the platform.
Should you sell EURJPY now after a 210 pip drop?
The panel does not chase. Every entry chart has completed its ticket, so a fresh sell would need a bounce first, then a faster chart turning back DOWN to line up with the SELL verdict again.
If the 4 hour turned UP while the daily stayed DOWN, the verdict would move to NO TRADE and the panel would stop looking for sells.
What lot size goes with a EURJPY ticket?
EURJPY is quoted in yen, so one pip on a standard lot is 1,000 yen, roughly $6.40 with USDJPY near 157. To risk $50, which is 0.5 percent of a $10,000 account, a 20.5 pip stop needs about 0.38 lots and a 59.5 pip stop needs about 0.13 lots.
Every ticket gets the same risk, because nobody knows in advance which one will be the big one. We risk at most 2 percent per trade, usually 0.5 percent. These figures are arithmetic for illustration, not a recommendation about how much anyone should trade.
Disclaimer: This post reports what the Direction Sniper panel showed on EURJPY on 22 October 2026. It is educational analysis, not financial advice and not a trade signal service. The 4 hour ticket was still open at the time of writing. Price reaching a published target level is not the same as a realised result. High and low levels are approximate readings from the chart. Pip values and lot sizes are arithmetic for illustration, depend on the exchange rate, and are not a recommendation about how much anyone should trade. Forex trading carries risk, and you should only trade money you can afford to lose.

