Bitcoin Forecast Today, 11 October 2026: The Four Hour Closed In Front. Now Nothing Qualifies.
Executive Summary
Two things happened on Bitcoin, and the second one is the unusual one.
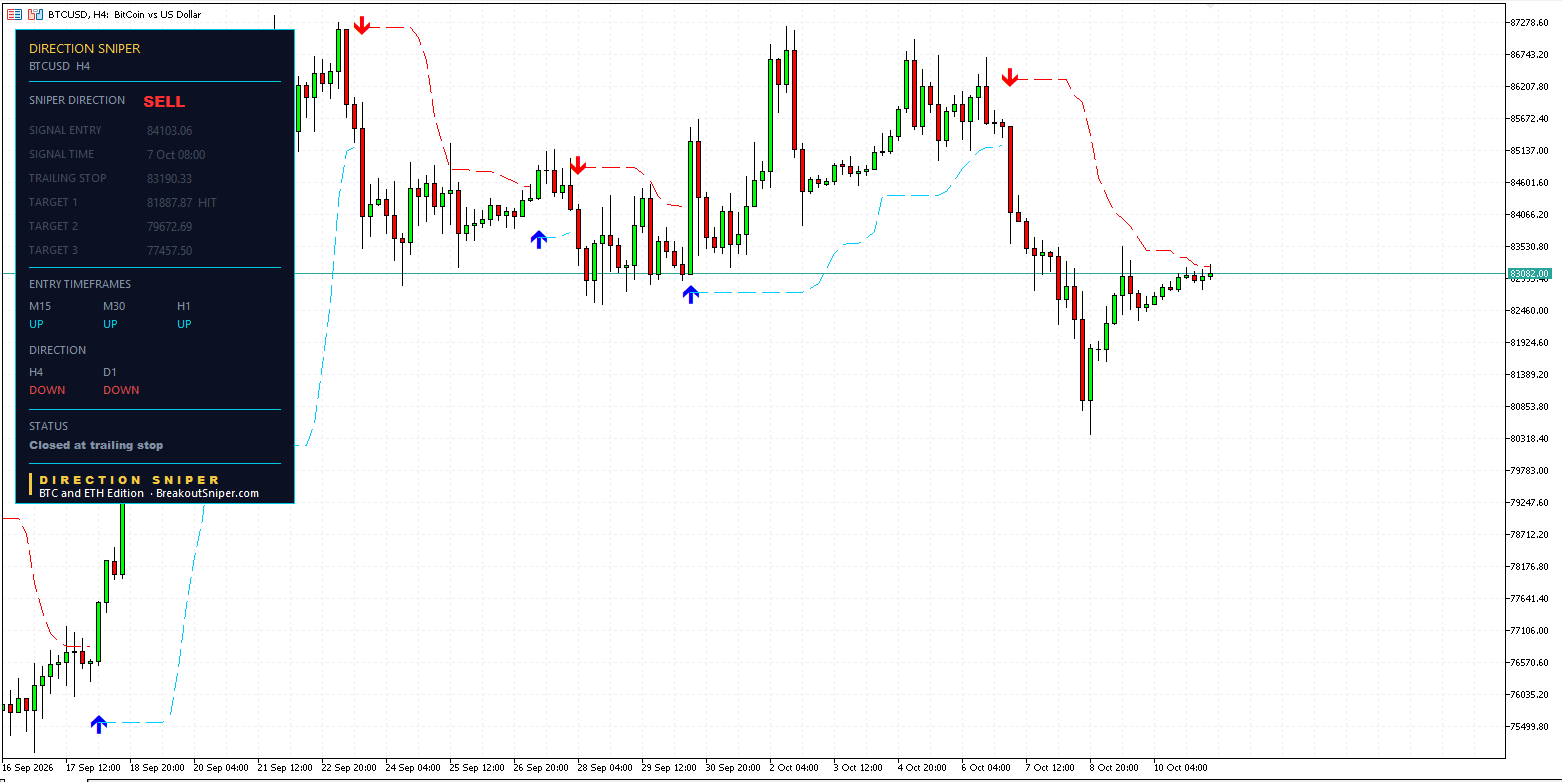
The four hour ticket that had been short since Tuesday reached its first target and then closed at its trailing stop, 912.73 points in front of where it entered.
And then every single entry chart turned up. There is now nothing on the board at all.
Bitcoin is trading at 83042.
| Chart | Direction | Ticket |
|---|---|---|
| D1 | DOWN | sets the verdict |
| H4 | DOWN | sets the verdict. Ticket closed at 83190.33 |
| H1 | UP | none |
| M30 | UP | none |
| M15 | UP | none |
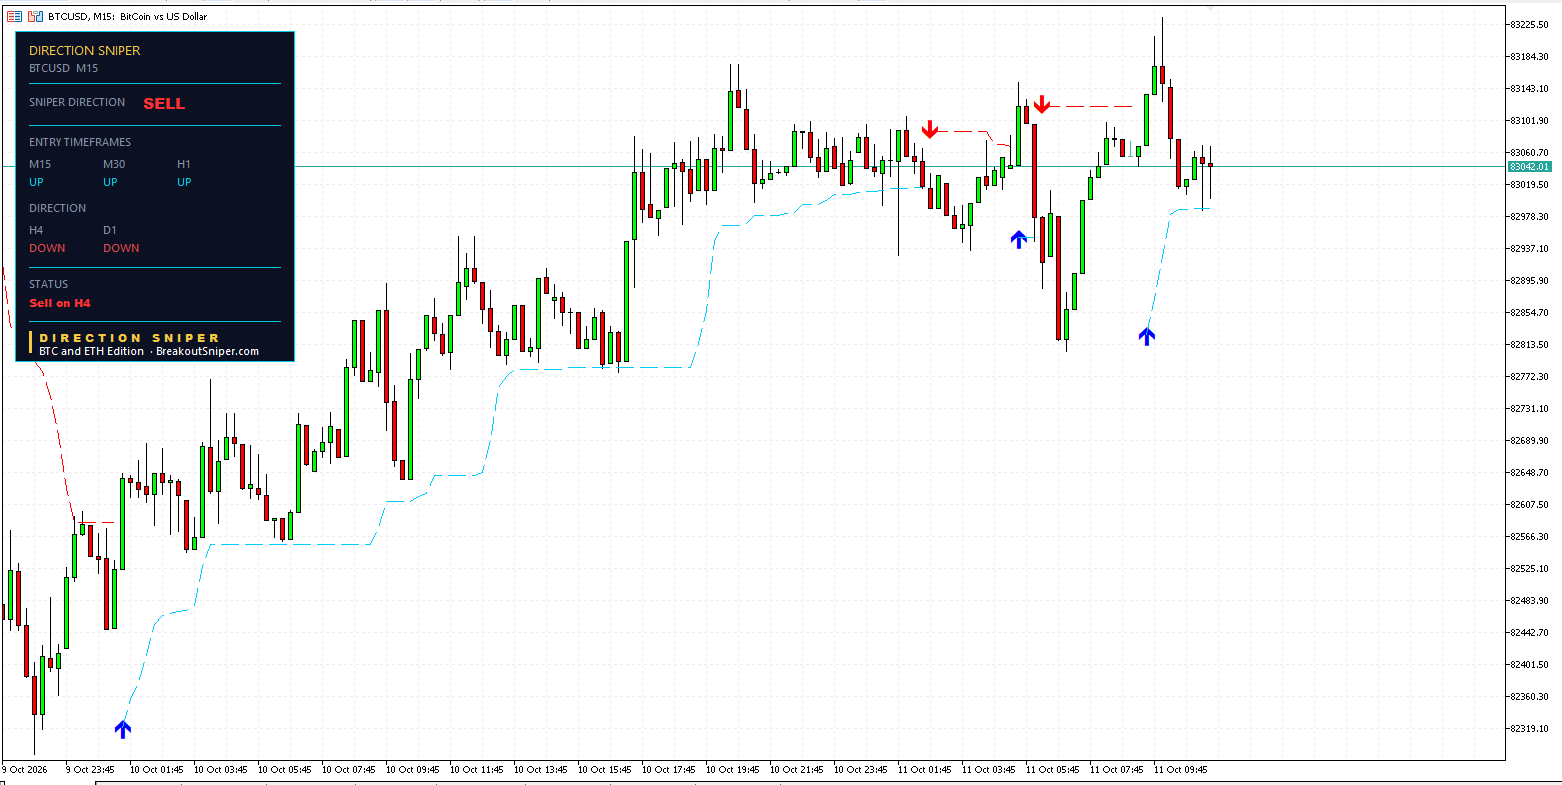
Zero tickets out of three entry charts. Every panel reads the same thing: Sell on H4, and nothing else.
We have published every day this month and that has not happened once. Gold on Wednesday had one of three. This is zero.
Why we publish this. Every entry, stop and target below is a level the indicator printed on a live chart, at the moment it printed, before price did anything about it. Nothing is back tested. Nothing is chosen after the fact. We publish the tickets that worked and the ones that did not, because a page that only shows you the winners teaches you nothing you can use. The point is to show how the panel is read and how position size follows from a stop. These are not trade recommendations and nothing here is financial advice.
1. The Ticket That Finished Properly
Here it is from entry to close.
| Level | |
|---|---|
| Entry, sell | 84103.06 on 7 October at 08:00 |
| Original stop | 86318.25, so 2215.19 points of risk |
| Target 1 at 81887.87 | reached |
| Target 2 | 79672.69, not reached |
| Target 3 | 77457.50, not reached |
| Closed at trailing stop | 83190.33 |
Now look at where that closing level sits relative to the entry.
The entry was 84103.06. It closed at 83190.33. On a sell, that is 912.73 points in front of where the trade began.
The trailing level started at 86318.25 and ended at 83190.33. It travelled 3,127.92 points, and somewhere in the middle of that journey it crossed under the entry price.
That crossing is the whole thing. Before it, the level was limiting a loss. After it, the level was holding on to what the trade had already done. By the time price came back up and touched it, the stop was doing the second job, not the first.
What the tool does for you here: the level is recalculated as structure tightens, and the label changes from STOP LOSS to TRAILING STOP the moment it starts moving. You can watch it cross under your entry and know, at a glance, which of those two jobs it is currently doing. What the indicator does not do is move the order on your platform. That part is yours, and a level you can see but have not acted on is still your original 2215.19.
2. Why “Closed At Trailing Stop” Meant Something Good Here
That status line appears on this site often, and it means two opposite things depending on one number.
We published a GBP USD four hour on Friday with the same status line. It entered at 1.32028 and closed at 1.32479, which on a sell is above the entry. That one cost 45.1 pips, because its level never crossed.
Today’s Bitcoin ticket closed below its entry. Same words, opposite side, opposite outcome.
The status tells you the position is finished. The number tells you how. If you take one thing from this page, take that.
We have written the whole mechanism up, with four worked examples, in our guide to when to move your stop loss to break even.
3. The Honest Half
Price is 83042 right now. The entry was 84103.06.
Held to this moment, that position would be 1061.06 points in front rather than the 912.73 it closed at. So on this one trade, the trailing level finished about 148 points earlier than simply sitting there would have.
That is the trade you make with a trailing stop, and we have said it every time it has come up this month. The saving is certain and applies to every position. The cost is occasional, invisible at the time, and only ever measurable afterwards.
Today it cost 148 points. On Wednesday’s gold ticket it saved 36.61. Nobody can tell you in advance which kind of day today is, and anyone who claims they can does not need a stop at all.
4. Now There Is Nothing, And That Is The Output
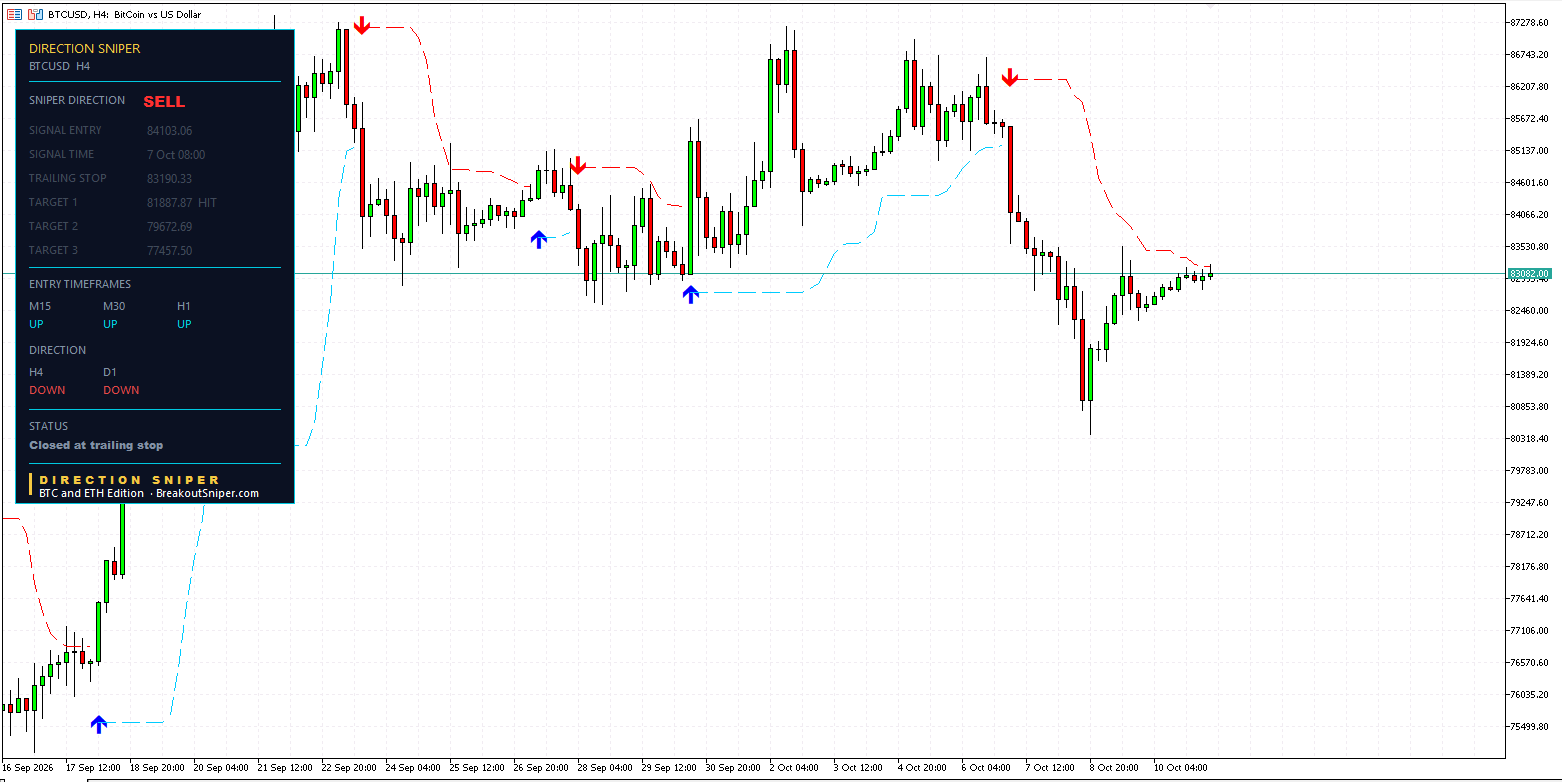
The daily and the four hour still point down, so the verdict is still SELL.
But the fifteen minute, the thirty minute and the one hour all point up. Every one of them.
The panel will not build a sell ticket on a chart that is currently pointing the other way. So it issues no entry, no stop and no targets on any of the three, and waits for alignment. All three status lines read the same thing: Sell on H4.
That is not a failure. It is the answer.
A tool that always has something for you is not reading the market, it is manufacturing a reason to trade. The three charts that would normally give you an entry are, right now, pointing against the direction the two charts above them have set. There is no version of that which produces a sensible trade.
What the tool does for you here: a blank board is the cheapest thing you will see all week. The alternative, on a morning like this, is a trader deciding that one of those three charts is “close enough” and taking a sell into three timeframes that are rising.
5. So What Do You Actually Do Today
Three things, and none of them involve trading Bitcoin.
Go and look at other markets. This is the strongest argument there is for running the panel across more than one instrument. Bitcoin has nothing this morning. That tells you nothing about gold, the pound or the euro, and the only way to find out is to have the panel on them.
Note the level that would change it. The three entry charts have to turn back down before any of them builds a ticket. That is a specific, observable event rather than a feeling, and until it happens there is no trade here regardless of how the price action looks.
Do nothing, deliberately. A day without a position is not a day wasted. It is a day where your account did not move, which on the days you were going to be wrong is the best outcome available. Most trading losses are not caused by bad analysis. They are caused by trading on days that did not have a trade in them.
6. What The Lot Size Would Have Been
The stop distance is where position size comes from, and that four hour ticket is a useful example because the number is large.
2215.19 points of risk on the entry. The calculation is the same as always: your risk in money divided by the stop distance, divided by what one point is worth per lot.
On most brokers one lot of BTCUSD is one Bitcoin, which makes a one point move worth one dollar per lot. On that basis, a ten thousand dollar account risking half a percent, which is fifty dollars, would have been looking at about 0.02 lots.
Check your own contract specification before you use that number. Crypto specifications vary far more between brokers than forex or gold does, and some quote in a different contract size entirely. The method is identical everywhere. The inputs are not.
What the tool does for you here: the stop arrives measured, in points, on every ticket. That number is the only input the calculation needs, and it is the difference between choosing a position size and inheriting one.
Where The Levels Sit Now
With Bitcoin at 83042:
83190.33 is where the four hour ticket closed, 148 points above price. That is history now rather than a level to trade against, but it is worth knowing where the last one ended.
The unreached targets from that ticket sit at 79672.69 and 77457.50, which are 3,369 and 5,585 points below price. They are no longer live, because the ticket that owned them is finished.
There are no live levels on the board this morning. No entry, no stop and no target on any of the three entry charts, because none of them has a ticket. The next one appears when a chart turns back down and aligns with the verdict above it.
Those are the levels on the chart and how far price sits from each. None of it is a forecast.
What You Are Actually Buying
A trailing level you can read rather than guess at. Today it crossed the entry and closed the position in front. On Friday, on a different market, an identical status line meant 45.1 pips gone. The difference was one number and the panel showed it the whole way.
A verdict that holds while shorter charts change their minds. All three entry timeframes turned up overnight. The daily and the four hour did not, so the direction did not.
A measured stop on every ticket. 2215.19 points on this one. You cannot eyeball that, and without it the position size is a guess.
And a blank board when nothing qualifies, which is the feature nobody advertises and everybody needs. A tool that finds you a trade every single day is not a tool, it is a slot machine.
These four panels came from the Bitcoin and Ethereum Edition. The same panel runs on these editions, all live now:
- Gold and Silver Edition, the original and still the one most of our traders run
- 28 Pair Edition, $77, every major, minor and cross, which is how you have somewhere to look on a morning like this one
- Forex Majors Edition, $47, the seven majors
- EURUSD Edition, $7, the cheapest way to put the panel on a chart and watch it work for yourself
Direction Sniper prints all of it on your charts in MetaTrader and keeps it live. You still move the order on your platform yourself. The indicator does the arithmetic, the click is yours.
One question. When was the last day you deliberately did not trade? Tell us on the reviews and feedback page.
Bitcoin Today: Common Questions
Is Bitcoin a buy or a sell today?
On 11 October 2026 the Direction Sniper panel reads SELL on Bitcoin, because the daily and the four hour both point down. No ticket exists on any entry chart, however, because the fifteen minute, thirty minute and one hour all point up. The four hour ticket from 7 October has closed at its trailing stop. This describes what the indicator displays and is not a recommendation to trade.
What happened to the Bitcoin four hour trade?
It closed at its trailing stop of 83190.33. The ticket entered at 84103.06 on 7 October with its stop at 86318.25, which is 2215.19 points of risk, and reached its first target at 81887.87. Its second and third targets at 79672.69 and 77457.50 were not reached. The closing level sits 912.73 points below the entry, which on a sell is in front of where the trade began.
How can a trailing stop close a trade in front of its entry?
Because the level keeps moving as structure tightens, and on a position that works it eventually crosses the entry price. This one started at 86318.25 and ended at 83190.33, travelling 3,127.92 points and crossing under the 84103.06 entry on the way. Before that crossing it was limiting a loss. After it, it was holding on to what the trade had already done, which is the job it was doing when price came back and touched it.
Why are there no Bitcoin signals on the shorter charts today?
Because all three of them point up while the verdict is to sell. The panel will not build a sell ticket on a timeframe pointing the other way, so it issues no entry, no stop and no targets on the fifteen minute, the thirty minute or the one hour, and waits for alignment. All three status lines read Sell on H4 and nothing else. The board is empty rather than broken.
What do you do on a day with no setups?
Three things, and none of them involve forcing a trade. Look at other markets, because one instrument having nothing says nothing about the others. Note the specific event that would change it, which here is any of the three entry charts turning back down. And accept that a day without a position is a day your account did not move, which on the days you would have been wrong is the best outcome available.
What are the Bitcoin key levels today?
There are no live levels on the board, because no entry chart carries a ticket. For reference, 83190.33 is where the four hour position closed, about 148 points above the current price of 83042, and the two targets that ticket never reached sat at 79672.69 and 77457.50. Those are history rather than levels to trade against. The next live level appears when an entry chart turns back down and aligns with the verdict.
What lot size should you use on Bitcoin?
The method is the same as any market: your risk in money divided by the stop distance, divided by what one point is worth per lot. On most brokers one lot of BTCUSD is one Bitcoin, so a one point move is worth one dollar per lot, and the 2215.19 point stop on this ticket would have allowed about 0.02 lots on a ten thousand dollar account risking half a percent. Cryptocurrency contract specifications vary widely between brokers, so check your own before using that figure.
Would holding the four hour trade have been better?
On this one trade, slightly. Price is 83042 against an entry of 84103.06, so a position held to this moment would be 1061.06 points in front rather than the 912.73 where the trailing level closed it, a difference of about 148 points. That is the trade a trailing stop makes. The saving is certain and applies to every position held, while the cost is occasional and only ever measurable afterwards.
Trading foreign exchange, gold, cryptocurrencies and other leveraged products carries a high level of risk and is not suitable for everyone. The levels above describe where the indicator placed entries, stops and targets at the time the charts were read, and the status shown for each ticket is the status the panel displayed at that moment. Distances between an entry and a closing level are arithmetic on published levels and are not a statement of anyone’s result, which depends on position size, spread, slippage and how each trader manages an order. Figures describing what a closed position would have done if it had been held are hypothetical. A stop is a level rather than a guarantee, and gaps or fast markets can fill you past it, which applies with particular force to cryptocurrency outside normal market hours. Trailing a stop reduces the worst case on a position but also closes positions that may later have moved further. Lot sizing figures are arithmetic for illustration and are not a recommendation about how much anyone should trade. Cryptocurrency contract specifications vary widely between brokers, so check your own before applying any figure on this page. Nothing here is financial advice. Past performance does not guarantee future results.

