Bitcoin and Ethereum Forecast Today, 4 October 2026: Do All Timeframes Need to Agree?
Executive Summary
Both Bitcoin and Ethereum are in BUY mode this morning. The daily and four hour charts agree on both markets, so every smaller chart on both symbols spent the session hunting for buying opportunities only. Nothing was looking for a short.
Seven live tickets across the two markets. One target already reached. And one Bitcoin chart produced no ticket at all, which is the most useful thing on this page today.
Bitcoin is trading at 84,812.00. Ethereum is trading at 2,692.23.
| Market | Chart | Verdict | Entry | Status now |
|---|---|---|---|---|
| Bitcoin | H4 | BUY | 85,290.32 | Running, price below entry |
| Bitcoin | H1 | BUY | 84,888.01 | Running, price below entry |
| Bitcoin | M30 | BUY | No ticket | Waiting for alignment |
| Bitcoin | M15 | BUY | 84,828.00 | Running, price below entry |
| Ethereum | H4 | BUY | 2,736.82 | Running, price below entry |
| Ethereum | H1 | BUY | 2,689.01 | Running, price above entry |
| Ethereum | M30 | BUY | 2,689.01 | Running, price above entry |
| Ethereum | M15 | BUY | 2,685.06 | Target 1 reached at 2,691.16 |
Four tickets are currently sitting below their entry price. Three are above. One has banked its first target and moved its stop above entry.
If you only read one line today, read this one. Bitcoin and Ethereum are both saying buy, but they are not saying it with the same number of voices, and that difference is not a problem to solve.
Both Markets Have Permission
In the Direction Sniper method, the daily and four hour charts are the gatekeepers. They do not find entries. They grant permission. Their only job is to answer one question for the whole market: which direction am I allowed to trade today?
On Bitcoin this morning, both say BUY.
On Ethereum this morning, both say BUY.
That is the end of that decision. It does not get re opened by a smaller chart, it does not get re voted, and it does not soften because one lower timeframe looks hesitant. The gatekeepers have spoken and every entry chart below them now works inside that answer.
This is the part most traders get backwards. They treat all their charts as a committee where everyone gets an equal vote, then they wait for the committee to reach a unanimous decision. That is not how the structure works here. It is a chain of command, not a vote.
Bitcoin: Three Tickets From Four Charts
H4, the gatekeeper that also traded
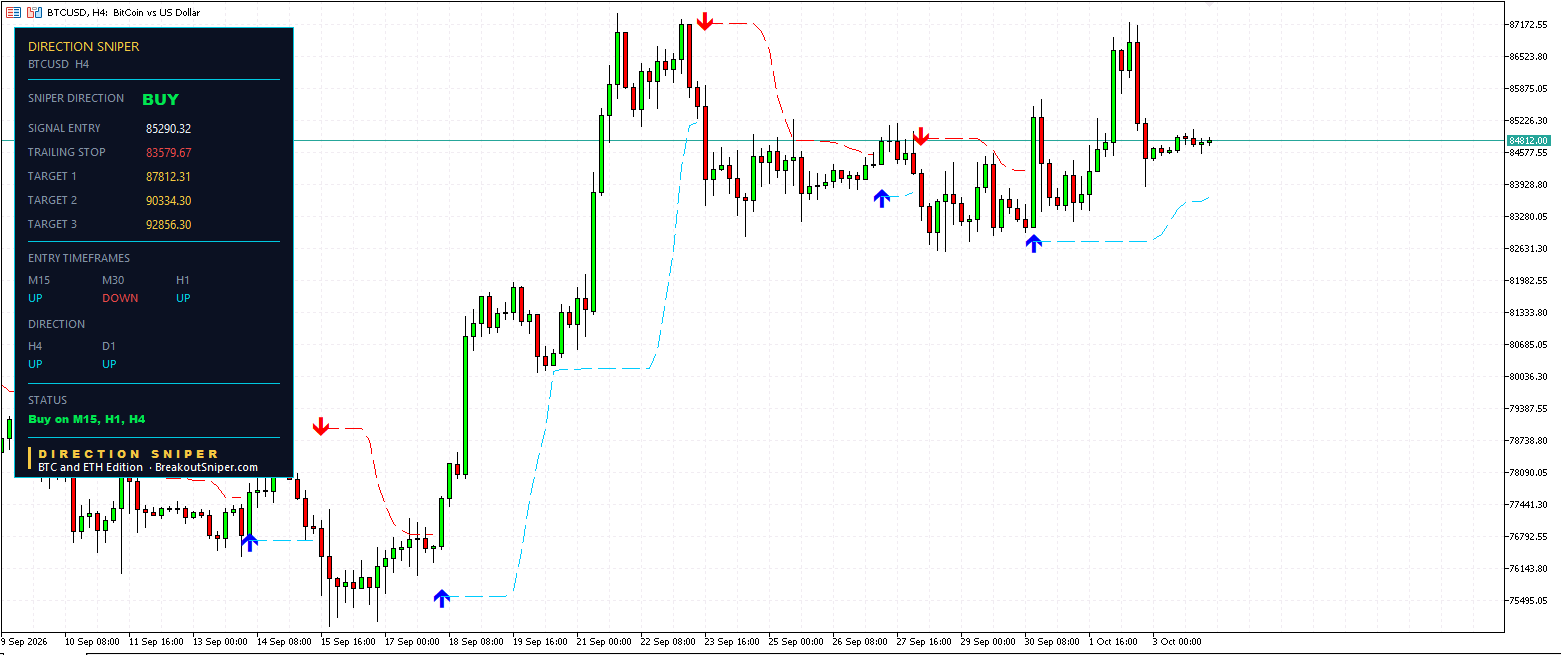
The four hour chart gave the verdict and then produced a ticket of its own.
Entry at 85,290.32. The original stop loss sat at 82,768.33, which puts the risk on this trade at 2,521.99. That is the distance the tool measures everything else against. Target 1 at 87,812.31, Target 2 at 90,334.30, Target 3 at 92,856.30, each one placed at one, two and three times the risk.
The level is no longer labelled as a stop loss. It now reads as a trailing stop at 83,579.67, because price moved far enough for the tool to pull it up from where it started. The trade has not reached its first target, but it has already improved its own worst case by over eight hundred points.
Price is currently at 84,812.00, which is below the entry. This trade is behind. It is still open and the trailing stop is still well clear, but it is behind.
H1, the second entry
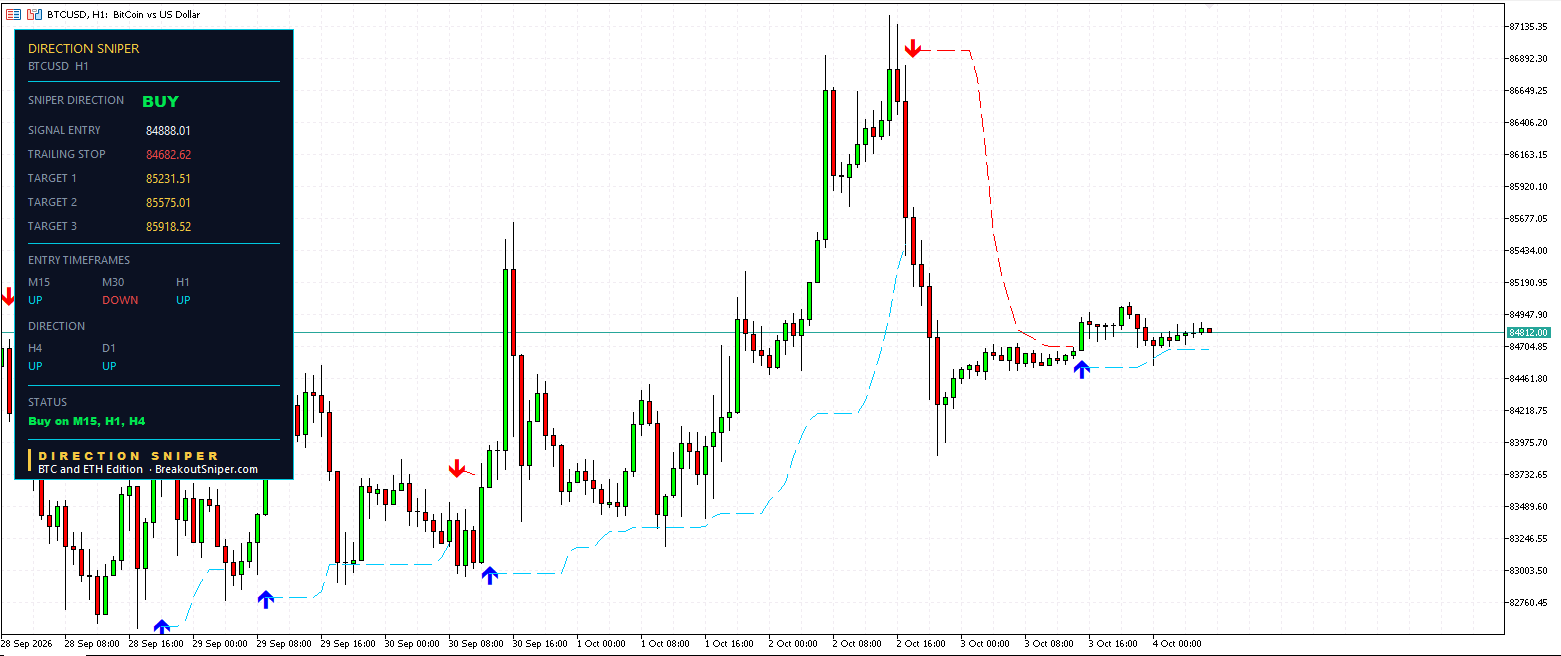
Entry at 84,888.01. Original stop at 84,544.51. Risk of 343.50. Target 1 at 85,231.51, then 85,575.01, then 85,918.52. The trailing stop has moved to 84,682.62.
Same direction as the four hour. Completely different size. The four hour is risking 2,521.99 points to make its first target. The one hour is risking 343.50. That is roughly one seventh of the exposure for the same directional idea.
Price at 84,812.00 is below this entry too, by 76 points.
M30, the chart that said nothing
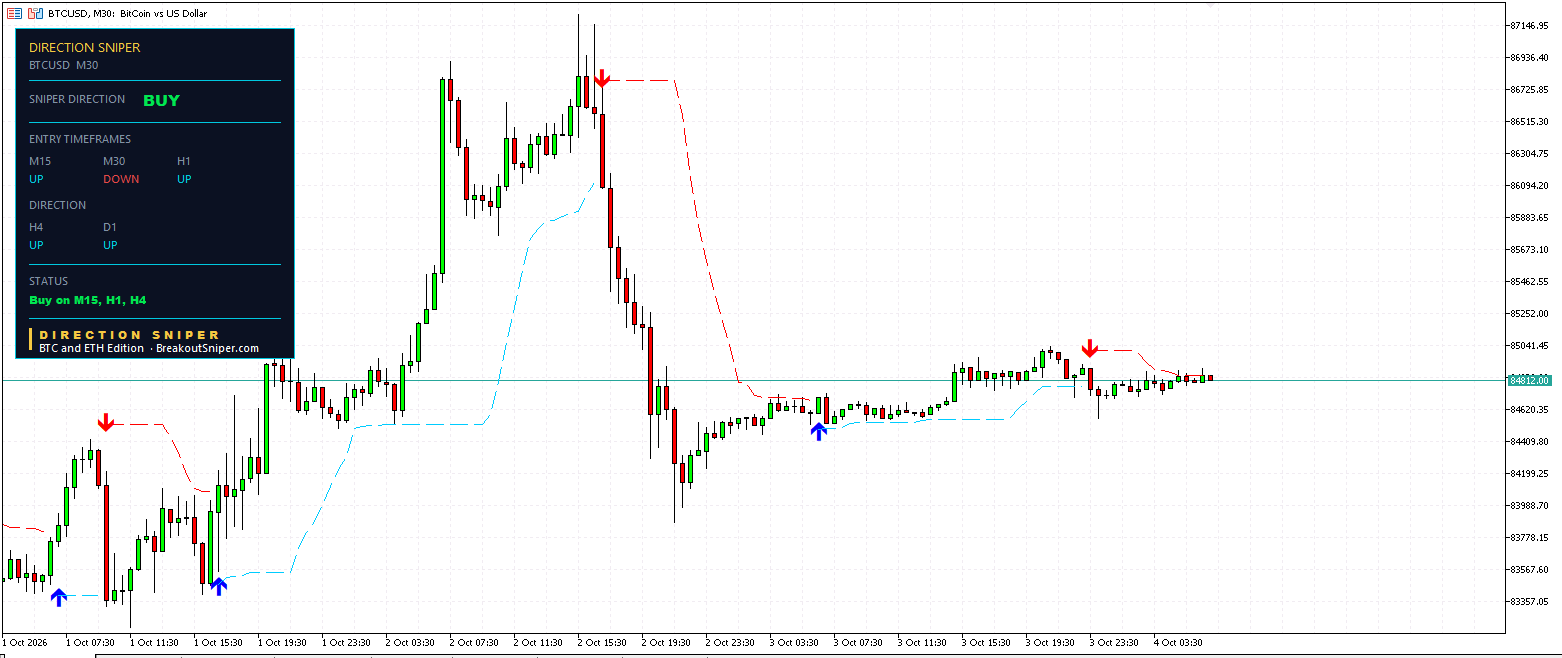
The thirty minute chart carries the BUY verdict like every other chart on the symbol. And it produced no ticket.
Not a sell. Not a warning. Not a disagreement with the four hour. The thirty minute simply had no qualifying entry at the moment the panel was read. Its own row is pointing the other way, so the conditions it requires to open a buy are not present yet. It is waiting for alignment.
Here is what that cost the trader today: nothing.
The M30 holding back did not cancel the H4 ticket. It did not invalidate the H1 ticket. It did not stop the M15 from opening. It was one chart with nothing to offer, out of four, and the other three carried on exactly as they should.
M15, the tightest entry on the board
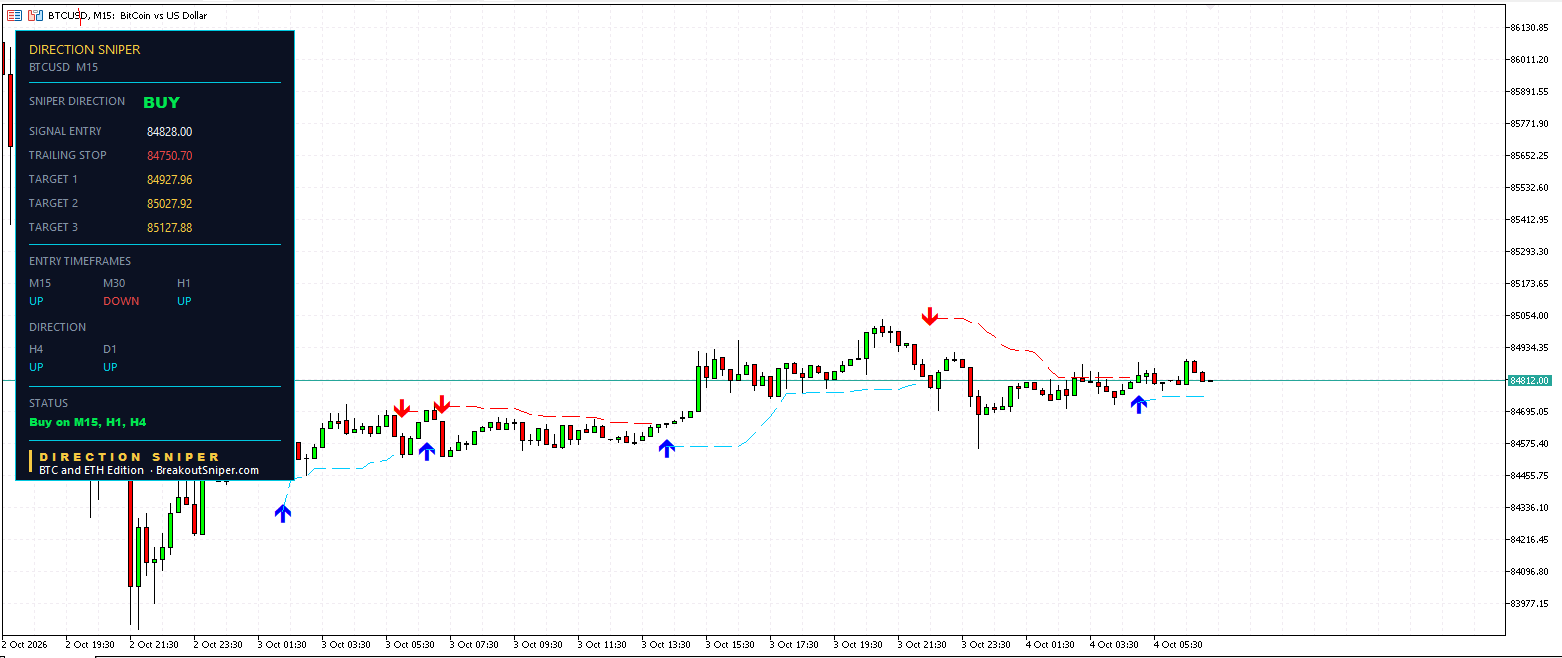
Entry at 84,828.00. Original stop at 84,728.04. Risk of 99.96. Target 1 at 84,927.96, then 85,027.92, then 85,127.88. Trailing stop now at 84,750.70.
Just under one hundred points of risk for the same BUY that the four hour is risking over two and a half thousand points to express. Price at 84,812.00 is sixteen points below entry, so this one is only just behind.
Bitcoin key levels to watch: the H4 trailing stop at 83,579.67 is the structural floor for the whole BUY idea. Above, the first meaningful shelf is the H1 Target 1 at 85,231.51, then the H4 Target 1 at 87,812.31.
Ethereum: Four Charts In Step
Ethereum is the clean version of the same picture, and it is sitting right next to Bitcoin today for a reason.
H4
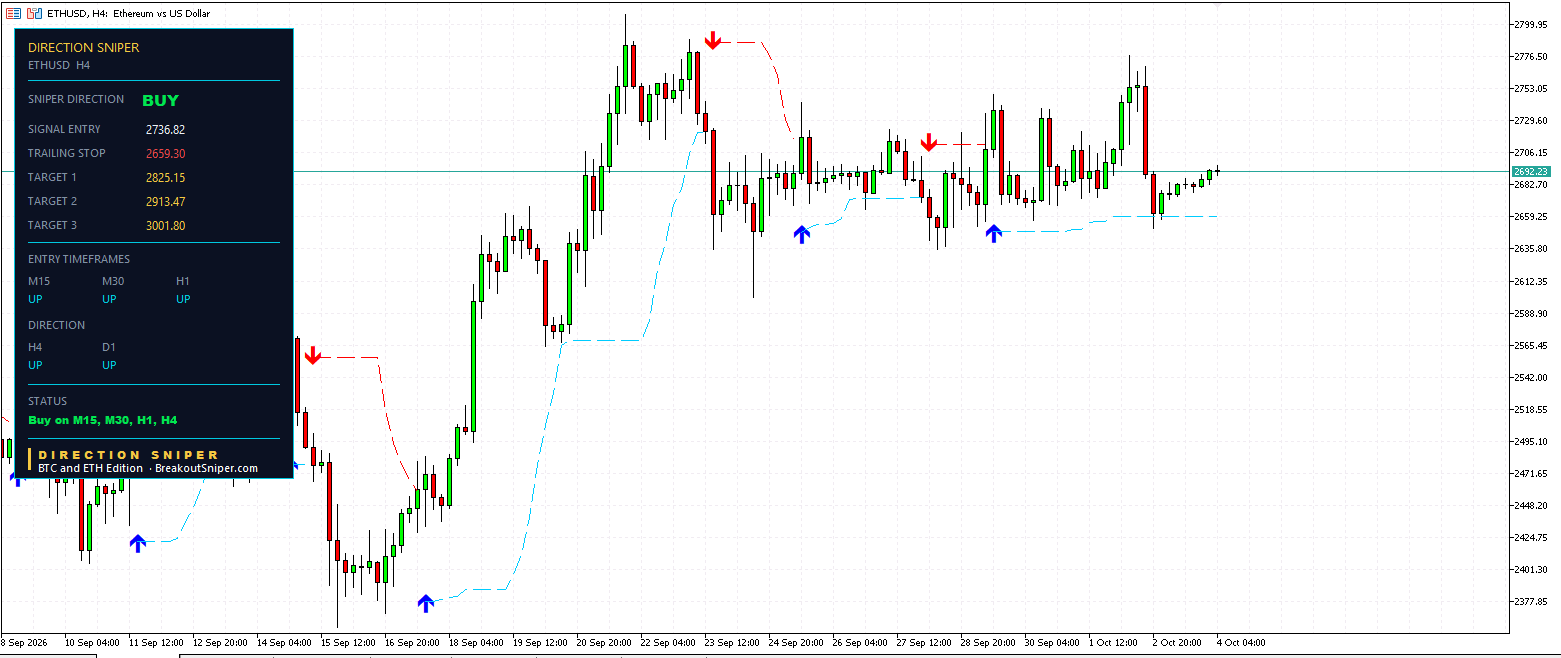
Entry at 2,736.82. Risk of 88.33. Targets at 2,825.15, 2,913.47 and 3,001.80. The trailing stop has lifted to 2,659.30.
Price at 2,692.23 is below entry. Like the Bitcoin four hour, this is the widest and slowest position on the symbol and it is currently behind.
H1
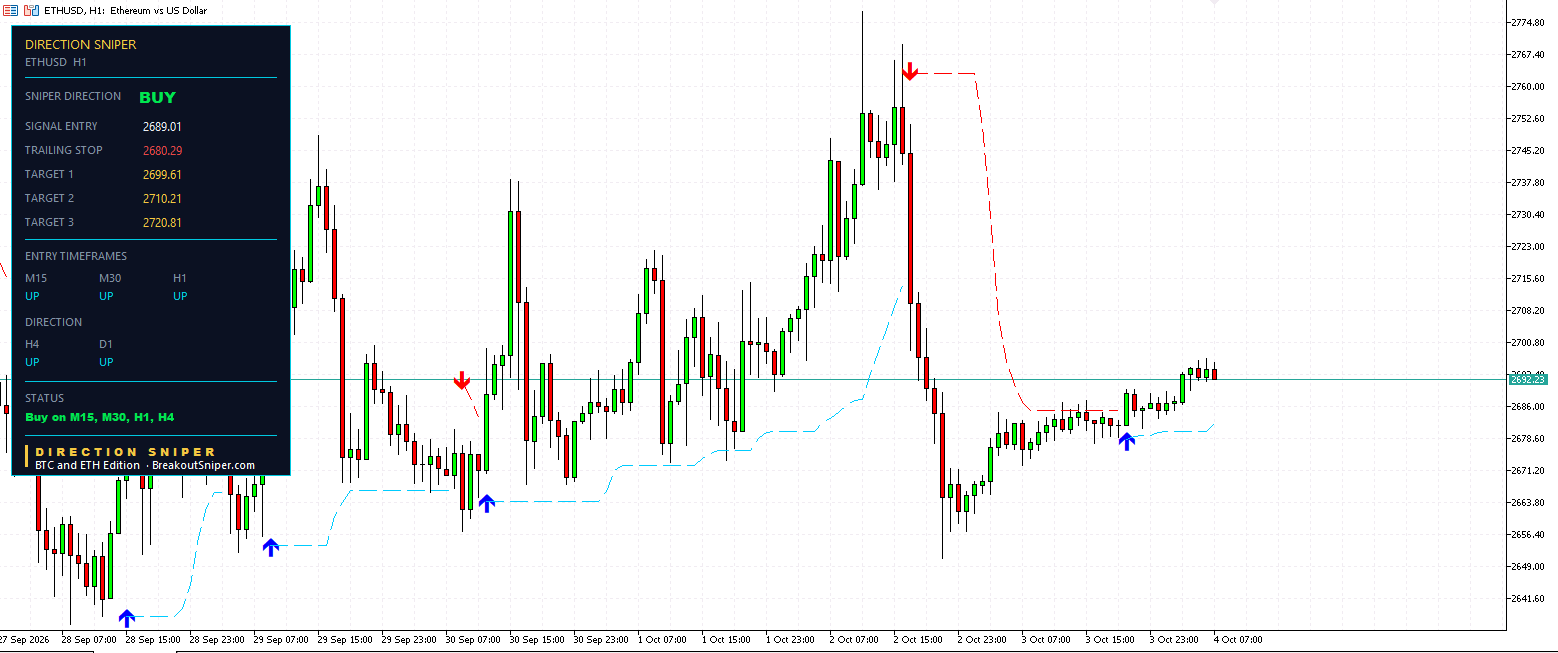
Entry at 2,689.01. Risk of 10.60. Targets at 2,699.61, 2,710.21 and 2,720.81. Trailing stop at 2,680.29.
Price at 2,692.23 is above entry. This one is in front.
M30
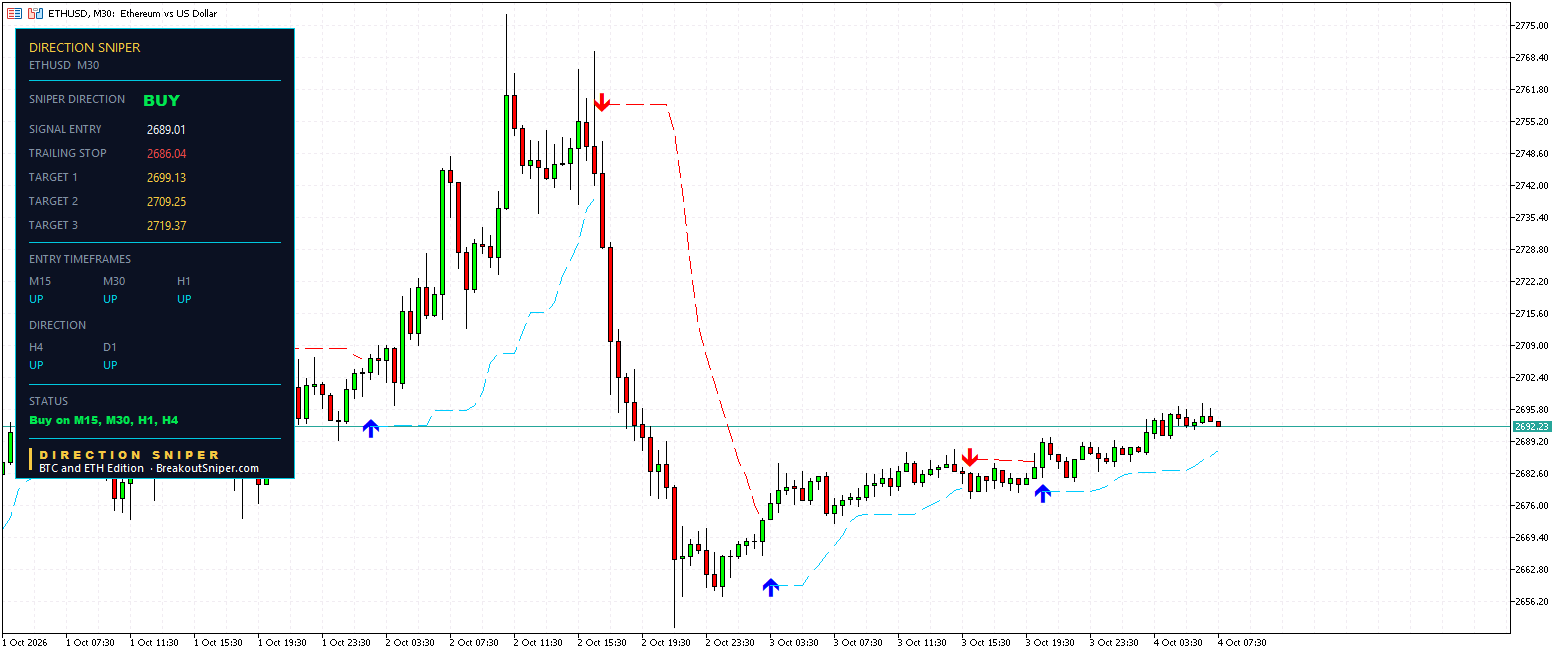
Entry at 2,689.01, the same price the one hour took. Risk of 10.12. Targets at 2,699.13, 2,709.25 and 2,719.37. Trailing stop at 2,686.04.
Two charts entered at the same number with almost identical risk. That is what genuine agreement looks like when it happens, and notice that it is a description of what occurred, not a requirement that had to be met first.
M15, the one that has already paid
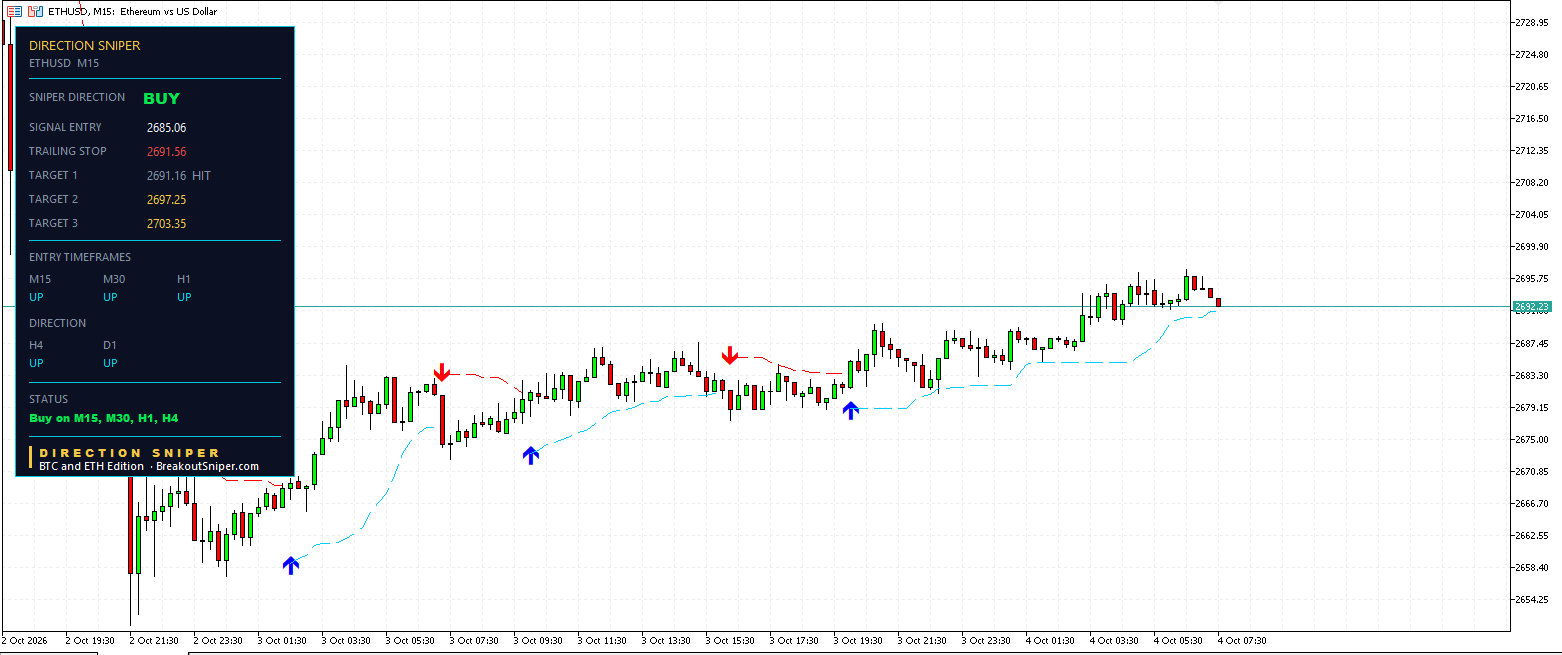
Entry at 2,685.06. Risk of 6.10, the smallest exposure on either market today. Target 1 at 2,691.16 has been reached.
And look at the stop. The trailing stop reads 2,691.56, which is above the entry price of 2,685.06. The level that started life below the trade as a stop loss has now been pulled past the entry. The trade can no longer give back more than it started with. The panel still calls it a trailing stop because that is what it is, but it is now protecting gain rather than limiting loss.
Six points of risk. First target reached. Stop above entry. That is the smallest ticket of the day doing the most finished work.
Ethereum key levels to watch: the H4 trailing stop at 2,659.30 holds the floor. Target 2 on the H1 at 2,710.21 is the next shelf of interest, then the H4 Target 1 at 2,825.15.
So Does Every Timeframe Need to Agree?
No. And today shows you why, with the two markets side by side as the comparison.
Ethereum had all four charts in step and produced four tickets. Bitcoin had one chart out of step and produced three. Both were correct. Both were trading the same verdict. The only difference was how many charts happened to be positioned to join at the moment the panel was read.
The two jobs are separate and they are not the same kind of decision.
The daily and four hour make one decision for the whole market: direction. That decision is binary and it is finished once it is made.
Each entry chart then makes its own much narrower decision: am I, on my own, positioned to take this entry right now? The Bitcoin M30 answered no. That answer applies to the M30 and to nothing else. It carries no authority over the M15, the H1 or the H4, because it was never answering their question.
Most traders invent a rule for themselves that every timeframe must line up before they act. It feels like discipline. It feels careful. In practice it means you only ever enter at the point of maximum agreement, and the point of maximum agreement is usually also the point of maximum extension, after the easiest part of the move has already happened. You end up paying for the comfort of unanimity with a worse price.
The working rule is simpler:
Take permission from above. Then take the entries from whichever charts are ready. The ones that are not ready will either catch up or they will not, and either way they cost you nothing by waiting.
That is the whole of it. The Bitcoin M30 sitting out today is not a flaw in the morning. It is the system telling you honestly that one of your four doors is not open yet, instead of pretending it is.
Where The Next Trades Are Likely To Come From
Both markets still have room to produce more tickets today, and the two obvious candidates are specific.
Bitcoin M30. This is the one to watch. The verdict is already BUY, which means the permission is in place and the only thing missing is the chart’s own entry condition. The moment that condition appears, a fourth Bitcoin ticket opens with a risk size that will sit somewhere between the M15’s 99.96 and the H1’s 343.50. Nothing has to change on the daily or four hour for this to happen. One chart just has to catch up.
Ethereum M15, again. It has reached Target 1 and its stop is above entry. If it continues toward Target 2 at 2,699.13 on the M30 and 2,699.61 on the H1, those two charts move into profit together and the whole Ethereum stack starts working in the same direction at the same time.
The two charts currently behind entry on both markets. The Bitcoin H4 at 85,290.32 and the Ethereum H4 at 2,736.82 are the slow positions. They are behind by design, because they entered on the widest structure. If price works back up through those entries, the biggest targets on the board come into play, and both have trailing stops that have already improved from where they started.
That is the honest state of play. Three things to watch, all of them described in terms of levels that are already printed on the chart, none of them a prediction about what price will do.
This Is What You Are Actually Buying
Everything above came from reading one panel on each chart. No drawing lines. No counting waves. No deciding whether the news was bullish. The panel told me the verdict, the entry, the stop, the risk and three targets, and it told me when one chart had nothing to offer instead of inventing a reason to trade.
That last part is the bit nobody sells you. Any tool can give you a signal. The useful ones tell you when they have nothing.
Direction Sniper puts that panel on your chart in MetaTrader and keeps it updated. You see the verdict from the gatekeeper charts, you see which entry charts have live tickets, you see the exact risk on each one and you see the targets placed at one, two and three times that risk. When a level starts trailing, the label changes so you know the trade has improved its own floor.
Two ways in, depending on what you trade:
Start at the bottom. The EURUSD Edition is $7. One pair, one license, the full panel. It exists so you can put it on a chart and decide for yourself whether reading the market this way suits you, without thinking about the money.
Go wide. The Forex Majors Edition and the 28 Pair Edition cover the pairs most people actually watch. The 28 Pair Edition at $77 works out to under three dollars a pair, which is the cheapest way into the full set.
If you want to see the same reading applied to a market where the two charts disagreed instead of agreed, read the AUD USD technical analysis page. It is the same structure producing an opposite answer, which is the fastest way to understand that the tool is reading rather than leaning.
Trading involves risk. The levels above describe where the indicator placed entries, stops and targets at the time the charts were read. They are not forecasts and they are not advice. Past readings do not indicate future results.

