Silver Forecast Today, 14 October 2026: Three Targets Reached, And The Stop Never Reached Break Even
Executive Summary
Silver forecast today: two tickets on the board are doing the exact opposite of each other, and most traders would assume one of them is broken.
| M30 | H1 | |
|---|---|---|
| Targets reached | All three | None |
| Trailing stop against entry | 0.056 above | 0.305 in front |
| Has it crossed break even? | No | Yes |
The thirty minute took every target it promised and its stop never once got past the entry.
The one hour has not touched a single target and its stop is already in front.
Silver is trading at 59.12, and the verdict is SELL with the daily and the four hour both pointing down.
| Chart | Direction | Where it stands |
|---|---|---|
| D1 | DOWN | sets the verdict |
| H4 | DOWN | sets the verdict. Fresh sell, nothing trailed |
| H1 | DOWN | running, no targets, stop has crossed |
| M30 | DOWN | all three targets reached, ticket complete |
| M15 | UP | no ticket, waiting |
Why we publish this. Every entry, stop and target below is a level the indicator printed on a live chart, at the moment it printed, before price did anything about it. Nothing is back tested. Nothing is chosen after the fact. We publish the tickets that worked and the ones that did not, because a page that only shows you the winners teaches you nothing you can use. The point is to show how the panel is read and how position size follows from a stop. These are not trade recommendations and nothing here is financial advice.
Price reaching a published target level is not the same as a realised result. A target shown as reached means price touched that level on the chart. It does not describe anyone’s trade, because that depends on whether a position existed, at what size, and what was done at each level.
1. The Thirty Minute Took Everything And Its Stop Barely Moved
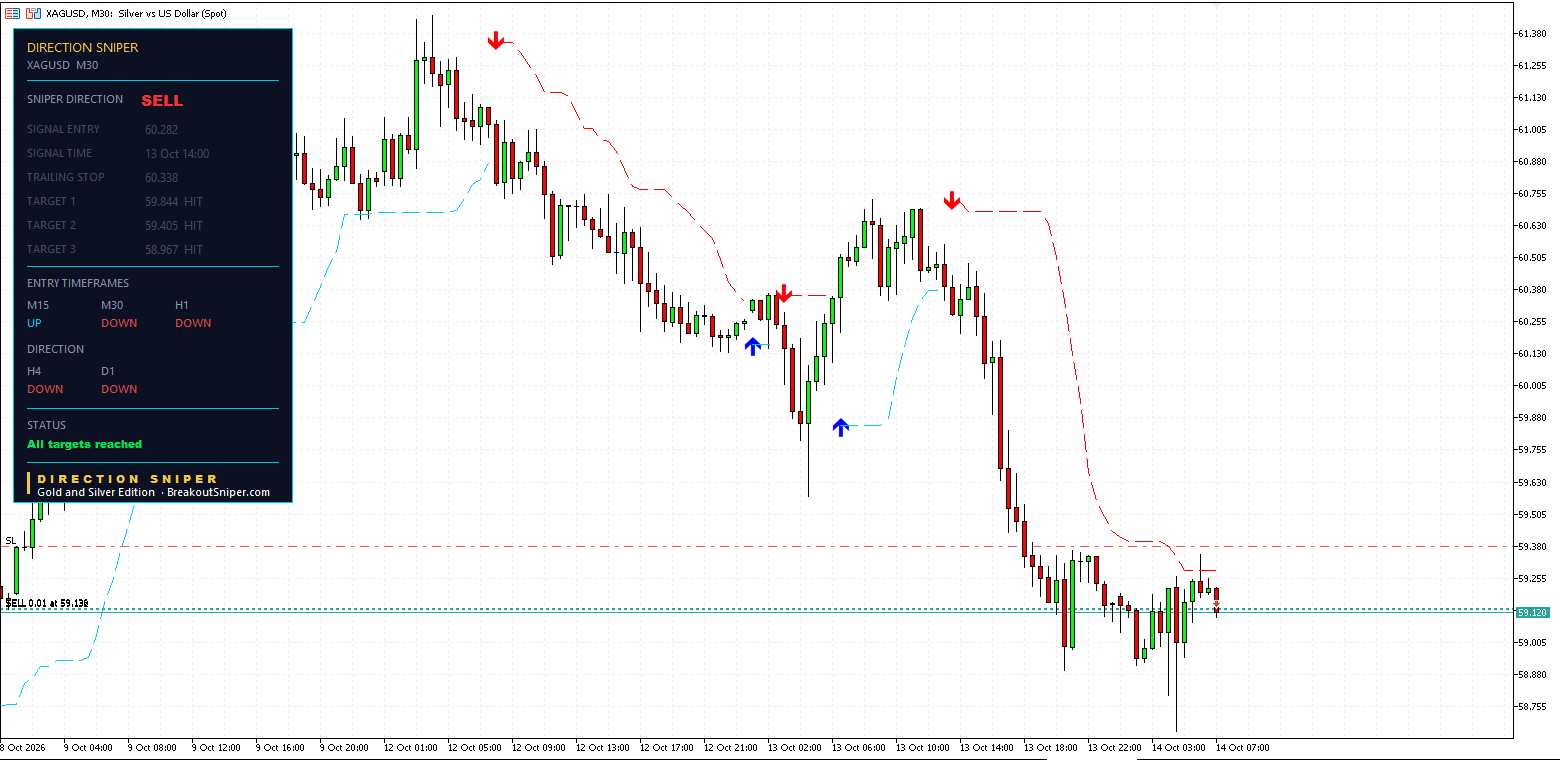
| Level | |
|---|---|
| Entry, sell | 60.282 |
| Original stop | 60.720, so 0.438 of risk |
| Target 1 at 59.844 | reached |
| Target 2 at 59.405 | reached |
| Target 3 at 58.967 | reached |
| Trailing stop, frozen | 60.338 |
| Status | All targets reached |
The arithmetic reconstructs. One unit of risk is 0.438, measured entry to stop, and the three targets sit one, two and three units away.
Now look at where that stop finished. 60.338, against an entry of 60.282.
It is 0.056 above the entry. On a sell, that means it never crossed. It travelled 0.382 of its 0.438, which is 87% of the way, and stopped there.
So this ticket completed its entire plan while its stop was still, technically, a losing level.
If price had come back and touched 60.338 at any point before target three, that position would have closed behind where it started. It did not, because price was busy running three units in the other direction.
2. The One Hour Is Doing The Exact Opposite
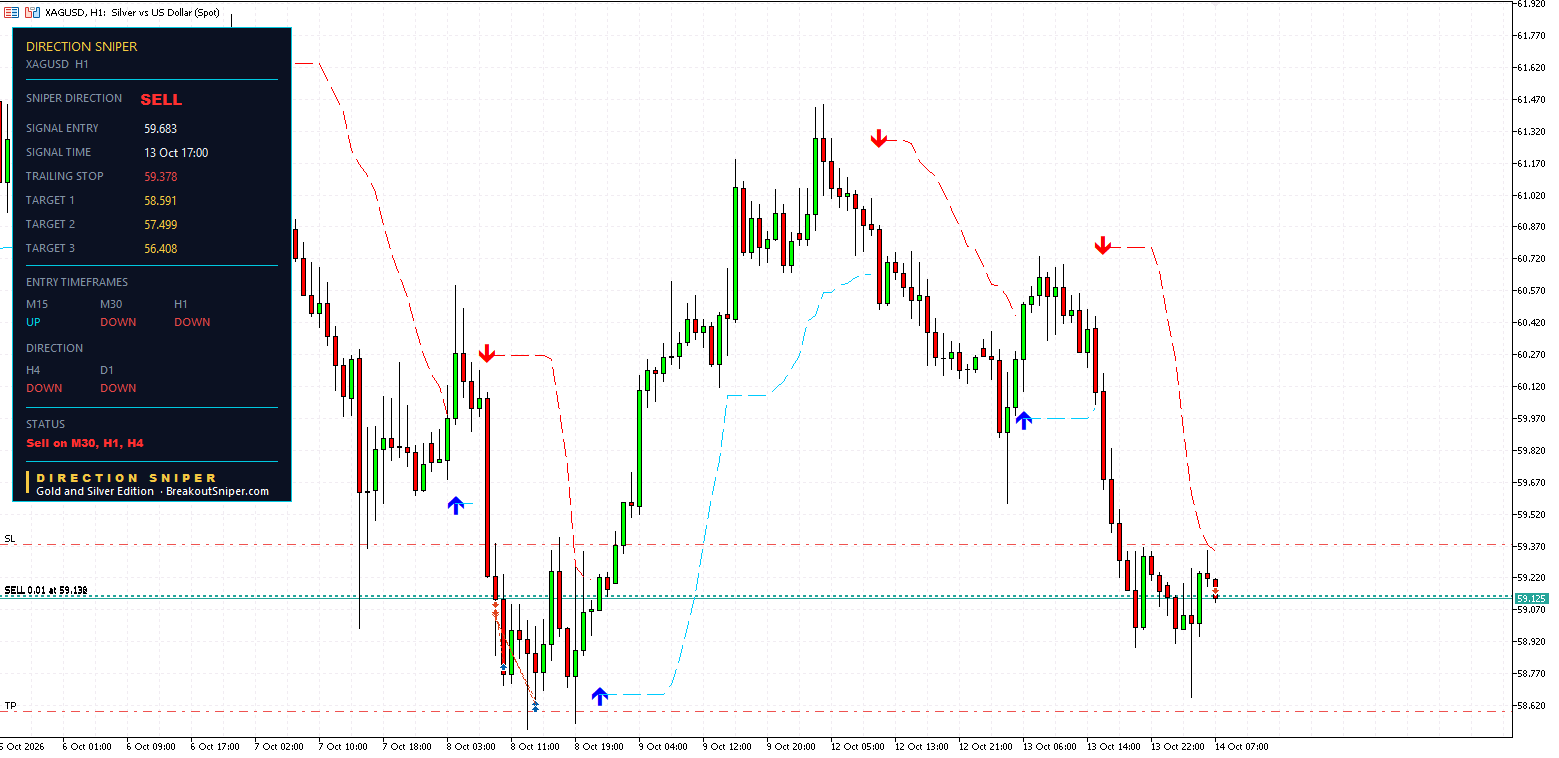
| Level | |
|---|---|
| Entry, sell | 59.683 |
| Original stop | 60.775, so 1.092 of risk |
| Target 1 | 58.591, not reached |
| Target 2 | 57.499, not reached |
| Target 3 | 56.408, not reached |
| Trailing stop, now | 59.378 |
Not one target touched. Price at 59.12 is 0.563 in front of the entry, which is just over half a unit, and target one is still 0.529 away.
And the stop is already at 59.378, which is 0.305 in front of the entry.
It started at 60.775 and has travelled 1.397, which is more than the entire original risk. It crossed break even a while ago.
So here are two tickets on one chart, at one moment, in perfect contradiction.
One has every target and a stop that never crossed. One has no targets and a stop that crossed easily.
3. This Is The Part Almost Nobody Knows
Most traders assume the targets and the trailing stop are both measuring the same thing, which is how well the trade is going.
They are not.
Targets measure distance. They are fixed at one, two and three times the risk the moment the ticket prints, and they never move again. Price either travels that far or it does not. Nothing else affects them.
The trail measures structure. It moves when the chart behind the trade tightens. How far price has travelled is not what it is watching.
Put those two facts next to this morning’s board and the contradiction disappears.
The thirty minute had a tiny 0.438 of risk. Price fell through all three targets quickly, because they were close together. In that same short stretch the thirty minute chart had barely built any new structure, so the trail had almost nothing to tighten against. Three targets, stop still above entry.
The one hour had 1.092 of risk, two and a half times as wide, so its targets are far away and price has reached none of them. But the one hour structure tightened hard, so the level walked past the entry without a single target being touched.
Same coin. Same minute. Two different questions, two different answers.
What the tool does for you here: both numbers sit on the same panel, side by side, with the entry between them. You do not have to work out which one is telling you what, because the label and the position relative to the entry do it for you.
We wrote the mechanism up in full in our guide to when to move your stop loss to break even.
4. The Four Hour Has Just Started
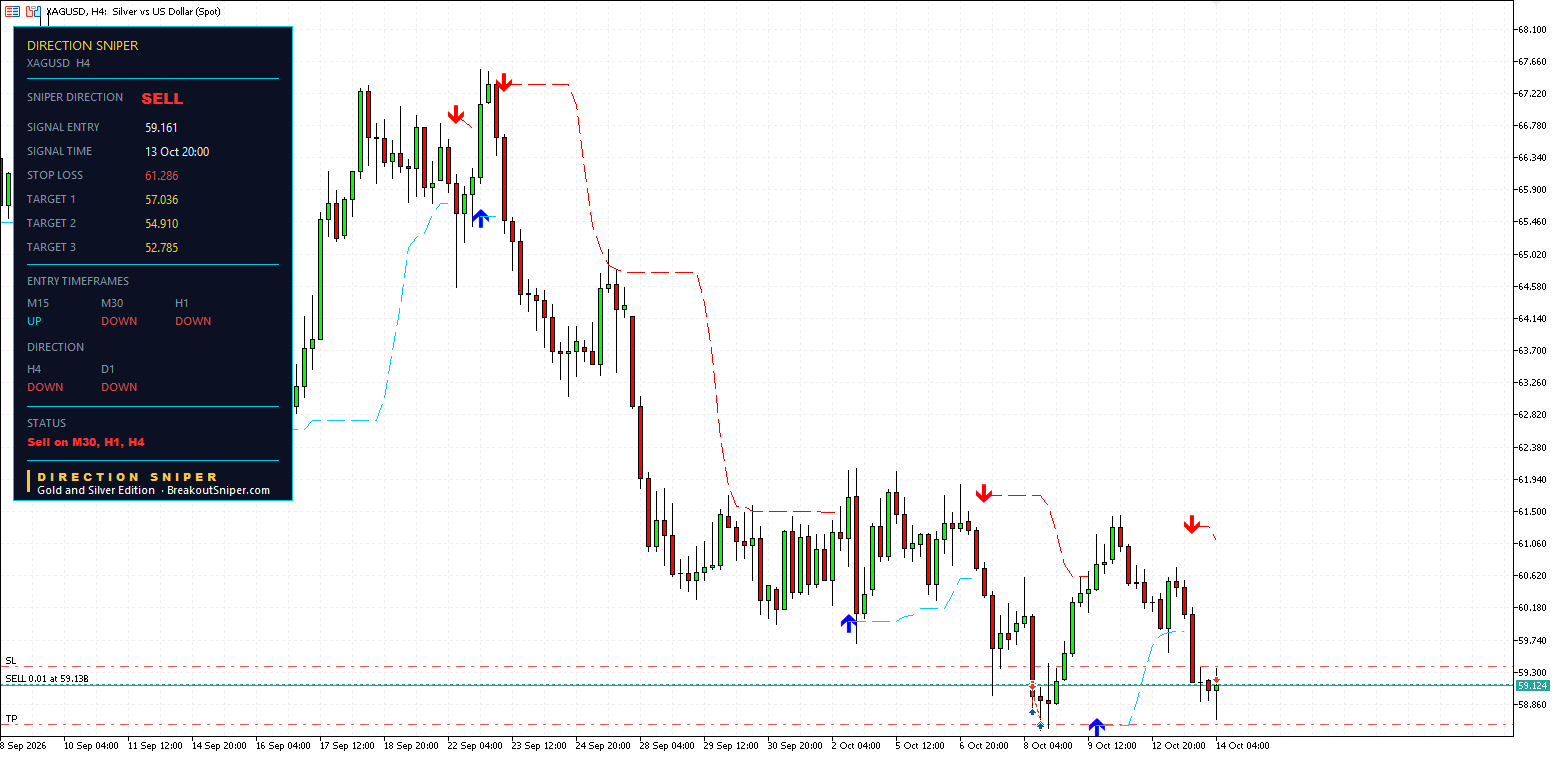
| Level | |
|---|---|
| Entry, sell | 59.161 |
| Stop loss | 61.286, so 2.125 of risk |
| Target 1 | 57.036 |
| Target 2 | 54.910 |
| Target 3 | 52.785 |
Price at 59.12 is 0.041 in front of the entry. That is under 2% of its risk, which is another way of saying nothing has happened yet.
And the label says it. STOP LOSS, not TRAILING STOP. The level is exactly where the signal put it, nothing has tightened, nothing is protected, and the full 2.125 is still on the table.
Three tickets, three completely different stages, all visible in one glance because the panel names the state rather than making you work it out.
5. And This Is Why You Might Not Be Able To Trade It
This is the section that matters most, and it has nothing to do with direction.
Silver is 5,000 ounces a lot. A one dollar move is worth $5,000 per lot. That makes the arithmetic brutal.
The calculation never changes. Your risk in money, divided by the stop distance, divided by what one point is worth per lot. On a ten thousand dollar account risking half a percent, which is fifty dollars:
| Ticket | Risk | Lot at $50 risk |
|---|---|---|
| M30 | 0.438 | about 0.023 |
| H1 | 1.092 | about 0.009 |
| H4 | 2.125 | about 0.005 |
Look at the four hour. 0.005 lots.
Most brokers will not let you trade below 0.01. So that ticket, on that account, at that risk, cannot be taken.
And here is what almost everyone does instead. They take 0.01 anyway, because it is the smallest the platform allows and it feels tiny.
0.01 lots on a 2.125 stop is $106.25. On a ten thousand dollar account that is 1.06% of risk, more than double the half percent they intended, on a trade they thought they were being careful with.
The stop did not just tell them where they were wrong. It told them this trade does not fit their account. That is information you can only act on if you do the arithmetic, and almost nobody does.
This Is What A Cent Account Is Actually For
Most traders think a cent account is a toy. It is not. It is the only way a small balance can size a position correctly instead of rounding up to whatever the platform will accept.
A cent account sizes in hundredths of a standard lot. So the 0.005 lots that four hour ticket needs becomes 0.5 lots on a cent account, which is fifty times the minimum rather than half of it.
| Standard account | Cent account | |
|---|---|---|
| Size you need | 0.005 | 0.5 |
| Broker minimum | 0.01 | 0.01 |
| Can you take it? | No | Yes, comfortably |
Read that table again. Nothing about the trade changed. The direction, the entry, the stop and the targets are identical. The only thing that changed is whether the account can hold the correct position size.
On a standard account you are forced to choose between skipping the trade or risking double what you planned. On a cent account there is no choice to make, because the right size is available.
For a small account, say anything under a few thousand dollars, this is the single biggest thing you can fix, and it costs nothing. We usually point people at a RoboForex Cent account or an XM Classic account, because the maths works there and it does not on a standard one.
We are an introducing broker for both, so we earn a commission if you open an account through those links. We recommend them because we use them, and the advice is the same whether you use our links or go direct.
The other two honest options are to trade a market whose stop fits the account you already have, or to wait for a tighter ticket on a faster chart. Both are better than rounding up.
What the tool does for you here: the stop arrives measured on every ticket, on every timeframe. That one number is the only input the calculation needs, and it is the difference between choosing a position size and discovering one.
6. The Fifteen Minute Has Nothing
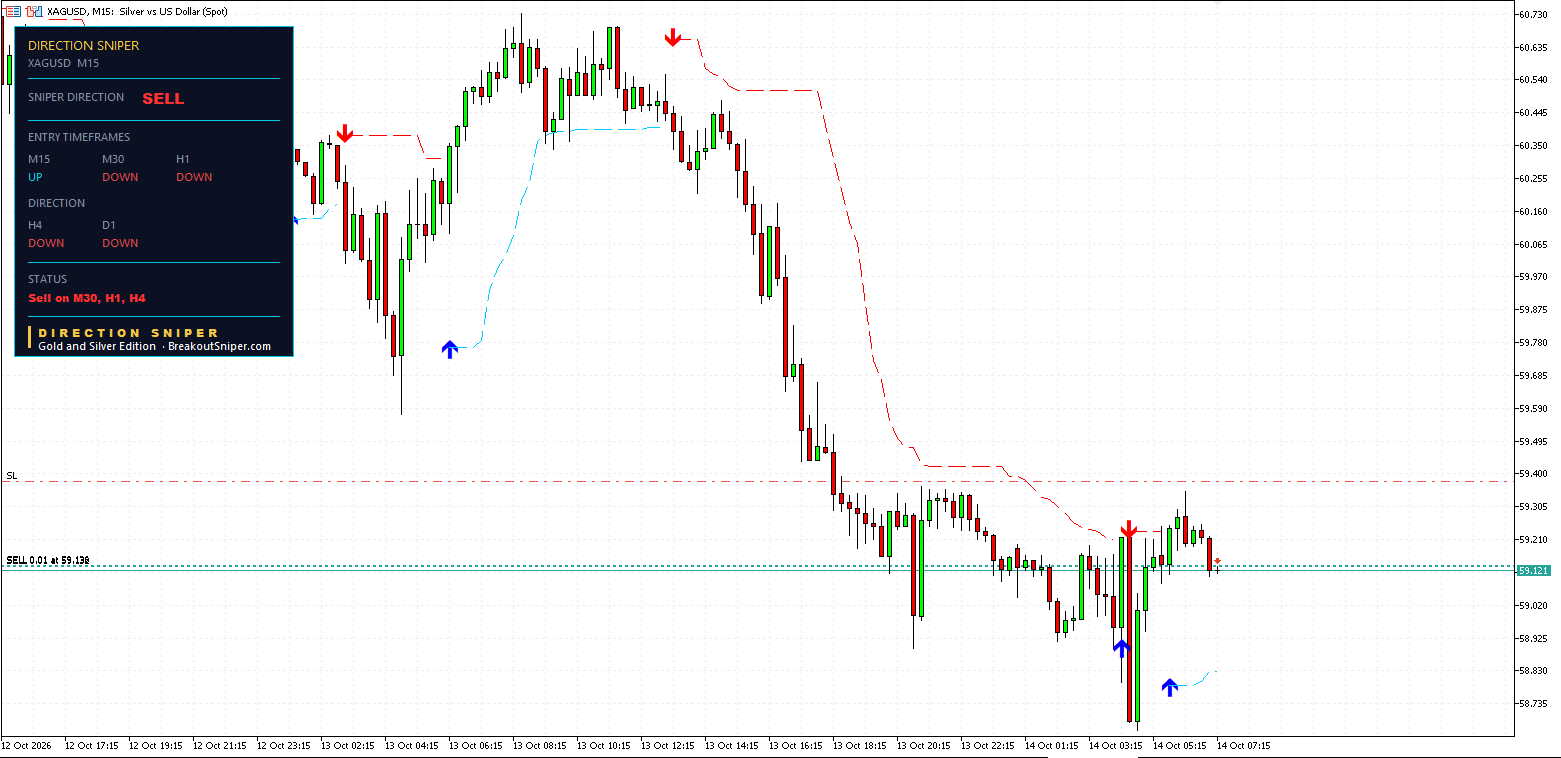
It is pointing up while the verdict is to sell, so it issues no entry, no stop and no targets. Its status line reads Sell on M30, H1, H4 and nothing else, which tells you where the setups are rather than inventing one here.
A tool that always has something for you is not reading the market. It is manufacturing a reason to press the button.
Where The Levels Sit Now
Here is the silver forecast today reduced to levels rather than opinions. With silver at 59.12:
59.378 is the live trailing stop on the one hour ticket, 0.258 above price, and already in front of that ticket’s entry.
58.591, 57.499 and 56.408 are its three unreached targets, sitting 0.529, 1.621 and 2.712 below price.
61.286 is the stop on the four hour ticket, 2.166 above price, unmoved from where the signal placed it.
57.036, 54.910 and 52.785 are the four hour targets.
60.338 is where the thirty minute ticket’s stop froze. That one is history, not a level to trade against.
Those are the levels on the chart and how far price sits from each. None of it is a forecast.
What You Are Actually Buying
A verdict that holds while the entry charts disagree about everything else. Daily down, four hour down. Underneath them, one ticket complete, one running, one brand new and one chart with nothing.
Two numbers that answer two different questions. The targets tell you how far price has to travel. The trailing level tells you what the structure behind the trade is doing. Confusing them is why traders close winners early and hold losers late.
A measured stop on every ticket, which is the only thing that can tell you a trade does not fit your account before you take it.
And a blank panel when a chart does not qualify.
These panels came from the Gold and Silver Edition. The same panel runs on these editions, all live now:
- Gold and Silver Edition, the original and still the one most of our traders start with
- 28 Pair Edition, $77, every major, minor and cross
- Forex Majors Edition, $47, the seven majors
- EURUSD Edition, $7, the cheapest way to put the panel on a chart and watch it work for yourself
Direction Sniper prints all of it on your charts in MetaTrader and keeps it live. You still move the order on your platform yourself. The indicator does the arithmetic, the click is yours.
One question. Have you ever worked out the lot size a trade needed and found the answer was smaller than your broker allows? Tell us on the reviews and feedback page.
A live sell order placed by us is visible on these charts at 59.138. We publish the charts as they are rather than cropping our own positions out of them.
Trading foreign exchange, precious metals and other leveraged products carries a high level of risk and is not suitable for everyone. The levels above describe where the indicator placed entries, stops and targets at the time the charts were read, and the status shown for each ticket is the status the panel displayed at that moment. Price reaching a published target level is not the same as a realised result. A target shown as reached means price touched that level on the chart, and does not describe anyone’s trade, which depends on whether a position existed, at what size, and what was done at each level. Two of the positions described above were still open when this was written. Distances between levels are arithmetic on published levels. A stop is a level rather than a guarantee, and gaps or fast markets can fill you past it. Trailing a stop reduces the worst case on a position but also closes positions that may later have moved further. Lot sizing figures are arithmetic for illustration and are not a recommendation about how much anyone should trade, and contract specifications vary between brokers, so check your own before applying any figure on this page. Nothing here is financial advice. Past performance does not guarantee future results.

