Ethereum Forecast Today, 13 October 2026: Four Timeframes, Four Different Answers On The Same Coin
Executive Summary
Four charts. One coin. One moment. Four completely different situations.
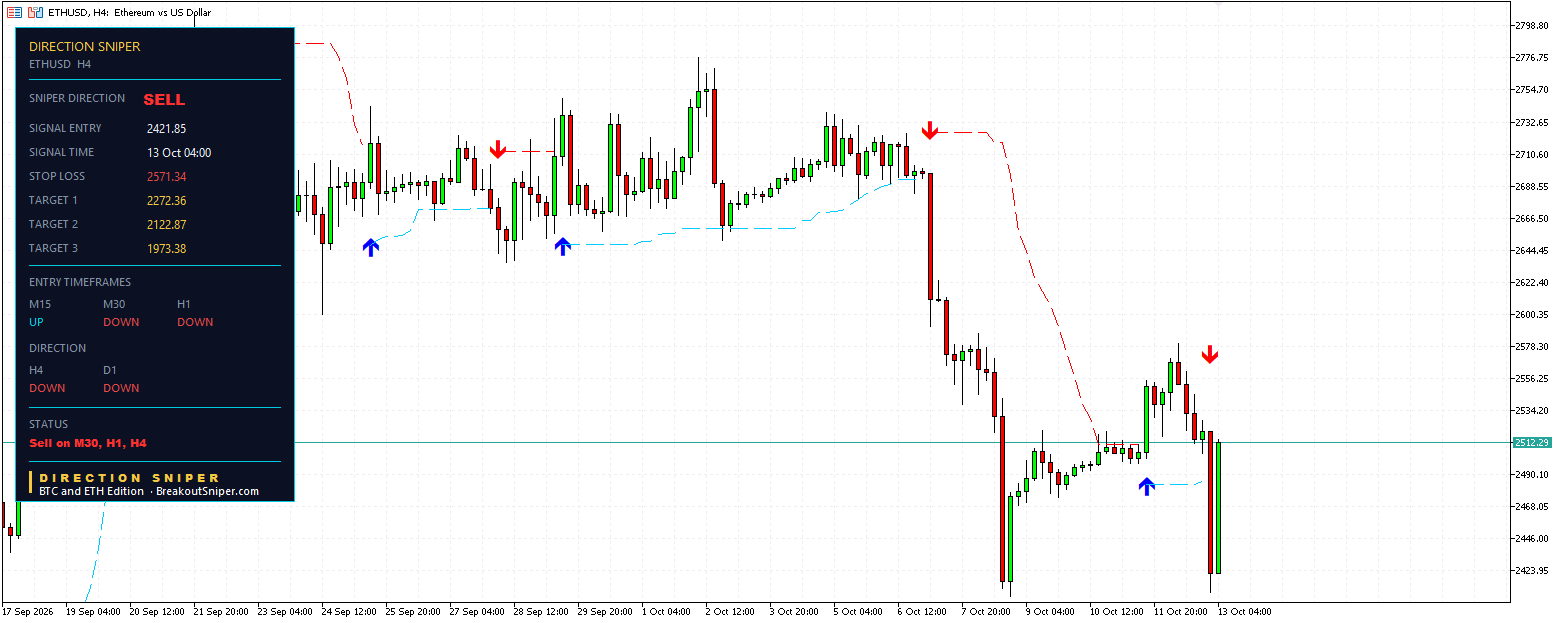
Ethereum is trading at 2511, and the verdict is SELL, with the daily and the four hour both pointing down.
Chart
Direction
Where it stands
D1
DOWN
sets the verdict
H4
DOWN
sets the verdict. Fresh sell, 59.6% of its risk spent
H1
DOWN
sell running, two of three targets reached
M30
DOWN
all three targets reached, ticket complete
M15
UP
no ticket, waiting
One finished. One running. One in trouble. One standing aside.
If you have ever wondered why two timeframes on the same chart seem to tell you opposite things, this page is that question with the numbers filled in.
Why we publish this. Every entry, stop and target below is a level the indicator printed on a live chart, at the moment it printed, before price did anything about it. Nothing is back tested. Nothing is chosen after the fact. We publish the tickets that worked and the ones that did not, because a page that only shows you the winners teaches you nothing you can use. The point is to show how the panel is read and how position size follows from a stop. These are not trade recommendations and nothing here is financial advice.
Price reaching a published target level is not the same as a realised result. A target shown as reached means price touched that level on the chart. It does not describe anyone’s trade, because that depends on whether a position existed, at what size, and what was done at each level.
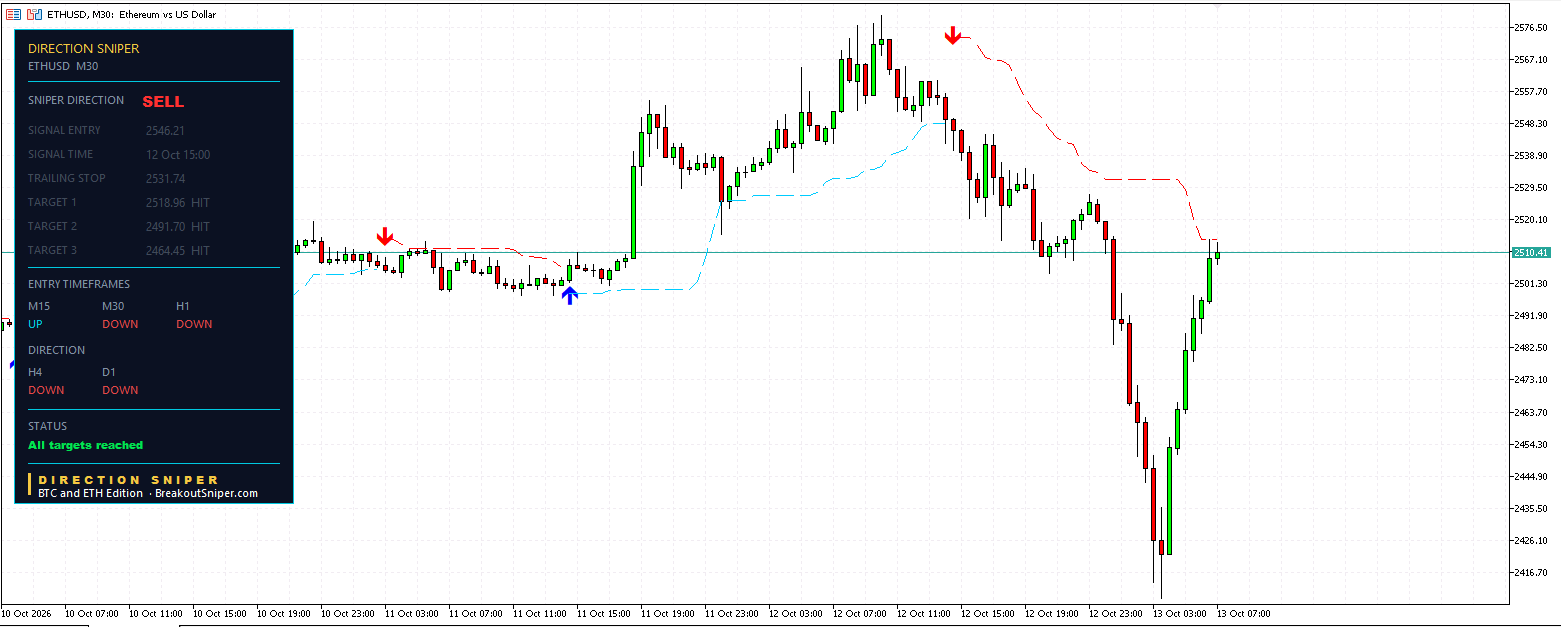
The arithmetic reconstructs exactly. One unit of risk is 27.25, measured entry to stop. Target one sits one unit away, target two sits two, target three sits three.
Taking the third completes the plan, so the indicator ends the ticket there rather than leaving a stop running with nothing left to protect. The numbers grey out, the stop freezes where it stood, and the status changes so a finished ticket can never be read as a live one.
Look at where that frozen stop sits. 2531.74, against an entry of 2546.21. On a sell that is 14.47 in front of where the trade began. It started 27.25 behind and travelled 41.72, crossing the entry on the way.
2. Yesterday Holding Would Have Been Better. Today It Would Not.
This is the part worth slowing down for, because we published the opposite answer twenty four hours ago and both answers were correct.
Yesterday, on EUR USD, a four hour ticket reached all three targets and price kept going, finishing 4.27 units past the entry against a plan that promised three. Holding would have been better. We said so.
Today, on Ethereum, the same mechanism, the other way round.
That thirty minute plan completed at three units. Price has since rebounded to 2511, which is 35.21 in front of the 2546.21 entry, or 1.29 units.
A position held past target three would be sitting on less than half of what the finished plan took.
Same tool. Same mechanism. Two days apart. Opposite answers.
That is not a flaw in having a plan. That is the entire argument for having one. Nobody can tell you in advance which kind of day today is, and anyone who claims they can does not need targets or a stop in the first place.
The plan finishes on a schedule decided before you were emotionally involved in the position. Some days that costs you. Some days it saves you. The only thing it does every single day is finish.
3. The One Hour Is Still Running, And It Is Not Safe Yet
Level
Entry, sell
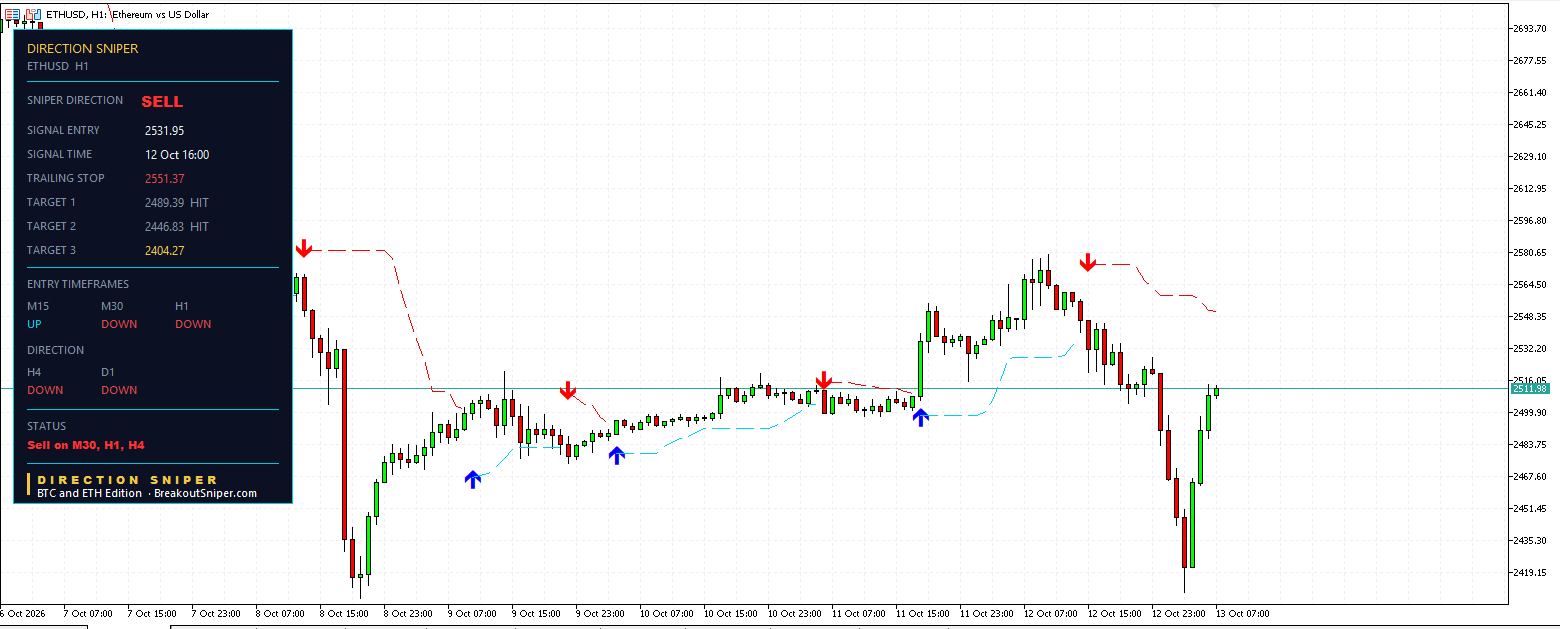
2531.95
Original stop
2574.51, so 42.56 of risk
Target 1 at 2489.39
reached
Target 2 at 2446.83
reached
Target 3
2404.27, not reached
Trailing stop, now
2551.37
Two targets reached, and here is the number almost nobody checks.
The trailing stop is at 2551.37. The entry was 2531.95. On a sell, that level is still 19.42 above the entry.
It has moved. It started at 2574.51 and has walked 23.14 in. The label on the panel has changed from STOP LOSS to TRAILING STOP to tell you that.
But it has not crossed the entry yet.
So if price came back up and touched it right now, that position would close 19.42 behind where it started, which is 0.46 of a unit, despite having reached two of its three targets along the way.
Two targets reached does not mean a position is safe. The only thing that makes it safe is the level crossing the entry, and on this ticket it has not happened.
Price at 2511 is 20.95 in front of the entry, or 0.49 of a unit. Target three at 2404.27 is another 106.73 below.
4. The Four Hour Is In Trouble, And We Are Going To Say So
Level
Entry, sell
2421.85
Stop loss
2571.34, so 149.49 of risk
Target 1
2272.36
Target 2
2122.87
Target 3
1973.38
Price is 2511. That entry was 2421.85.
The ticket is 89.15 behind, which is 59.6% of its risk spent, with 60.34 left before the stop.
Measured properly, that is the only number worth looking at. Divide the distance from your entry to the current price by the distance from your entry to your stop and you have the fraction of your own risk that has gone. It is the only figure that compares two different trades fairly.
And look at the label. It still reads STOP LOSS, not TRAILING STOP. Nothing has moved. That level is exactly where the signal placed it, because the trade has never been onside long enough for structure to tighten behind it.
That is a label doing its job. One glance and you know this position has given back nothing, protected nothing, and is six tenths of the way to being wrong.
Nothing about that is comfortable and we are not going to dress it up. It is on this page because the mornings where one chart finishes beautifully and another is bleeding are the normal ones, and a site that only publishes the first kind is not showing you how this works.
5. The Fifteen Minute Has Nothing At All
Ethereum fifteen minute panel pointing up with no ticket against the sell verdict
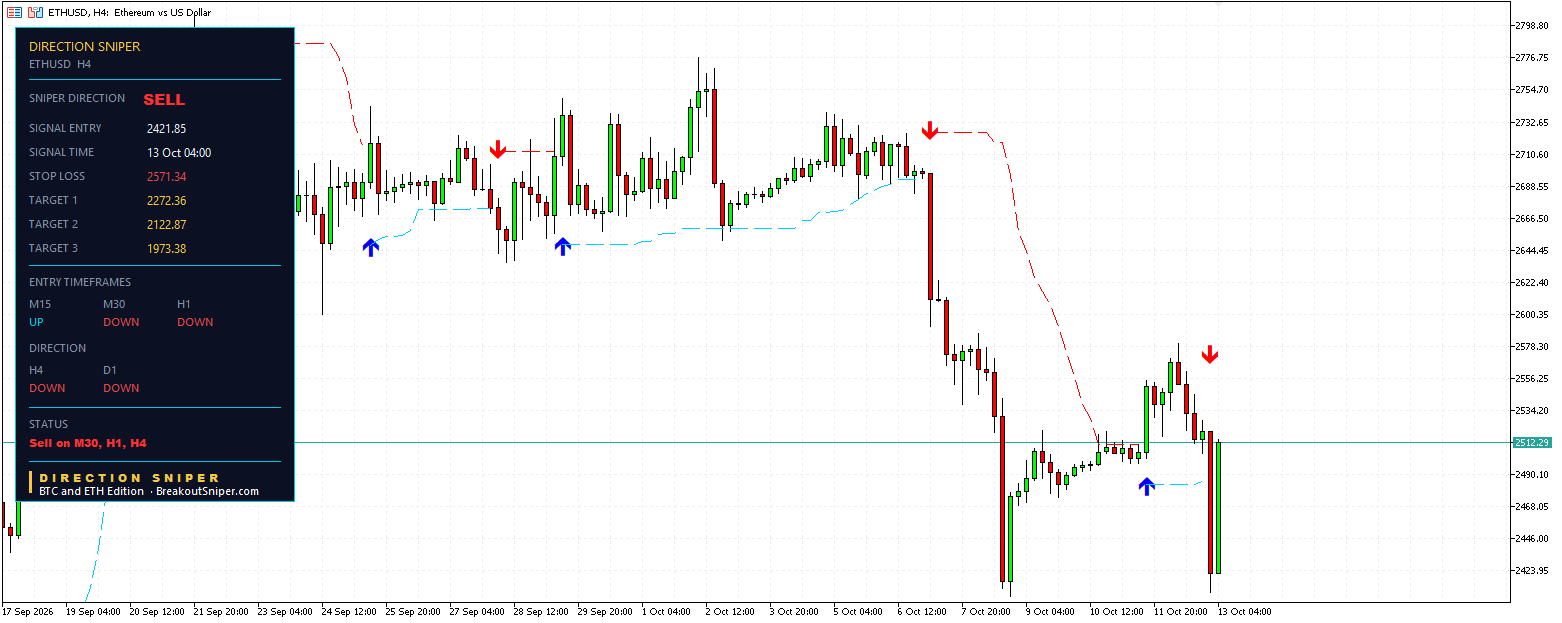
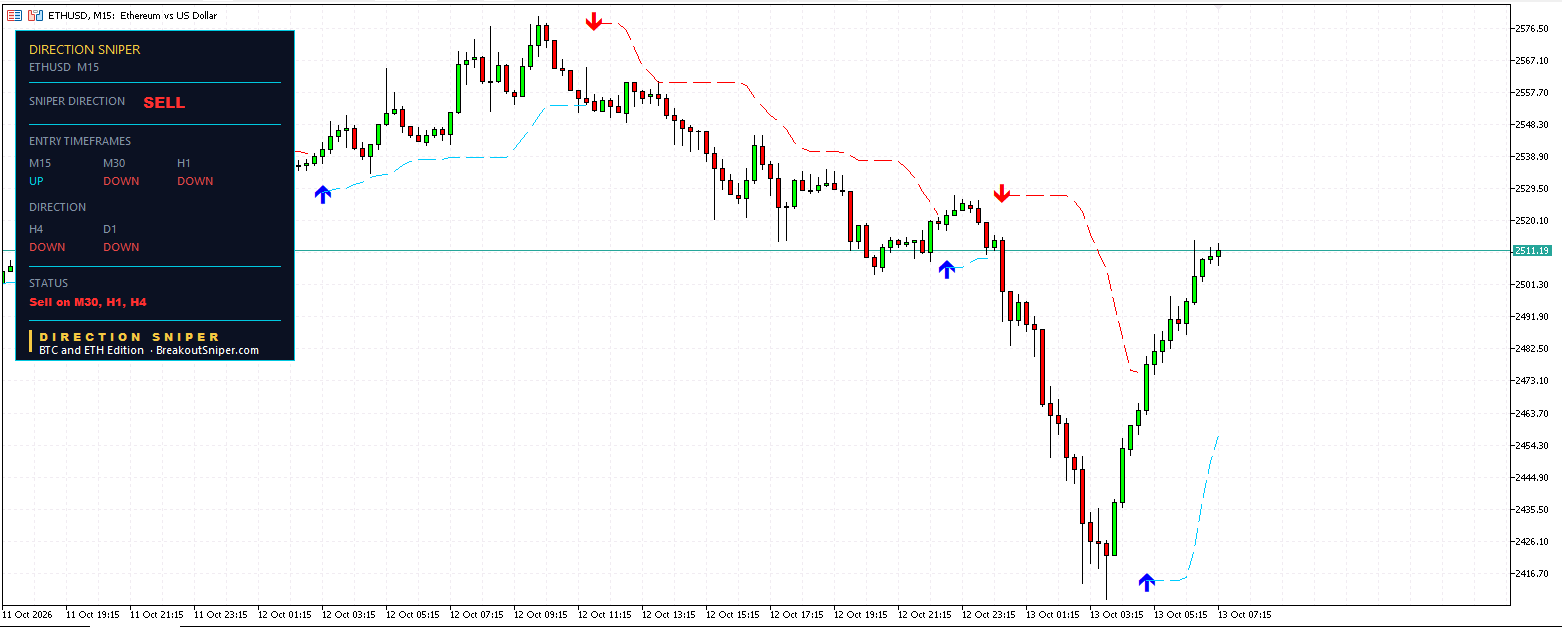
The fifteen minute is pointing up while the verdict is to sell.
So it issues no entry, no stop and no targets, and it waits. Its status line reads Sell on M30, H1, H4 and nothing else, which is the panel telling you where the setups are rather than inventing one here.
That is a feature and it is the one nobody advertises. A tool that always has something for you is not reading the market. It is manufacturing a reason to press the button.
6. So Why Do The Timeframes Disagree At All
This is the question underneath the whole page, and the answer is simpler than most traders expect.
They are measuring different things.
A thirty minute chart is reading structure built over hours. A four hour chart is reading structure built over days. When a market falls hard and then rebounds, the faster chart registers the rebound first, because the rebound is large relative to what it measures and small relative to what the slower chart measures.
So the thirty minute can complete a whole plan while the four hour is still in its opening move. Both are correct. They are answering different questions.
What the panel does is stop you confusing the two. The daily and the four hour decide the direction. The faster charts only decide where the entries are. A fast chart is never allowed to overrule the slow ones, which is why the verdict on this page is SELL on all five panels even though one of them has nothing to offer.
What the tool does for you here: all five readings sit on one panel, on whatever chart you have open. You do not have to flip between timeframes and hold four different states in your head, which is exactly the situation in which people talk themselves into a trade.
7. Where The Lot Size Comes From
Three tickets this morning with three very different stops, which makes the point better than any explanation.
Ticket
Risk
M30
27.25
H1
42.56
H4
149.49
The four hour stop is five and a half times the thirty minute stop. On the same coin. At the same time.
The calculation never changes. Your risk in money, divided by the stop distance, divided by what one point is worth per lot. On most brokers one lot of ETHUSD is one Ether, which makes a one dollar move worth one dollar per lot.
On a ten thousand dollar account risking half a percent, which is fifty dollars:
Ticket
Stop
Lot at $50 risk
M30
27.25
about 1.83
H1
42.56
about 1.17
H4
149.49
about 0.33
A trader using one fixed lot on all three would have risked five and a half times more on the four hour than on the thirty minute, without ever deciding to. That is how an account gets damaged by a market that was read correctly.
Check your own contract specification before you use any of those numbers. Crypto specifications vary far more between brokers than forex or gold does, and some quote a different contract size entirely. The method is identical everywhere. The inputs are not.
The lot size is the protection. The direction keeps you on the right side. The stop tells you where the idea failed. Neither of those decides what a bad morning costs you.
Where The Levels Sit Now
With Ethereum at 2511:
2551.37 is the live trailing stop on the one hour ticket, 40.37 above price, and still above that ticket’s entry.
2404.27 is that ticket’s third target, 106.73 below price.
2571.34 is the stop on the four hour ticket, 60.34 above price, unmoved from where the signal placed it.
2272.36, 2122.87 and 1973.38 are the four hour targets, sitting 238.64, 388.13 and 537.62 below price.
2531.74 is where the thirty minute ticket’s stop froze. That one is history, not a level to trade against.
Those are the levels on the chart and how far price sits from each. None of it is a forecast.
What You Are Actually Buying
A verdict that holds while the fast charts argue. The daily and the four hour both point down. One entry chart has finished a plan, one is running, one is behind, and one has nothing. The direction did not change once.
A measured stop on every single ticket. 27.25, 42.56 and 149.49 on one coin on one morning. You cannot eyeball that, and without it the position size is a guess.
A trailing level with an honest label. On the one hour it reads TRAILING STOP and sits above the entry, which tells you the position is not safe yet. On the four hour it still reads STOP LOSS, which tells you nothing has moved at all. One glance, two completely different situations.
And a blank panel when a chart does not qualify, which is the feature nobody puts on a sales page.
These panels came from the Bitcoin and Ethereum Edition. The same panel runs on these editions, all live now:
EURUSD Edition, $7, the cheapest way to put the panel on a chart and watch it work for yourself
Direction Sniper prints all of it on your charts in MetaTrader and keeps it live. You still move the order on your platform yourself. The indicator does the arithmetic, the click is yours.
One question. Have you ever closed a trade early because a faster chart changed your mind? Tell us on the reviews and feedback page.
Ethereum Today: Common Questions
Is Ethereum a buy or a sell today?
On 13 October 2026 the Direction Sniper panel reads SELL on Ethereum, because the daily and the four hour both point down. Three entry charts carry sell tickets, the thirty minute, the one hour and the four hour, and each of them is in a completely different state. The fifteen minute points up, so it has no ticket and waits for alignment. This describes what the indicator displays and is not a recommendation to trade.
Why do different timeframes give different signals on the same coin?
Because they measure structure over different lengths of time. A thirty minute chart reads structure built over hours, a four hour chart reads structure built over days. When a market falls hard and rebounds, the rebound is large relative to what the fast chart measures and small relative to the slow one, so the fast chart can complete an entire plan while the slow chart is still in its opening move. Both are correct. They are answering different questions.
What happened to the Ethereum thirty minute trade?
It reached all three targets and the plan completed. The ticket entered as a sell at 2546.21 with its stop at 2573.46, which is 27.25 of risk, and the three targets at 2518.96, 2491.70 and 2464.45 were all reached. Taking the third ends the ticket, so the numbers dim and the stop freezes where it stood, at 2531.74, which on a sell is 14.47 in front of the entry.
Would holding past the targets have been better?
Not on this one. The plan completed at three units of risk and price has since rebounded to 2511, which is 35.21 in front of the 2546.21 entry, or about 1.29 units. A position held past target three would be sitting on less than half of what the finished plan took. Yesterday on EUR USD the same mechanism gave the opposite answer, with price running to 4.27 units against a three unit plan. Nobody can tell in advance which kind of day it is, which is the argument for having a plan rather than against it.
Is a trade safe once two targets have been reached?
No, and the one hour ticket this morning shows why. It entered at 2531.95 and has reached two of its three targets, but its trailing stop sits at 2551.37, which is still 19.42 above the entry. If price came back and touched that level the position would close behind where it started, about 0.46 of a unit, despite two targets along the way. What makes a position safe is the level crossing the entry, not how many targets have been touched.
What does it mean when the label still says STOP LOSS instead of TRAILING STOP?
It means the level has not moved from where the signal placed it. The label only changes once the level leaves its starting point. The four hour ticket this morning still reads STOP LOSS, which tells you at a glance that nothing has trailed, the position has protected nothing, and the full original risk of 149.49 is still on the table. Direction Sniper displays and renames the level. Moving the order on your platform is still yours to do.
What are the Ethereum key levels today?
With price at 2511, the live one hour trailing stop is 2551.37 and its unreached third target is 2404.27. The four hour ticket carries its stop at 2571.34 and three targets at 2272.36, 2122.87 and 1973.38. The thirty minute ticket is finished and its frozen stop at 2531.74 is history rather than a level to trade against. These describe where the indicator placed levels rather than forecasting what price will do.
What lot size should you use on Ethereum?
Your risk in money divided by the stop distance, divided by what one point is worth per lot. On most brokers one lot of ETHUSD is one Ether, so a one dollar move is worth one dollar per lot. Today shows why it matters: the three tickets carry stops of 27.25, 42.56 and 149.49 on the same coin at the same time, so on a ten thousand dollar account risking half a percent that is roughly 1.83, 1.17 and 0.33 lots. One fixed lot on all three would risk five and a half times more on one than another. Cryptocurrency contract specifications vary widely between brokers, so check your own first.
Trading cryptocurrencies, foreign exchange and other leveraged products carries a high level of risk and is not suitable for everyone. The levels above describe where the indicator placed entries, stops and targets at the time the charts were read, and the status shown for each ticket is the status the panel displayed at that moment. Price reaching a published target level is not the same as a realised result. A target shown as reached means price touched that level on the chart, and does not describe anyone’s trade, which depends on whether a position existed, at what size, and what was done at each level. Two of the positions described above were still open when this was written. Distances between levels are arithmetic on published levels. Figures describing what a closed position would have done if it had been held are hypothetical. A stop is a level rather than a guarantee, and gaps or fast markets can fill you past it, which applies with particular force to cryptocurrency outside normal market hours. Trailing a stop reduces the worst case on a position but also closes positions that may later have moved further. Lot sizing figures are arithmetic for illustration and are not a recommendation about how much anyone should trade. Cryptocurrency contract specifications vary widely between brokers, so check your own before applying any figure on this page. Nothing here is financial advice. Past performance does not guarantee future results.
Gold and Silver Price Forecast Today, 22 October 2026: Stopped Out By A Spike? Six Targets Reached On The Very Next Tickets This gold and silver price forecast today is about the hour after a stop loss. Late on 21 October gold spiked to around 4145. In one move it closed three gold tickets. A
Gold and Silver Price Forecast Today, 20 October 2026: When Should You Move Your Stop Loss To Break Even? This gold and silver price forecast today starts with the question every trader asks the moment a trade goes their way: when should you move your stop to break even? Move it too early, and an
Bitcoin and Ethereum Price Forecast Today, 18 October 2026: The Bounce Is Back. Where Will The Next Sell Ticket Come From? This Bitcoin and Ethereum price forecast today starts with a result, because yesterday we made a call in public and today you can check it. Yesterday Bitcoin had rallied to almost 82,900 and every
Bitcoin and Ethereum Price Forecast Today, 17 October 2026: Bitcoin Bounce Or Reversal? How Direction Sniper Told The Difference Before Three Targets Were Reached This Bitcoin and Ethereum price forecast today answers the question every crypto trader asks at least once a week: is this a bounce, or is the market turning? On 15 October
Gold and Silver Price Forecast Today, 15 October 2026: Five Targets Reached In One Day, And Both Metals Still Pointing Down This gold and silver price forecast today covers one of the biggest days on the board in weeks. Across the two metals, five published targets were reached in a single session. Silver fell more
EUR USD Forecast Today, 14 October 2026: Every Chart Agreed, And The Fastest Ticket Still Closed At A Loss Executive Summary EUR USD forecast today: every row on every panel reads the same way, and one of the tickets on this board still closed at a loss. That is not a contradiction and it is
Silver Forecast Today, 14 October 2026: Three Targets Reached, And The Stop Never Reached Break Even Executive Summary Silver forecast today: two tickets on the board are doing the exact opposite of each other, and most traders would assume one of them is broken. M30 H1 Targets reached All three None Trailing stop against entry
Ethereum Forecast Today, 13 October 2026: Four Timeframes, Four Different Answers On The Same Coin Executive Summary Four charts. One coin. One moment. Four completely different situations. Ethereum is trading at 2511, and the verdict is SELL, with the daily and the four hour both pointing down. Chart Direction Where it stands D1 DOWN sets
EUR USD Forecast Today, 12 October 2026: All Three Targets Reached, And The Trailing Stop Was Still At Break Even Executive Summary The four hour EUR USD ticket that entered on 29 September has finished. All three targets reached. The panel dims the ticket, freezes the stop and says so. And here is the number
Stop Reading My Panel. Put it on Your Own Chart for $7
The same five timeframe verdict, entry map and full trade ticket you just read, live on your own EURUSD chart in MetaTrader 4 or MT5. One time payment, no subscription, no monthly fee.
Session expired
Please log in again.
The login page will open in a new tab. After logging in you can close it and return to this page.