AUD USD Forecast Today, 8 October 2026: The Trailing Stop Triggered. The Ticket Had Already Reached Two Targets.
Executive Summary
Every timeframe on AUD USD is pointing the same way. Daily down, four hour down, and all three entry charts down with them. Nothing is waiting.
AUD USD is trading at 0.69394.
| Chart | Entry | Signal time | Risk | Where it stands |
|---|---|---|---|---|
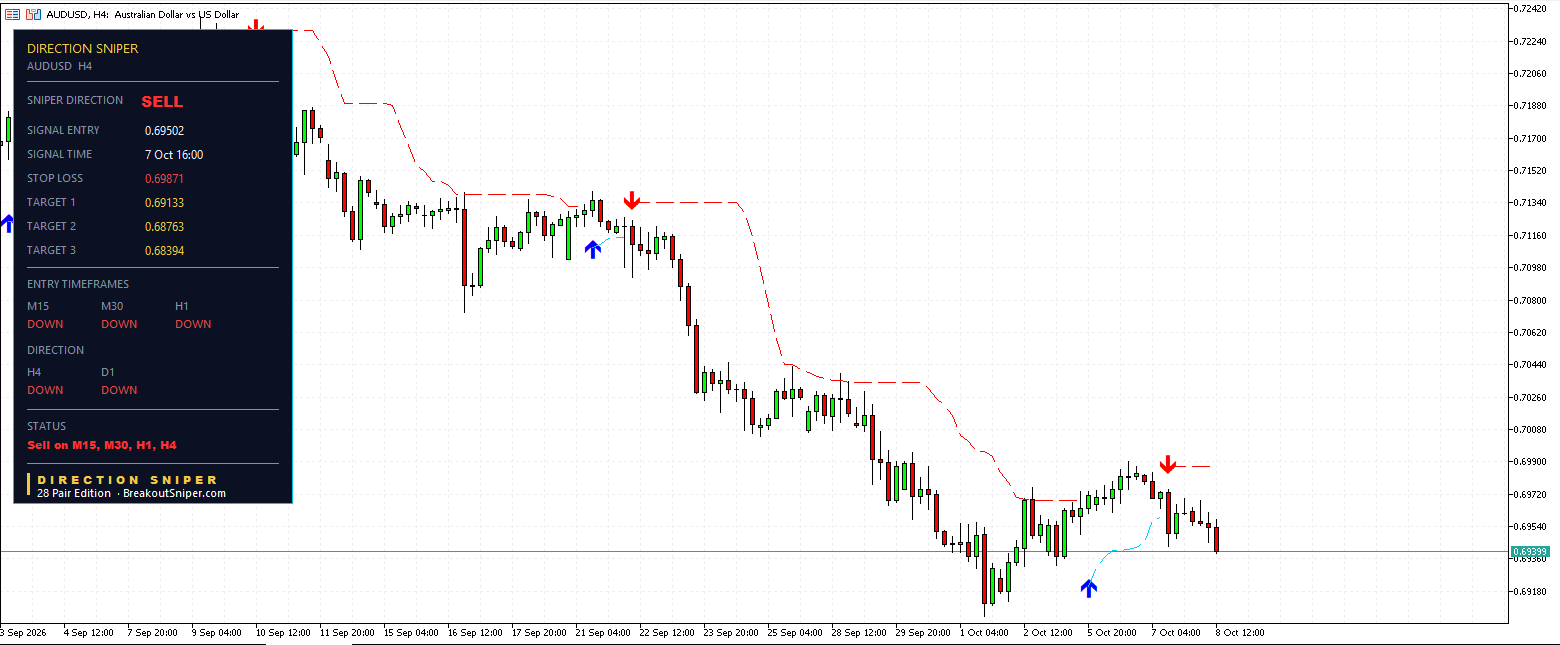
| H4 | 0.69502 | 7 Oct 16:00 | 36.9 pips | 10.8 pips ahead, 29% toward T1 |
| H1 | 0.69727 | 7 Oct 06:00 | 14.2 pips | T1 and T2 reached, closed at trailing stop 0.69673 |
| M30 | 0.69563 | 8 Oct 06:30 | 11.2 pips | T1 reached, still open, T2 is 5.6 pips away |
| M15 | 0.69465 | 8 Oct 13:45 | 13.7 pips | 7.1 pips ahead, 52% toward T1 |
Start with the one hour, because the word “closed” on that panel is the most misread thing in the whole display.
1. The Trailing Stop Triggered, And That Was The Good News
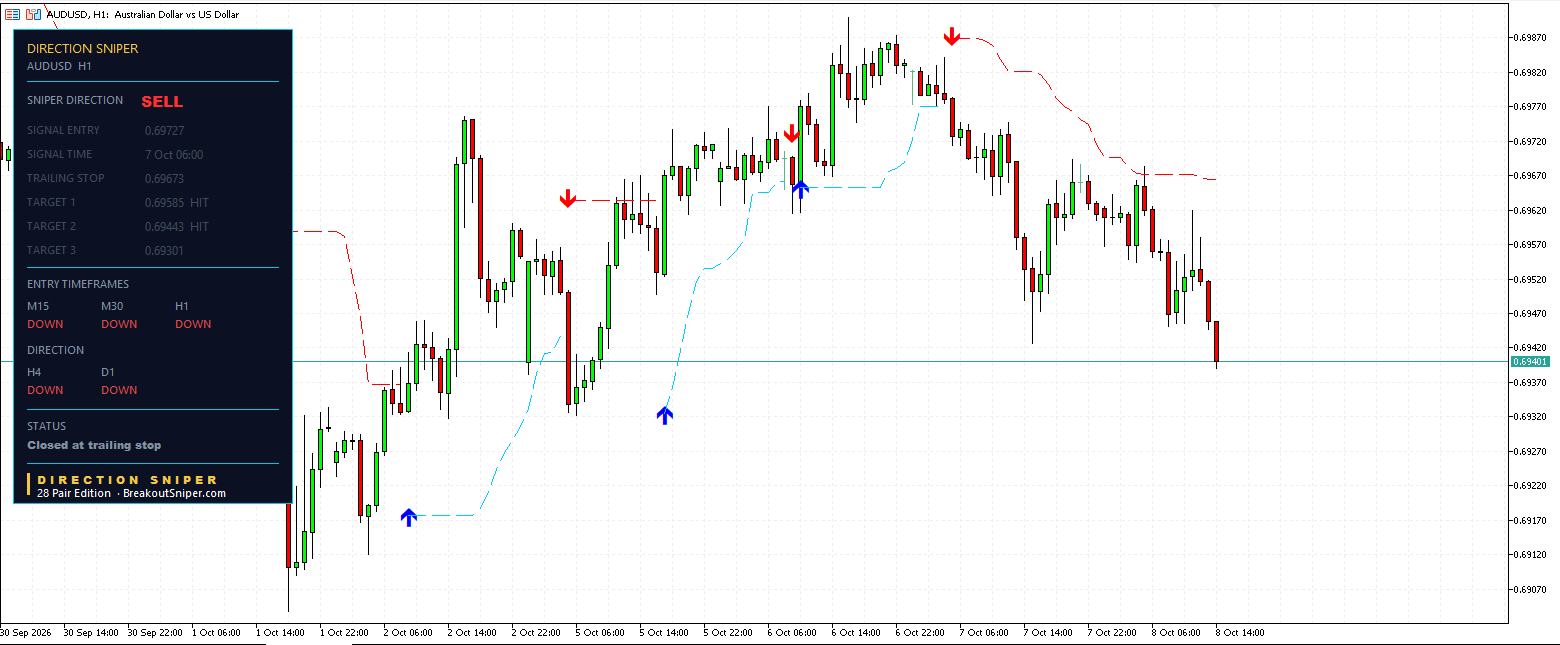
Here is the ticket in full.
Sell. Entry 0.69727 on 7 October at 06:00. Original stop 0.69869, which is 14.2 pips of risk.
Target 1 at 0.69585, reached. Target 2 at 0.69443, reached. Target 3 at 0.69301, not reached.
Closed at trailing stop 0.69673.
Now look at where that closing level sits.
The entry was 0.69727. It closed at 0.69673. On a sell, that is 5.4 pips below where it started.
The trailing stop did not cut this trade short. By the time it moved, it had already walked 19.6 pips down from its original 0.69869 and crossed under the entry price. From that moment onward it was no longer a device protecting you from a loss. It was a device protecting what the trade had already done.
That is what a trailing stop is for, and most traders only ever meet it in the other role.
What the tool does for you here: the level is recalculated as structure tightens, and the label changes from STOP LOSS to TRAILING STOP the moment it starts moving. You can watch it cross under your entry. What the indicator does not do is move the order on your platform, so that part is still yours, and a level you can see but have not acted on is still your original 14.2 pips.
2. So What Does “Closed At Trailing Stop” Actually Tell You
It tells you the position is finished. It tells you nothing at all about how it finished.
We published a post yesterday on GBP USD with exactly the same words on a panel, and the outcome was the opposite.
| AUD USD H1, today | GBP USD M15, yesterday | |
|---|---|---|
| Entry | 0.69727 | 1.32052 |
| Closed at | 0.69673 | 1.32094 |
| Relative to entry | 5.4 pips below | 4.2 pips above |
| Targets reached first | Two | Two |
Same status line. Same number of targets reached. One closed below its entry and one closed above it.
The question is never whether the trailing stop triggered. It is where the trailing level had got to before it did.
Once that level crosses your entry price, every further step it takes is locking in rather than limiting. Before it crosses, it is still limiting. Same mechanism, two completely different jobs, and the only way to know which one you are in is to look at the number rather than the word.
3. The One In The Middle, Right Now
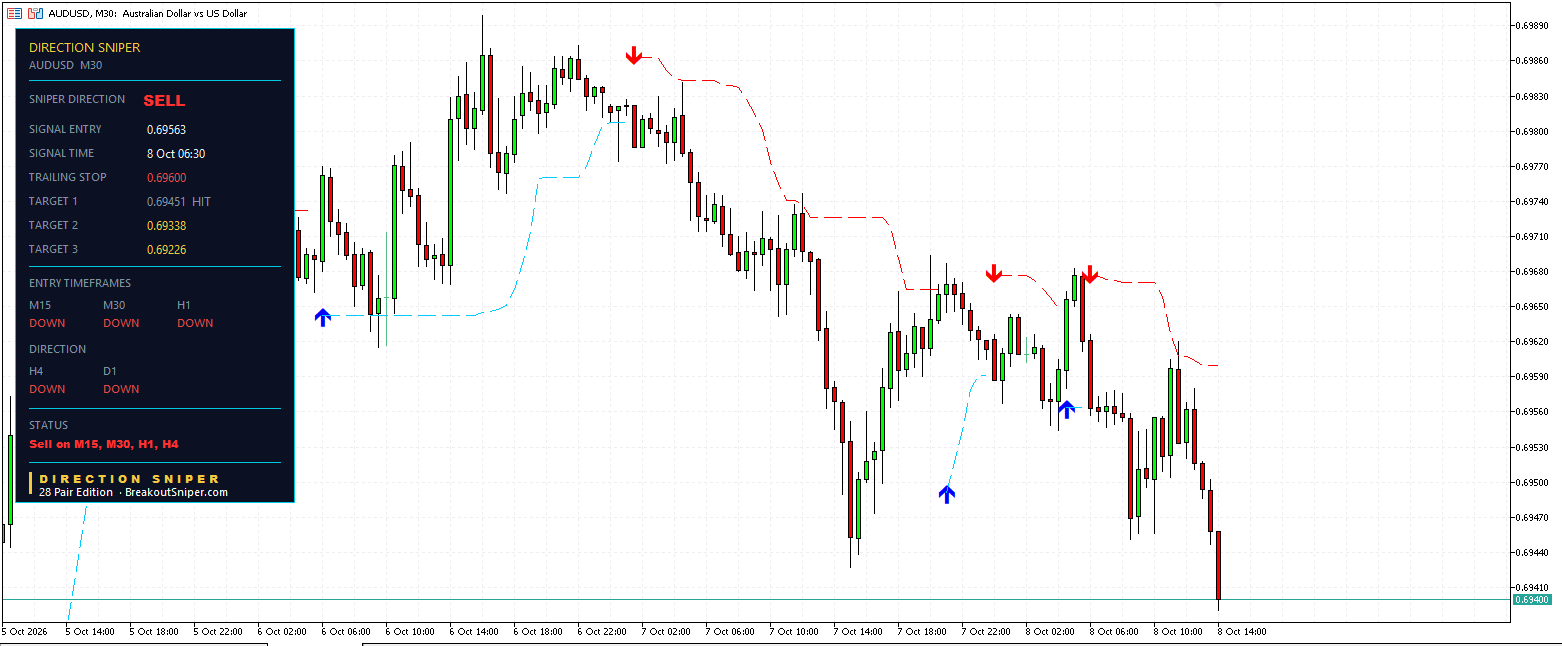
The thirty minute ticket is sitting in exactly that in between state this morning, which makes it the clearest example on the page.
Sell at 0.69563 at 06:30 today. Original stop 0.69675, which is 11.2 pips. Target 1 at 0.69451 reached. Trailing stop now 0.69600.
That level has walked 7.5 pips in from where it started. It is still 3.7 pips above the entry.
So the thirty minute has reached a target, has had its worst case cut by two thirds, and is still in the half of its life where the stop is protecting rather than banking. Price is 16.9 pips ahead of entry with Target 2 at 0.69338 only 5.6 pips away.
Put the two side by side and the whole mechanism is visible in one morning. The one hour started earlier, its level crossed under its entry, and it finished in front. The thirty minute started later, its level has not crossed yet, and it is still working.
4. The Part That Surprised Us
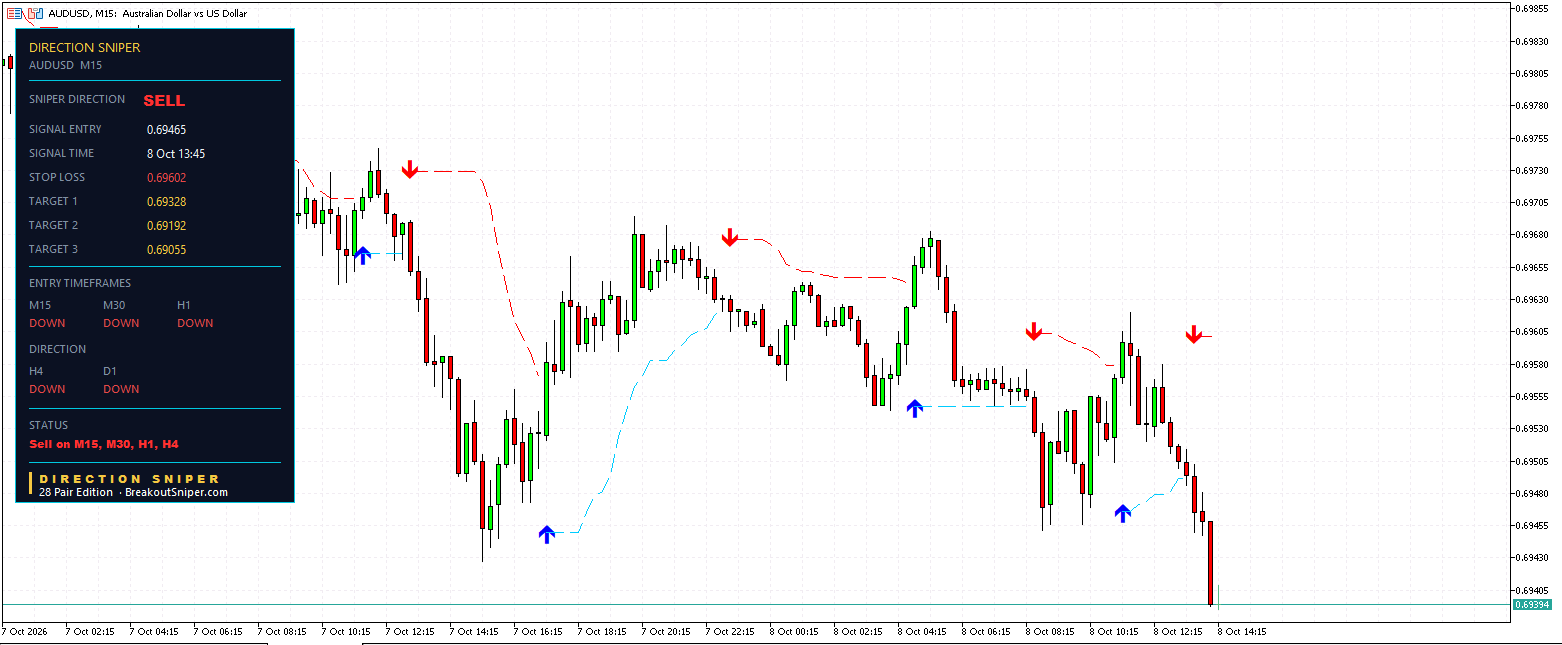
Everyone assumes stop distance follows the timeframe. Fifteen minute tightest, then thirty minute, then one hour, then four hour.
Here is today’s board, sorted by stop width.
| Chart | Risk |
|---|---|
| M30 | 11.2 pips |
| M15 | 13.7 pips |
| H1 | 14.2 pips |
| H4 | 36.9 pips |
The fifteen minute is not the tightest chart on the board. The thirty minute is, by 2.5 pips.
And the fifteen minute is within half a pip of the one hour, two steps up from it.
This is not a glitch. A stop sits beyond the structure the chart is measuring, and this afternoon the fifteen minute chart had a wider recent range to clear than the thirty minute did. The ordering follows the market, not the clock.
Yesterday on GBP USD the order was the one everybody expects, 8.4 pips on the fifteen minute against 12.3 on the thirty. Today on the Australian dollar it is reversed. Two consecutive days, two different orderings, same indicator.
Which is the entire argument for reading the number instead of assuming it. A trader who sizes by timeframe habit would have put the larger position on the fifteen minute today and been wrong by a third.
5. What That Does To Your Lot Size
The stop distance is the only input, so when the ordering changes, the position sizes change with it.
On a ten thousand dollar account risking half a percent, which is fifty dollars, at ten dollars per pip per standard lot:
| Chart | Risk | Lot size | Money at risk |
|---|---|---|---|
| M30 | 11.2 pips | 0.44 | $49.28 |
| M15 | 13.7 pips | 0.36 | $49.32 |
| H1 | 14.2 pips | 0.35 | $49.70 |
| H4 | 36.9 pips | 0.13 | $47.97 |
The thirty minute funds the biggest position today. Not the fifteen minute. That is the opposite of what the habit says, and it is a 22 percent difference in size between the two shortest charts.
Nobody can guess their way to that. It is a reading, taken fresh, every time.
The stop distance decides the lot size. The lot size decides what a wrong trade costs you. Everything else on the page is detail compared with those two sentences.
Where The Levels Sit Now
With AUD USD at 0.69394:
M30 Target 2 at 0.69338 is 5.6 pips below, the nearest level on the board, with Target 3 at 0.69226 a further 11.2 below.
M15 Target 1 at 0.69328 sits almost on top of that M30 level, 6.6 pips below price, so if one is reached the other is very close behind.
H4 Target 1 at 0.69133 is 26.1 pips below. That is a four hour position working at four hour speed.
Above price, the M30 trailing stop at 0.69600 is the first level, then the M15 stop at 0.69602 within a fifth of a pip of it, and the H4 stop far out at 0.69871.
Already behind price, the H1 targets at 0.69585 and 0.69443 and the M30 target at 0.69451 have all been reached.
Those are the levels on the chart and how far price sits from each. None of it is a forecast.
What You Are Actually Buying
A trailing level you can actually read. Not just a label that says the trade closed, but the number that tells you whether it closed protecting you or protecting what the trade had done. Today the one hour closed 5.4 pips below its own entry.
A stop measured fresh on every chart, every time. The fifteen minute was tighter than the thirty minute yesterday and wider today. The ordering follows the market rather than the clock, and the only way to know is to read it.
A lot size that falls out of that number rather than out of a habit. Today the thirty minute funds 22 percent more position than the fifteen minute for the same money at risk.
And every timeframe at once, which is why you can see a finished ticket, a trailing level that has crossed its entry, one that has not yet, and a four hour position barely started, all on one morning in one market.
Direction Sniper prints all of it on your charts in MetaTrader and keeps it live.
- 28 Pair Edition, $77, every major, minor and cross, which is the edition these four panels came from
- Forex Majors Edition, $47, the seven majors including AUD USD
- Gold and Silver Edition, the original and still the one most of our traders run
- EURUSD Edition, $7, the cheapest way to put the panel on a chart and watch it work for yourself
The other two reads from today, which make different points from the same morning: the GBP USD post, where six pips of stop distance decided which of two near identical trades survived, and the gold post, where only one of three entry charts had a ticket at all.
One question. The last time one of your trades closed at a trailing stop, was that level above or below your entry? Tell us on the reviews and feedback page.
AUD USD Today: Common Questions
Is AUD USD a buy or a sell today?
On 8 October 2026 the Direction Sniper panel reads SELL on AUD USD, and every timeframe agrees. The daily and the four hour both point down, which sets the verdict, and the fifteen minute, thirty minute and one hour all point down with them. The one hour ticket has reached two targets and closed at its trailing stop, and three tickets remain open. This describes what the indicator displays and is not a recommendation to trade.
What does closed at trailing stop mean?
It means the position is finished, and on its own it says nothing about how it finished. What matters is where the trailing level had reached before it triggered. Today the AUD USD one hour entered at 0.69727 and closed at 0.69673, which on a sell is 5.4 pips below the entry. Yesterday the GBP USD fifteen minute showed the same status line, entering at 1.32052 and closing at 1.32094, which is 4.2 pips above its entry. Same words, opposite positions relative to entry.
Can a trailing stop close a trade below its entry price?
On a sell, yes, and that is the point of it. The AUD USD one hour started with its stop at 0.69869, which is 14.2 pips above the 0.69727 entry. As structure tightened the level walked 19.6 pips down to 0.69673, crossing under the entry on the way. Once a trailing level crosses the entry price it stops being a device that limits a loss and becomes one that holds on to what the trade has already done.
Does a shorter timeframe always have a tighter stop?
No, and today is a clear example. Sorted by stop width, the AUD USD board reads thirty minute 11.2 pips, fifteen minute 13.7, one hour 14.2 and four hour 36.9. The fifteen minute is not the tightest chart and sits within half a pip of the one hour. A stop is placed beyond the structure a chart is measuring, so the ordering follows the market rather than the clock. On GBP USD yesterday the usual ordering did hold, with 8.4 pips on the fifteen minute against 12.3 on the thirty.
What lot size should you use on AUD USD today?
It depends on the ticket, because each carries its own stop. On a ten thousand dollar account risking half a percent, which is fifty dollars, at ten dollars per pip per standard lot, the thirty minute stop of 11.2 pips allows about 0.44 lots, the fifteen minute stop of 13.7 pips allows 0.36, the one hour stop of 14.2 pips allows 0.35 and the four hour stop of 36.9 pips allows 0.13. The thirty minute funds the largest position today, which is 22 percent more than the fifteen minute.
What are the AUD USD key levels today?
With AUD USD at 0.69394, the nearest level below is the thirty minute second target at 0.69338, then the fifteen minute first target at 0.69328 almost beside it, then the thirty minute third target at 0.69226 and the four hour first target at 0.69133. Above price, the thirty minute trailing stop at 0.69600 and the fifteen minute stop at 0.69602 sit within a fifth of a pip of each other, with the four hour stop far out at 0.69871.
Why is the AUD USD thirty minute trailing stop still above its entry?
Because it has not walked far enough yet. That ticket entered at 0.69563 at 06:30 with its stop at 0.69675, and the level has since moved 7.5 pips in to 0.69600, which is still 3.7 pips above the entry. So its worst case has been cut by two thirds while it remains in the half of its life where the stop is limiting rather than holding. The one hour on the same pair has already crossed under its entry, which is what the same level looks like a few hours later.
Trading foreign exchange, gold and other leveraged products carries a high level of risk and is not suitable for everyone. The levels above describe where the indicator placed entries, stops and targets at the time the charts were read, and the status shown for each ticket is the status the panel displayed at that moment. Distances between an entry and a closing level are arithmetic on those published levels and are not a statement of anyone’s result, which depends on position size, spread, slippage and how each trader manages an order. The four hour, thirty minute and fifteen minute positions were still open, so their outcomes are not known. A stop is a level rather than a guarantee, and gaps or fast markets can fill you past it. Trailing a stop reduces the worst case on a position but also closes positions that may later have recovered. Lot sizing figures are arithmetic for illustration and are not a recommendation about how much anyone should trade. Nothing here is financial advice. Past performance does not guarantee future results.

