Gold Forecast Today, 8 October 2026: Stopped Out On One Chart, Right On Three Others
Executive Summary
Yesterday we published the arithmetic on a gold four hour trade that had just been stopped out. It entered at 4131.38, it was risking 80.79 points, and the trailing stop had walked in far enough that it only cost 44.18.
What happened next is the part worth your time.
The same morning the panel entered three fresh sells on the shorter charts, at 4160.19, 4156.23 and 4147.31. Later that day gold fell to around 4071.
One chart was stopped out. Three were right. Same market, same direction, same session.
Gold is trading at 4121.21.
| Chart | Direction | Ticket today |
|---|---|---|
| D1 | DOWN | sets the verdict |
| H4 | DOWN | sets the verdict. Monday’s ticket closed |
| H1 | UP | none, waiting for alignment |
| M30 | UP | none, waiting for alignment |
| M15 | DOWN | live, sell at 4128.51 |
One live ticket out of three entry charts this morning, and a verdict that has not moved in four days.
1. Being Stopped Out Is Not The Same As Being Wrong
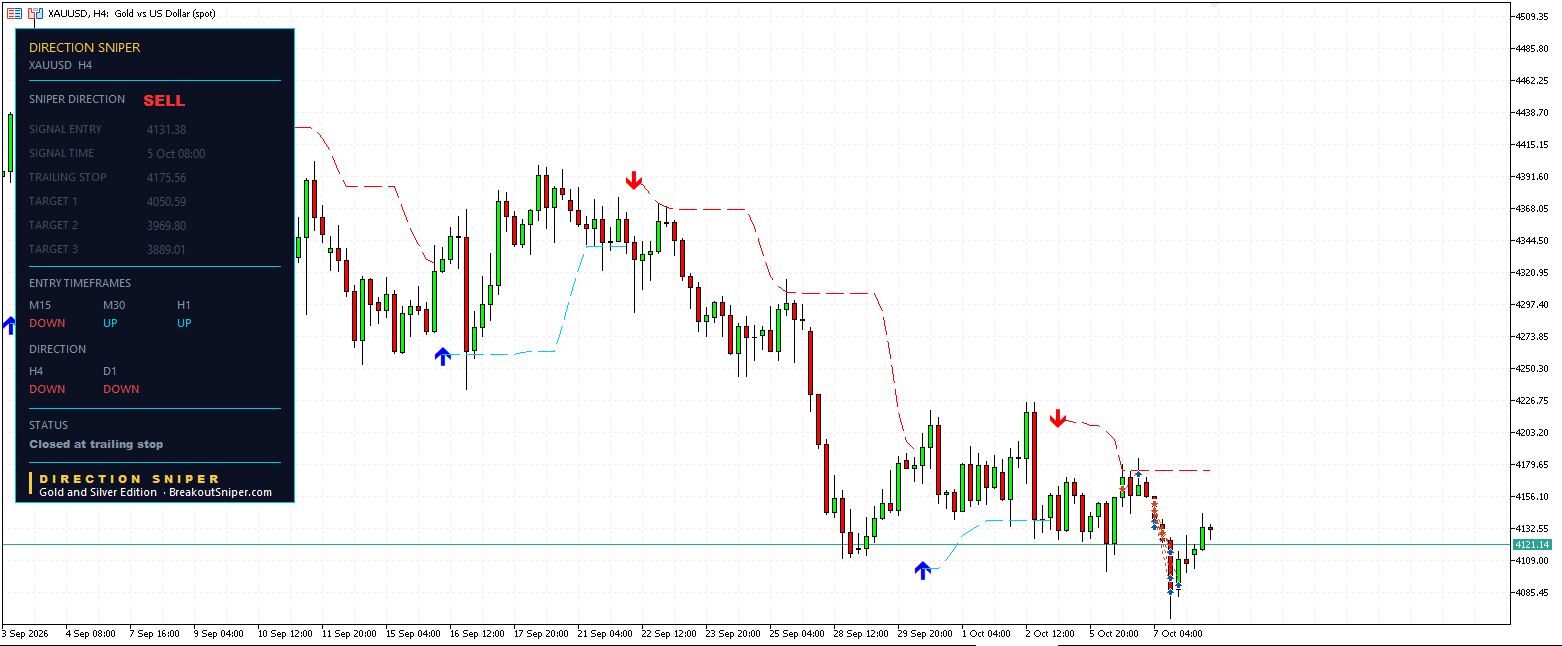
These two things feel identical at the moment they happen, and they are not related at all.
Being stopped out means price reached a level you chose in advance on one particular chart. That is a fact about where your stop was.
Being wrong means the market went the other way. That is a fact about the market.
Monday’s four hour ticket was stopped out. The market then did exactly what that ticket said it would do.
| Level | |
|---|---|
| Entry, 5 Oct 08:00 | 4131.38, sell |
| Original stop | 4212.17, so 80.79 points of risk |
| Closed at trailing stop | 4175.56, costing 44.18 points |
| Where price went afterwards | around 4071 |
The direction was correct. The stop was in the wrong place for the move that was coming. Those are two separate problems and only one of them was a problem.
What the tool does for you here: the verdict and the ticket are different things. The daily and the four hour set the direction and they never wavered through any of this, so the panel kept issuing sells. One ticket closing does not retire the idea.
2. Three Tickets Replaced It The Same Morning
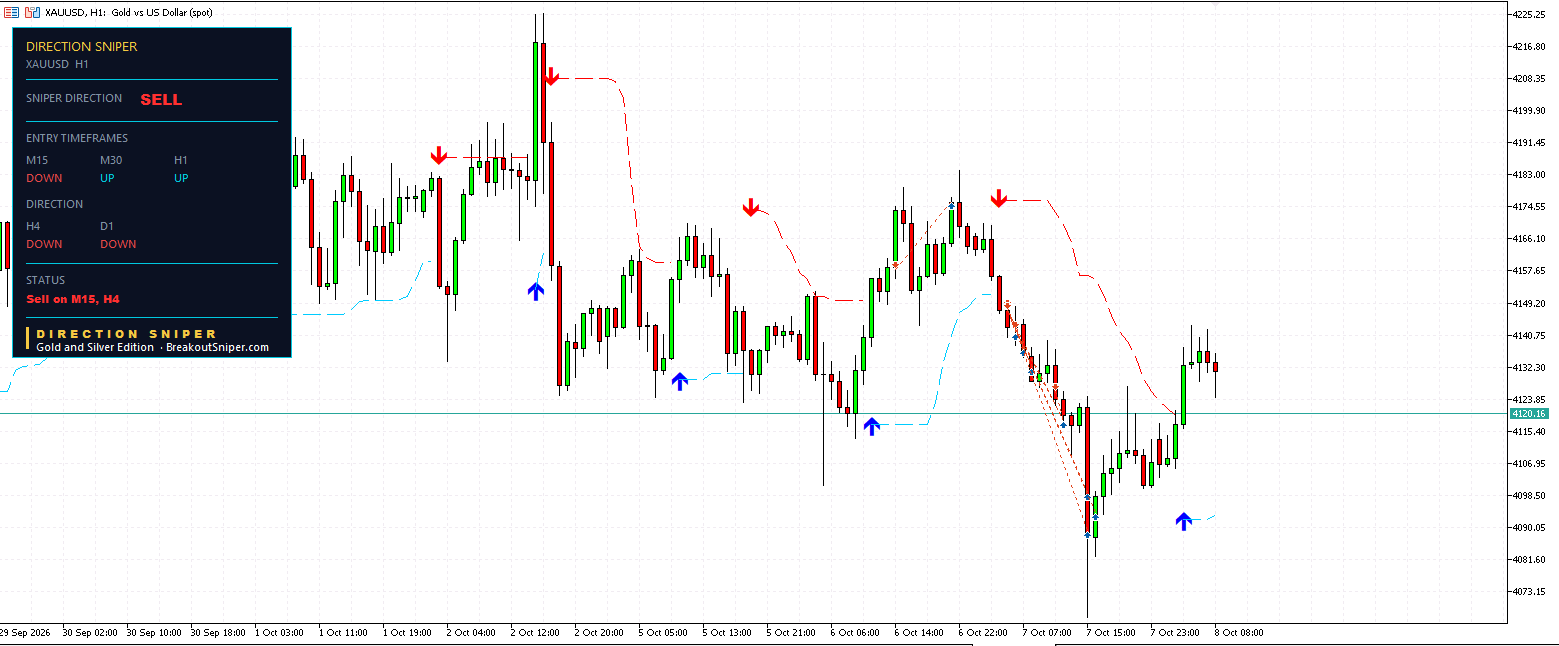
While that four hour position was being closed out, the panel was already working.
| Chart | Entry | Risk | Its three targets |
|---|---|---|---|
| M15 | 4160.19 | 9.36 | 4150.83, 4141.48, 4132.12 |
| M30 | 4156.23 | 18.86 | 4137.37, 4118.52, 4099.66 |
| H1 | 4147.31 | 28.99 | 4118.32, 4089.34, 4060.35 |
Gold went to around 4071.
That is below every level in that table except the one hour third target at 4060.35.
Three tickets, all sells, all in the direction the four hour had been calling for days, all entered at better prices than the position that had just died, and all with a fraction of its risk.
3. Why That Is Not A Close Contest
Here is the piece that most traders never quite get to, and it is the whole reason the day worked.
Every ticket is sized from its own stop, so every ticket risks the same money.
That makes the stop distance a unit of measurement. One unit is whatever your stop distance is, in whatever that ticket costs you. The point distances are different, the dollar risk is the same, so you can compare tickets directly.
Now look at the four of them in those units.
| Ticket | Its risk | Result in units of its own risk |
|---|---|---|
| H4 | 80.79 | minus 0.55 |
| M15 | 9.36 | price passed its three unit target |
| M30 | 18.86 | price passed its three unit target |
| H1 | 28.99 | price passed its two unit target |
One ticket gave back just over half a unit. Three tickets saw price travel to two and three units in their favour.
With identical money on every one of them.
That is what makes the arithmetic of a day like Tuesday lopsided, and the trailing stop is the reason the one loss was 0.55 units rather than a full one.
Note the honest qualifier. Price reaching a target level is not the same as a result in an account, because that depends on whether a trader was in the trade, how they handled the order and what they did at each level. The levels are what the panel published in advance. What anyone did with them is their own.
What the tool does for you here: this comparison is only possible because every ticket arrives with a measured stop in points. Without that number the four trades are four different sizes of bet chosen by feel, and nothing in this section can be calculated at all.
4. And No, Holding The Four Hour Was Not Better
The obvious objection is that the four hour should simply have been held.
Run it forward. That ticket was a sell from 4131.38. Gold is now 4121.21.
It would be 10.17 points onside. On 80.79 points of risk, that is 0.13 units, three days after entry, and it would never once have reached its first target at 4050.59.
Against three tickets where price travelled two and three units in two days, on a fraction of the capital.
So the trailing stop did not cost the trade. It closed the expensive version of the trade, and the panel handed over three cheap versions of the same idea on the same morning. The only trader hurt by Tuesday was the one holding a single wide four hour position with nothing else on the screen.
5. Today: One Chart Out Of Three
The verdict is still SELL. Daily down, four hour down, unchanged for four days.
But the entry charts disagree with each other. M15 down. M30 up. H1 up.
So there is one ticket this morning and nothing on the other two.
That is not a weaker signal on the thirty minute and the one hour. It is the absence of one. The panel will not build a sell ticket on a chart currently pointing up, so it issues no entry, no stop and no targets, and waits for alignment.
Overnight gold rallied from around 4071 back into the 4140s before easing to here. That rally turned those two charts up. It did not turn the daily or the four hour, so the direction above them has not changed.
The two quiet charts are not telling you the trend is over. They are telling you they are not in position yet.
What the tool does for you here: no ticket is an answer. The temptation on a morning like this is to take the fifteen minute signal and then force a thirty minute trade to match it, because it feels like the same idea. A blank panel is the cheapest trade you will make all week.
6. The One Live Ticket
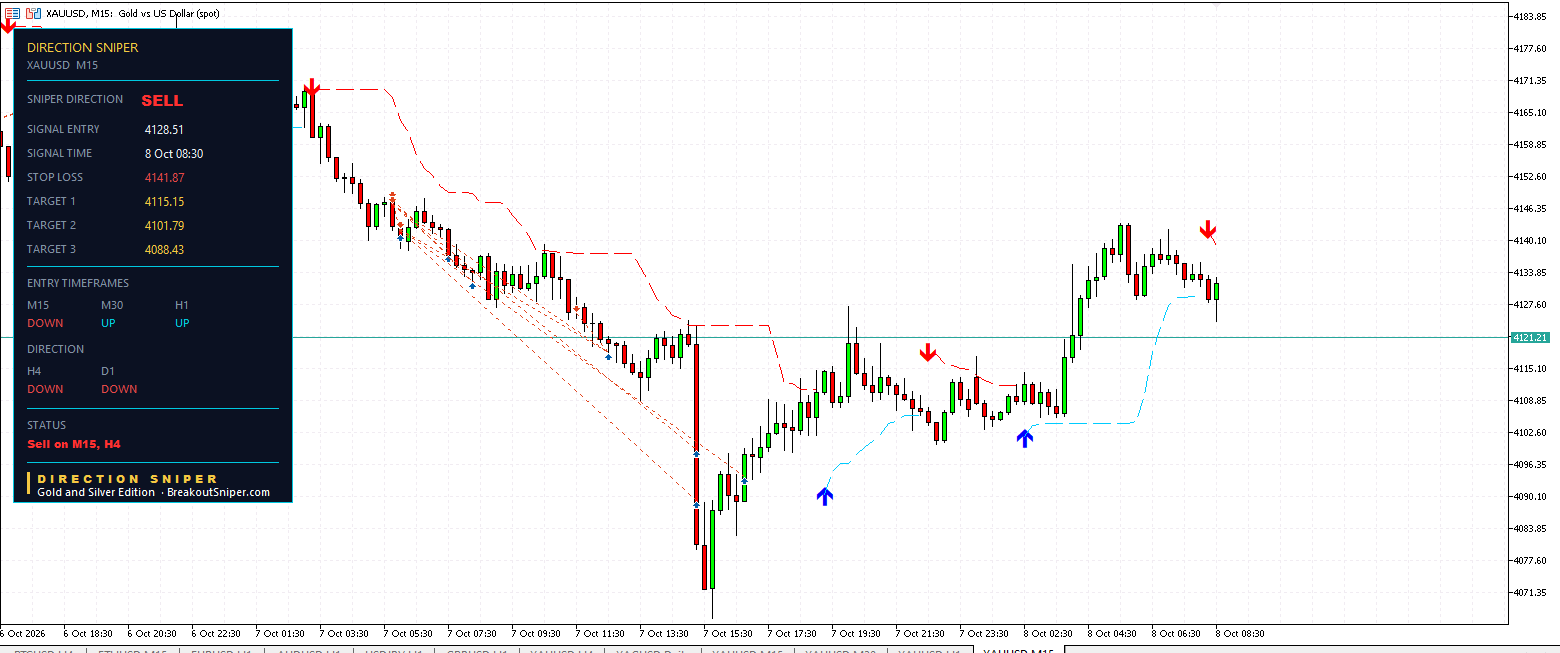
Sell. Entry 4128.51 at 08:30 today. Stop loss 4141.87. Targets 4115.15, 4101.79 and 4088.43.
Entry to stop is 13.36 points. The level is still labelled STOP LOSS rather than TRAILING STOP, so nothing has trailed yet and the full 13.36 is what is being carried.
With gold at 4121.21 the ticket is 7.30 points ahead, a little over halfway to its first target.
Now put its risk next to Monday’s.
| Ticket | Risk | Lot size at 0.5% | Money at risk | Account needed for 0.5% |
|---|---|---|---|---|
| Today’s M15 | 13.36 | 0.03 | $40.08 | $2,672 |
| Monday’s H4 | 80.79 | 0.01 minimum | $80.79 | $16,158 |
Gold is one hundred ounces per standard lot, so a one dollar move is one hundred dollars, and the calculation is your risk in money divided by the stop distance multiplied by one hundred.
Same market. Same direction. Same week. One of those fits a two and a half thousand dollar account comfortably and the other does not fit a ten thousand dollar account at all.
What the tool does for you here: the stop arrives measured, in points, on every ticket. That number is the only input the lot size needs, and it is the difference between choosing a position size and inheriting one.
Where The Levels Sit Now
With gold at 4121.21:
M15 Target 1 at 4115.15 is 6.06 below, the nearest level on the board.
M15 Target 2 at 4101.79 is 19.42 below, and Target 3 at 4088.43 is 32.78 below.
M15 stop at 4141.87 is 20.66 above price and is the only live risk level on the chart this morning.
Above all of it, the four hour panel still displays 4175.56, where Monday’s ticket closed. That is history rather than a level to trade against, but it is worth knowing where the last one died.
Those are the levels on the chart and how far price sits from each. None of it is a forecast.
What You Are Actually Buying
A direction that survives a stopped out position. Being taken out of one chart is not evidence about the market. The daily and the four hour decide it, four days and counting, and the panel kept issuing sells while one ticket was being closed.
A measured stop on every ticket, in points. 13.36 today, 80.79 on Monday. That number is what turns four different trades into four comparable ones, and without it nothing in section three can be worked out at all.
A trailing stop level recalculated as structure tightens, labelled so you can see which one you are carrying. You still move the order on your platform yourself. The indicator does the arithmetic, the click is yours.
And every timeframe working at once, which is the only reason three replacements existed on a morning when the widest chart was being stopped out.
Direction Sniper prints all of it on your charts in MetaTrader and keeps it live.
- Gold and Silver Edition, the edition these four panels came from and the one most of our traders run
- Forex Majors Edition, $47, the seven majors, if you want the same panel on the pairs that move gold
- EURUSD Edition, $7, the cheapest way to put the panel on a chart and watch it work for yourself
Yesterday’s post, written while the four hour ticket had only just closed and before any of this had played out, is here. Read them in order.
One question. When you were last stopped out, did you check where the market went afterwards? Tell us on the reviews and feedback page.
Gold Today: Common Questions
Is gold a buy or a sell today?
On 8 October 2026 the Direction Sniper panel reads SELL on gold. The daily and the four hour both point down, which sets the verdict and has not changed in four days. Of the three entry charts, only the fifteen minute points down, so there is one live ticket this morning while the thirty minute and the one hour wait for alignment. This describes what the indicator displays and is not a recommendation to trade.
Does being stopped out mean you were wrong about the market?
No, and the two are not related. Being stopped out means price reached a level you chose in advance on one particular chart, which is a fact about where your stop was. Being wrong means the market went the other way, which is a fact about the market. The gold four hour ticket from 5 October closed at 4175.56 and price then went to around 4071, so the direction had been right the whole time and only the stop placement was unsuited to the move.
What happened to the gold four hour trade from Monday?
It entered at 4131.38 on 5 October with its stop at 4212.17, which is 80.79 points of risk, and closed at its trailing stop of 4175.56 for 44.18 points. On the same morning the panel entered three fresh sells on the shorter charts at 4160.19, 4156.23 and 4147.31, and price later traded down to around 4071, which is below every target published for those three except the one hour third target at 4060.35.
Why does one loss and three winners not balance out evenly?
Because every ticket is sized from its own stop, so every ticket risks the same money and the stop distance becomes a unit of measurement. Measured that way, the four hour gave back 0.55 of a unit while price travelled to the three unit target on the fifteen minute and the thirty minute and the two unit target on the one hour. Identical money on each, very different distances travelled. Price reaching a target level is not the same as a result in an account, which depends on how each trader managed the order.
Why is there no gold signal on the 30 minute and 1 hour charts today?
Because both are currently pointing up while the verdict is to sell. The panel will not build a sell ticket on a timeframe pointing the other way, so it issues no entry, no stop and no targets and waits for alignment. Gold rallied from around 4071 back into the 4140s overnight, which turned those two charts up. It did not turn the daily or the four hour, so the direction above them is unchanged.
What are the gold key levels today?
With gold at 4121.21, the nearest level below is the fifteen minute first target at 4115.15, then target two at 4101.79 and target three at 4088.43. Above price, the fifteen minute stop at 4141.87 is the only live risk level on the board this morning. Higher still, 4175.56 is where Monday’s four hour ticket closed, which is history rather than a level to trade against.
What lot size should you use on today’s gold trade?
Gold is one hundred ounces per standard lot, so a one dollar move is one hundred dollars and the calculation is your risk in money divided by the stop distance multiplied by one hundred. Today’s fifteen minute stop is 13.36 points, so on a ten thousand dollar account with a half percent limit of fifty dollars that allows about 0.03 lots, risking $40.08. To take it at half a percent on the minimum 0.01 lots you would need an account of $2,672, against the $16,158 that Monday’s 80.79 point four hour stop demanded.
Trading foreign exchange, gold and other leveraged products carries a high level of risk and is not suitable for everyone. The levels above describe where the indicator placed entries, stops and targets at the time the charts were read. The four hour position described is closed. Price reaching a published target level is not the same as a realised result, which depends on position size, spread, slippage and how each trader manages an order. Figures describing what a closed position would have done if it had been held are hypothetical and are drawn from the price range visible on the charts. The fifteen minute position was still open, so its outcome is not known. A stop is a level rather than a guarantee, and gaps or fast markets can fill you past it. Lot sizing figures are arithmetic for illustration and are not a recommendation about how much anyone should trade, and contract sizes vary by broker, so check your own contract specifications. Nothing here is financial advice. Past performance does not guarantee future results.

