EUR USD Forecast Today, 7 October 2026: Stopped Out Yesterday, Re-Entered 40 Pips Higher Today
Executive Summary
Yesterday we published three live EUR USD sell tickets with their entries and their risk in pips. During yesterday’s rally, price traded above all three of those stops.
We were wrong on all three.
The panel did not change its mind. The daily stayed down, the four hour stayed down, and this morning it issued fresh sells around forty pips above where yesterday’s tickets had been placed.
EUR USD is trading at 1.11985.
| Chart | Entry | Signal time | Risk | Status now |
|---|---|---|---|---|
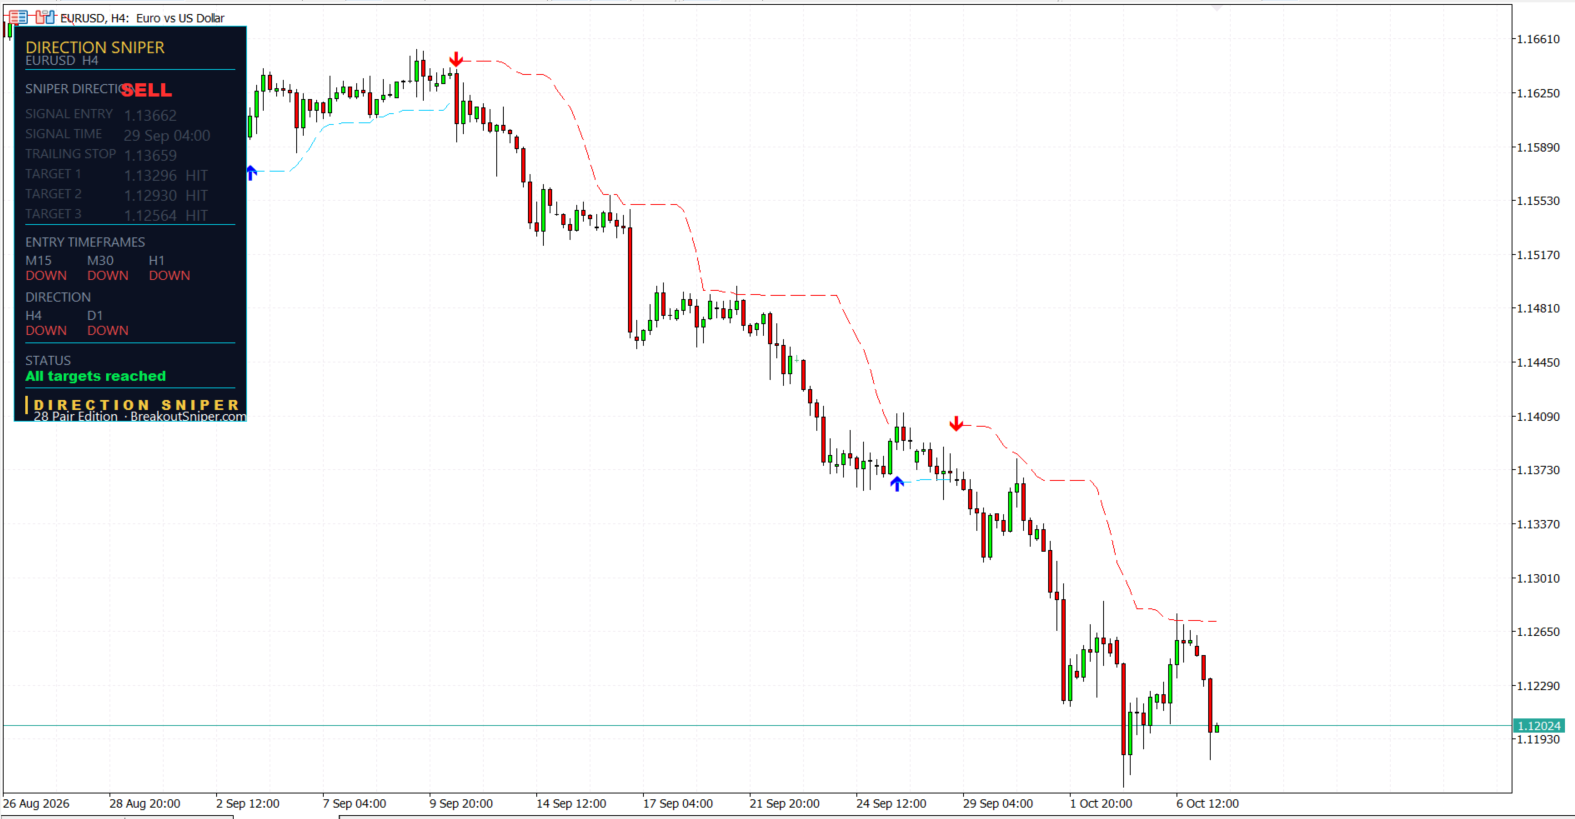
| H4 | 1.13662 | 29 Sep 04:00 | 36.6 pips | All three targets reached |
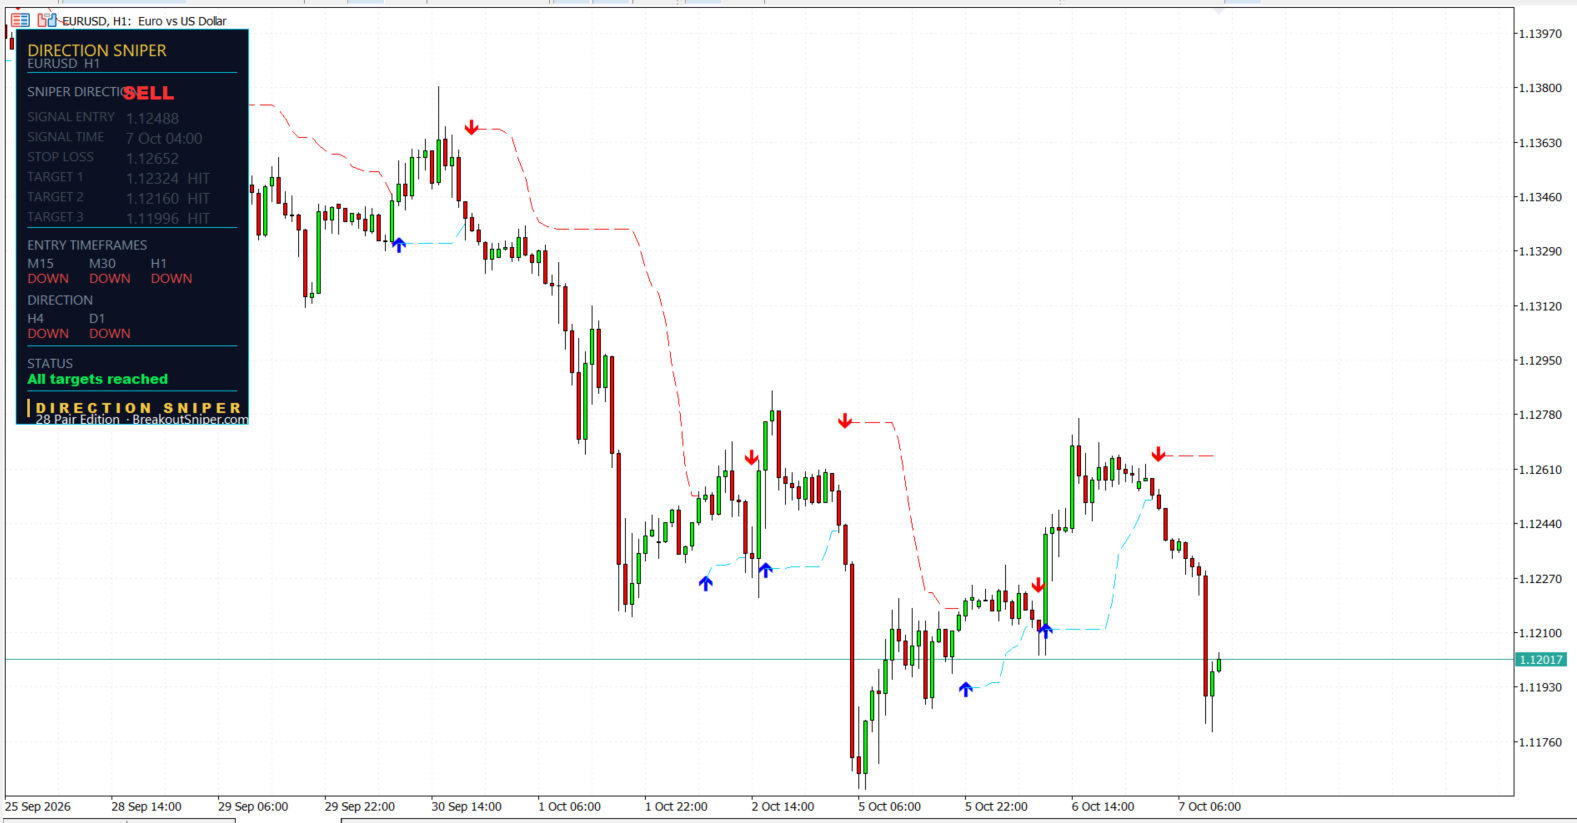
| H1 | 1.12488 | 7 Oct 04:00 | 16.4 pips | All three targets reached |
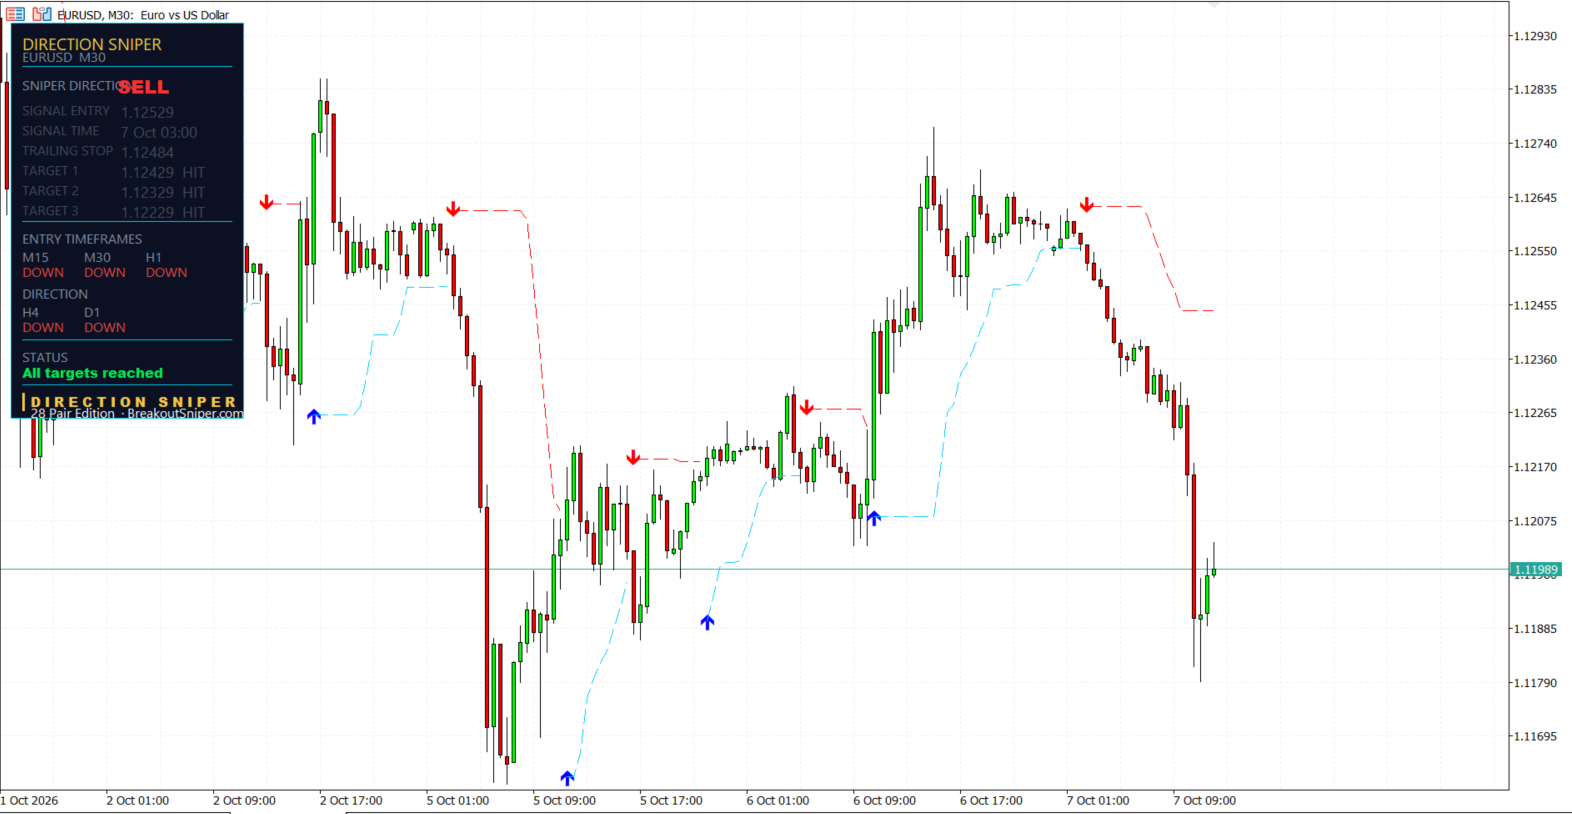
| M30 | 1.12529 | 7 Oct 03:00 | 10.0 pips | All three targets reached |
| M15 | 1.12554 | 7 Oct 00:15 | 6.7 pips | Closed at trailing stop |
Three charts reached every target they displayed. One was stopped out for 6.2 pips an hour before the move.
The useful part of today is not the winners. It is the twenty four hours in between.
1. What We Published Yesterday
Here is yesterday’s post, still live, with the three tickets exactly as they were written.
| Chart | Entry | Risk | Which puts the stop at |
|---|---|---|---|
| H1 | 1.12104 | 14.0 pips | 1.12244 |
| M30 | 1.12143 | 12.8 pips | 1.12271 |
| M15 | 1.12144 | 15.1 pips | 1.12295 |
We did not publish the stop prices, we published the risk in pips, which fixes them to the pip. You can do the arithmetic yourself from the post.
Yesterday afternoon price rallied above 1.1272. Every one of those three stops sat below that level.
All three were taken out. Roughly fourteen pips, thirteen pips and fifteen pips, which is what the sizing was built around and exactly what we said we were risking.
There is nothing clever to say about that. The trades were wrong and they cost what they were supposed to cost.
2. The Panel Did Not Change Its Mind
This is the part that decides whether yesterday was an annoyance or a disaster.
Price rallied far enough to take out three positions. The daily stayed down. The four hour stayed down. No buy ticket was issued on any timeframe at any point during that rally.
So the rally never broke structure. It took money off the table without changing the picture above it.
That left the trader with two choices yesterday afternoon, and they are not close in cost.
Choice one. Three stops in a row means the trend is over. Stand down, or start buying.
Choice two. Three stops in a row means those three entries were in the wrong place. The direction is unchanged until the charts that set it say otherwise.
The second one keeps you at the desk this morning. The first one has you flat or long while the move you originally predicted finally happens.
What the tool does for you here: the verdict comes from the daily and the four hour, and nothing that happens on a shorter chart can overrule it. Your own stop getting hit is not evidence about the trend. It is evidence about your entry. Those are different things, and almost nobody separates them in the moment.
3. The Re-Entry
This morning, three fresh sells.
| Chart | Yesterday’s entry | Today’s entry | Higher by |
|---|---|---|---|
| M15 | 1.12144 | 1.12554 | 41.0 pips |
| M30 | 1.12143 | 1.12529 | 38.6 pips |
| H1 | 1.12104 | 1.12488 | 38.4 pips |
Same direction. Same instrument. Roughly forty pips better.
That is the entire argument for not flipping your bias after a loss. The rally that stopped you out is also the rally that hands you a better price, provided you are still willing to take it.
The M30 entered at 1.12529 at 03:00 with a ten pip stop, and reached 1.12429, 1.12329 and 1.12229 in order. Its trailing stop has walked down to 1.12484, below its own entry.
The H1 entered at 1.12488 at 04:00 with a 16.4 pip stop, and reached 1.12324, 1.12160 and 1.11996.
The H4 has been short since 29 September at 1.13662 and reached its third target at 1.12564. Price is now 167 pips below that entry, nine days later. Its trailing stop sits at 1.13659, three hundredths of a pip below the entry price.
What the tool does for you here: it does not sulk and it does not chase. It takes the same measurement this morning that it took yesterday morning, and if that measurement produces a ticket, it prints one. Yesterday’s result is not an input.
4. The One That Did Not Work
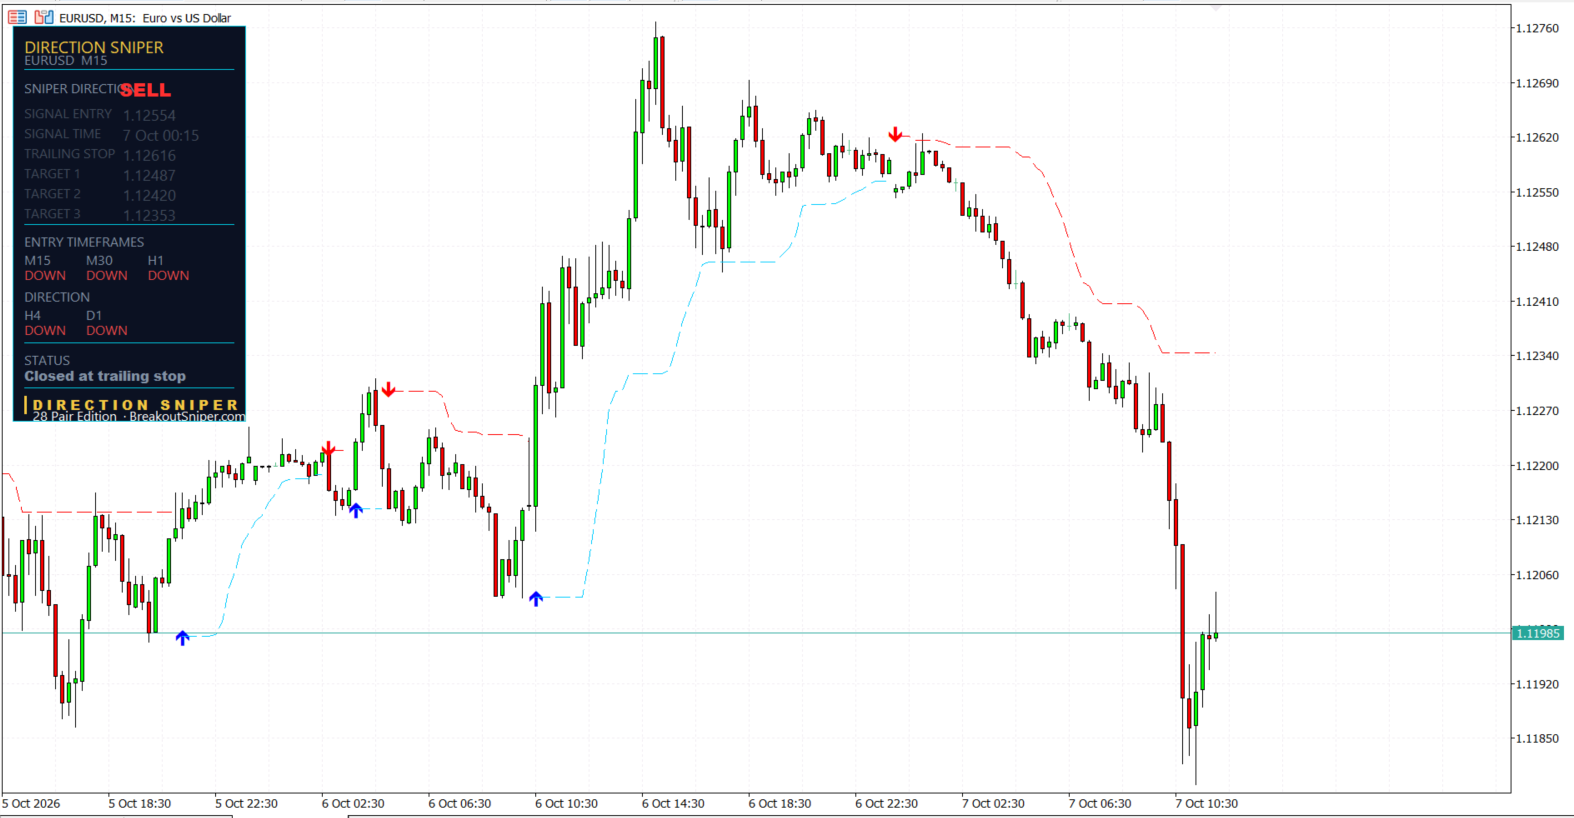
The fifteen minute entered at 1.12554 at 00:15 with a 6.7 pip stop. It was stopped out at 1.12616.
It cost 6.2 pips. It reached none of its three targets.
Price is now 1.11985, which is 57 pips below where that ticket entered.
Read that again, because it is the honest shape of this morning. On the same instrument, in the same session, in the same direction, one ticket was shaken out minutes before the move it was built for.
The trailing stop barely helped. It had moved half a pip when it was hit.
We publish that for the same reason we published yesterday’s three losers. A page that only shows the tickets that worked tells you nothing you can use, and you would be right not to trust it.
5. Sizing The Second Trade
This is where most of the damage gets done after a losing day, and it has nothing to do with direction.
The instinct after three stops is to make it back. Bigger size on the next one, because the next one is clearly the good one.
The stop distance has not heard about yesterday.
On a ten thousand dollar account risking half a percent, which is fifty dollars, at ten dollars per pip per standard lot:
| Ticket | Risk | Lot size |
|---|---|---|
| Yesterday’s M30 | 12.8 pips | 0.39 |
| Today’s M30 | 10.0 pips | 0.50 |
| Today’s H1 | 16.4 pips | 0.30 |
| Today’s M15 | 6.7 pips | 0.75 |
| Today’s H4 | 36.6 pips | 0.14 |
Today’s thirty minute ticket does allow a larger position than yesterday’s. Not because yesterday lost. Because the stop was ten pips instead of 12.8.
That is the whole discipline. The size went up for a reason that had nothing to do with wanting it back, and it would have gone down just as readily if the stop had been wider. A trader who doubles up to recover is risking one and a half percent on a trade they have decided is special, and they are usually deciding that at exactly the wrong moment.
What the tool does for you here: every ticket arrives with its own measured stop, so the position size is arithmetic rather than mood. Yesterday is not a variable in that calculation.
Where The Levels Sit Now
With EUR USD at 1.11985, every target displayed on the four hour, the one hour and the thirty minute has been reached. There are no unreached targets left on the board below price.
The levels still shown above price are the trailing stops. The M30 at 1.12484, the H1 stop at 1.12652 and the H4 trailing stop at 1.13659.
Worth noting on the H1: it reached all three targets while its level was still labelled STOP LOSS rather than TRAILING STOP. Targets can be reached before the trailing logic ever moves the level, and the two things are not connected.
The next ticket appears when a chart aligns with the verdict again. Until then the panel is waiting for alignment, and waiting is a position.
What You Are Actually Buying
A direction that does not move because you lost. The daily and the four hour set it, and three stops in a row on shorter charts is not an argument against it. That is the difference between a bad afternoon and a bad week.
A measured stop on every ticket, every time. Fourteen pips yesterday, ten pips today, 36.6 on the four hour. Those numbers are where the position size comes from, which is the only thing that stops a losing day compounding into a reckless one.
A trailing stop level recalculated as structure tightens, with the label changing from STOP LOSS to TRAILING STOP once it has started. You still move the order on your platform yourself. The indicator does the arithmetic, the click is yours.
And a tool that re-enters without flinching. The hardest trade this morning was the one taken after three losses in a row, and nothing about it was difficult for the panel.
Direction Sniper prints all of it on your charts in MetaTrader and keeps it live.
- EURUSD Edition, $7, the pair in today’s read and the cheapest way to put the panel on a chart
- Forex Majors Edition, $47, the seven majors on one licence
- 28 Pair Edition, $77, every major, minor and cross, which is the edition these four panels came from
- Gold and Silver Edition, the original and still the one most of our traders run
Today’s gold post covers the same morning from the other side, where a four hour position closed at its trailing stop and what that actually cost.
One question. The last time you were stopped out three times in a row, did you take the next signal? Tell us on the reviews and feedback page.
EUR USD Today: Common Questions
Is EUR USD a buy or a sell today?
On 7 October 2026 the Direction Sniper panel reads SELL on EUR USD. The daily and the four hour both point down, which sets the verdict, and the fifteen minute, thirty minute and one hour all point down as well. The four hour, one hour and thirty minute tickets have each reached all three of their displayed targets and the fifteen minute closed at its trailing stop. This describes what the indicator displays and is not a recommendation to trade.
What happened to yesterday’s EUR USD trades?
They were stopped out. The 6 October post published three live sell tickets, the one hour at 1.12104 with 14.0 pips of risk, the thirty minute at 1.12143 with 12.8 and the fifteen minute at 1.12144 with 15.1, which puts their stops at 1.12244, 1.12271 and 1.12295. Price rallied above 1.1272 yesterday afternoon, so all three were taken out for roughly the risk each was carrying.
Should you re-enter after being stopped out?
The question worth asking is whether the move that stopped you changed the structure on the charts that set your direction. Yesterday’s rally on EUR USD took out three positions and produced no buy ticket on any timeframe, and the daily and four hour stayed down throughout, so the direction was unchanged while the entries had simply been in the wrong place. A stop being hit is information about your entry rather than about the trend. This describes the method used here and is not advice about what anyone should do with their own positions.
How much higher were today’s EUR USD entries?
Around forty pips. Yesterday’s fifteen minute, thirty minute and one hour tickets entered at 1.12144, 1.12143 and 1.12104. This morning the same three charts entered at 1.12554, 1.12529 and 1.12488, which is 41.0, 38.6 and 38.4 pips higher respectively. Same instrument, same direction, better price.
Should you increase your lot size to recover a loss?
The lot size comes from the stop distance, not from yesterday’s result. On a ten thousand dollar account risking half a percent at ten dollars per pip per standard lot, yesterday’s 12.8 pip thirty minute stop allowed 0.39 lots and this morning’s 10.0 pip stop allows 0.50. The size went up because the stop was tighter, which would have worked in reverse just as readily. Doubling a position to recover a loss means risking one and a half percent on a trade decided to be special, usually at the worst moment.
What are the EUR USD key levels today?
With EUR USD at 1.11985, every target displayed on the four hour, one hour and thirty minute has already been reached, so there are no unreached targets left below price. The levels still shown above are the thirty minute trailing stop at 1.12484, the one hour stop at 1.12652 and the four hour trailing stop at 1.13659.
Why did the EUR USD fifteen minute trade lose while the others reached every target?
It entered at 1.12554 at 00:15 with a 6.7 pip stop and was stopped out at 1.12616 for 6.2 pips, reaching none of its three targets. Price is now 1.11985, which is 57 pips below that entry. A tight stop on a short timeframe can be taken out by movement that means nothing on the bigger charts, which is the cost that comes with the smaller risk per ticket.
Trading foreign exchange, gold and other leveraged products carries a high level of risk and is not suitable for everyone. The levels above describe where the indicator placed entries, stops and targets at the time the charts were read, and the status shown for each ticket is the status the panel displayed at that moment. Yesterday’s stop levels are calculated from the entries and pip risk published in the previous post. A stop is a level rather than a guarantee, and gaps or fast markets can fill you past it. Lot sizing figures are arithmetic for illustration and are not a recommendation about how much anyone should trade. Reaching a displayed target is not the same as a realised result, which depends on position size, spread, slippage and how each trader manages an order. Nothing here is financial advice. Past performance does not guarantee future results.

