
The gold and silver price forecast today: gold’s 4 hour has flipped up, and the panel has changed its verdict from SELL to NO TRADE. Readings as of 16 September 2026.
How to Read the Chart
The panel on the left gives the verdict. The H4 and daily set the direction, and the entry timeframes (M15, M30 and H1) are where the timing signals appear. On the chart itself, a red arrow marks where that timeframe turned down, and the red dashed line then follows price from above. A blue arrow marks a turn up, with the blue line following from below.
Gold Technical Analysis Today (XAUUSD)
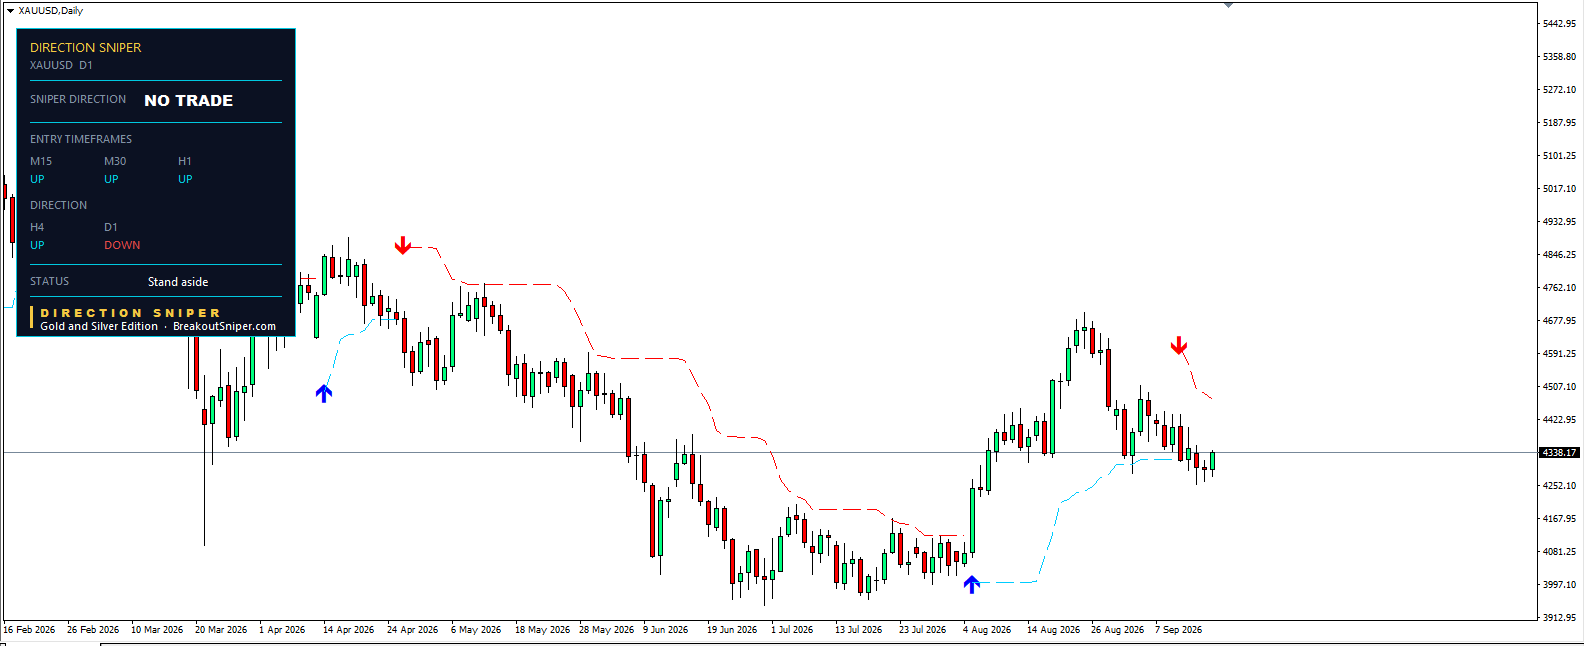
Direction Sniper now reads NO TRADE on gold. The status line says “Stand aside.”
Here is why. The H4 has turned UP while the daily still reads DOWN. The two direction timeframes disagree, so the panel will not name a direction at all. It does not average them, and it does not pick the one it likes better. It stops.
All three entry timeframes read UP as well. M15, M30 and H1.
Price is at 4,338.17.
Every post this week said the same thing: if the H4 flips up, the downtrend read no longer holds. That is what happened. The bounce that started on the fast charts has worked its way up through the M15, then the M30, then the H1, and now the H4.
What it has not done is change the daily, which is still pointing down from the red arrow in early September near 4,600. Until the daily agrees with the H4, the panel has no direction to give and no ticket to calculate.
What NO TRADE Actually Means
It does not mean the market has stopped moving. Gold is up from yesterday.
It means the conditions the system requires are not present. A ticket needs the H4 and daily agreeing on a direction, then an entry timeframe turning to match. Right now the first condition has broken, so nothing downstream of it can happen.
This is the reading that separates a tool from a tip service. Something that always has an opinion will give you one today. The panel tells you the setup has gone, and waits.
Two ways out of it. The daily turns up, and gold flips to a BUY direction with all three entry timeframes already pointing that way. Or the H4 turns back down, and the SELL direction from earlier this week resumes.
Silver Price Forecast Today (XAGUSD)
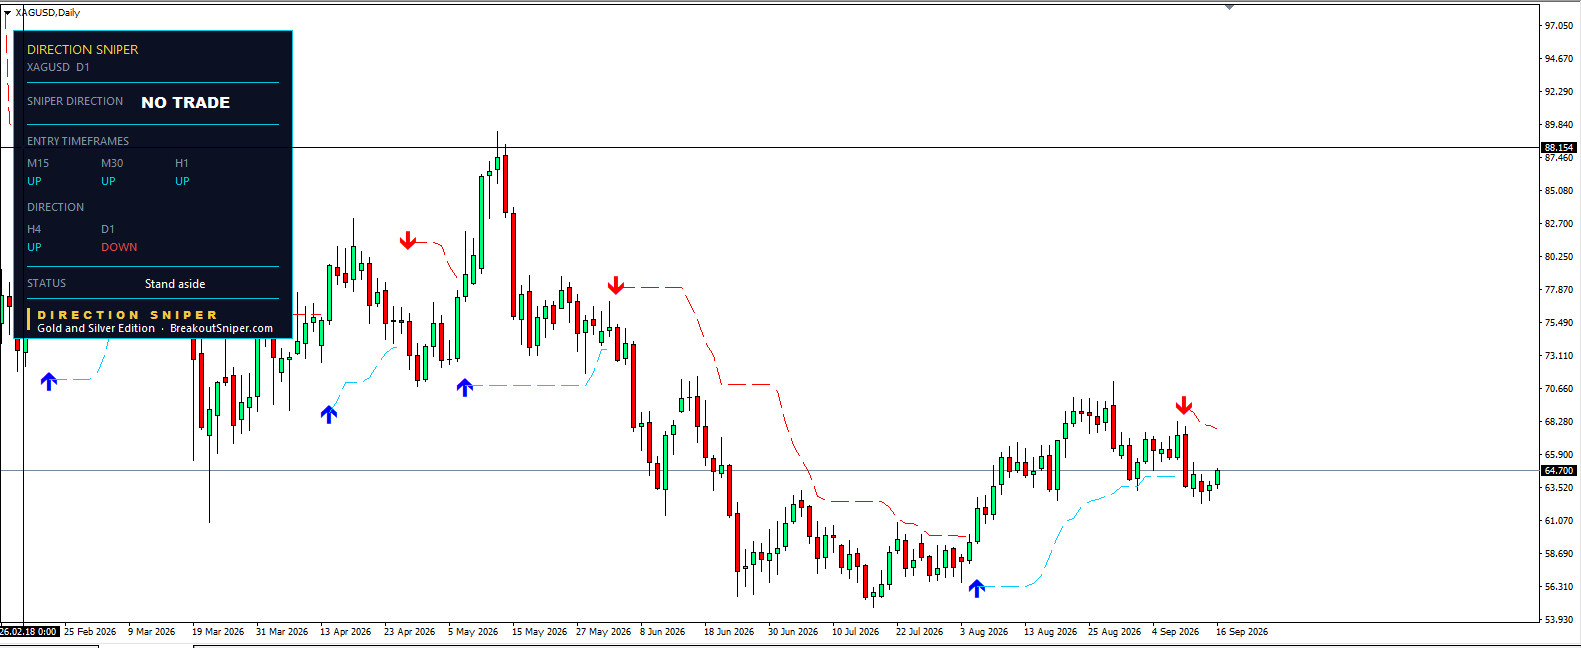
Silver has done the same thing, field for field. NO TRADE, status “Stand aside.”
The H4 has turned UP while the daily still reads DOWN. All three entry timeframes read UP as well. Every field matches gold’s panel exactly.
Price is at 64.700.
The daily chart shows the same structure gold has. The red arrow in early September near 68 is still the last daily signal, and the red line is tracking price from above. Before that, the blue arrow in early August near 56 ran the move up to about 70 in late August. Six turns on the daily across seven months.
Silver’s bounce has come further than gold’s in percentage terms, up from around 62.40 on Monday to 64.70 now, but the panel treats both the same way. The daily has not turned, so there is no direction to trade in either metal.
What Changes the Picture
Neither metal has a direction until its H4 and daily agree again. If the daily turns up, the panel flips to BUY with all three entry timeframes already pointing that way. If the H4 turns back down, the SELL setup from earlier this week resumes. Until one of those happens, there is nothing to act on.
Two metals, same reading, same instruction: stand aside.
The Lesson: Direction Changes Are a Process, Not a Moment
Both metals are in transition today, and the panel is showing you the mechanics of it.
A direction change does not happen in one candle. It works upward through the timeframes, from fast to slow. Watch the order it happened in this week.
Monday, the M15 turned up on the bounce off the lows. The direction was still SELL, and the M15 was the odd one out.
Tuesday, the M30 joined it, then the H1. Still SELL, but now every entry timeframe was pointing the other way.
Today, the H4 has turned up. That is the timeframe the panel uses to set direction, so the verdict has changed to NO TRADE.
The only one left is the daily. If it turns up, both metals flip to a BUY direction, and all three entry timeframes are already there waiting. If the H4 drops back down instead, the SELL direction returns and this whole bounce was just noise inside a downtrend.
Nobody knows which. That is the honest answer, and it is also why the panel says stand aside rather than guessing.
What it does tell you is where the market sits in that sequence: five timeframes turned up, one still down. That is further along than it was yesterday, and yesterday was further than Monday. Whether the last one follows is not something a chart can tell you in advance.
