How To Find The Best Trending Forex Pairs, And Skip The Choppy Ones
The best trending forex pairs are not the same pairs every week, and that is the first thing most lists get wrong.
Search for trending pairs and you will find the same names again and again: GBPJPY, EURUSD, GBPUSD, as if some pairs simply trend and others do not. In practice, a trend lives on a pair only while one of its currencies is strong and the other is weak. When that changes, the trend goes with it.
So instead of a fixed list, this guide gives you a 3 step scan you can run any morning across all 28 pairs. We walk through it on two real pairs from our own charts, one buy and one sell, chart by chart. Then we show you how to recognise a choppy pair before it costs you, and the lot size habit that keeps one strong trend from becoming one oversized bet.
1. Why “Always Trending” Lists Do Not Work
A pair is two currencies priced against each other. EURUSD only trends lower while the euro is weaker than the dollar, and keeps trending only while that stays true.
That is why a pair can trend beautifully for three weeks and then go flat for the next three. Nothing changed about the pair. Something changed about one of its currencies.
| What most lists say | What actually decides it |
|---|---|
| “GBPJPY is a trending pair” | Whether the pound is strong and the yen weak right now |
| “EURUSD trends well” | Whether the euro and the dollar are pulling apart right now |
| “Avoid the crosses” | Whether the two currencies in that cross are strong against weak right now |
The useful question is not “which pairs trend?” It is “which pairs are trending now, and how do I check?”
2. What A Trending Pair Looks Like
Every pair worth trading on our board passes three checks.
| Check | What you look for | Why it matters |
|---|---|---|
| Strong against weak | One of the strongest currencies paired with one of the weakest | Both sides of the pair push the same way |
| Every timeframe agrees | The Direction Sniper panel shows the same direction from the 15 minute to the daily | The move is not just a short burst on one chart |
| Clean H4 structure | Higher lows in an uptrend, lower highs in a downtrend, with pullbacks that hold | The trend has room and rhythm, not random spikes |
Miss one check and the pair goes on the watch list, not the trade list. Miss two and it is not a trending pair right now, whatever its reputation.
3. Step 1: Start With The Strongest And Weakest Currencies
The scan starts with currencies, not pairs.
Each trading day we observe which of the eight major currencies are strongest and which are weakest across the 28 pairs. Put one of the top three against one of the bottom three and you get about nine pairs worth watching out of 28. The other pairs set currencies of similar strength against each other, which is where choppy, directionless price tends to live.
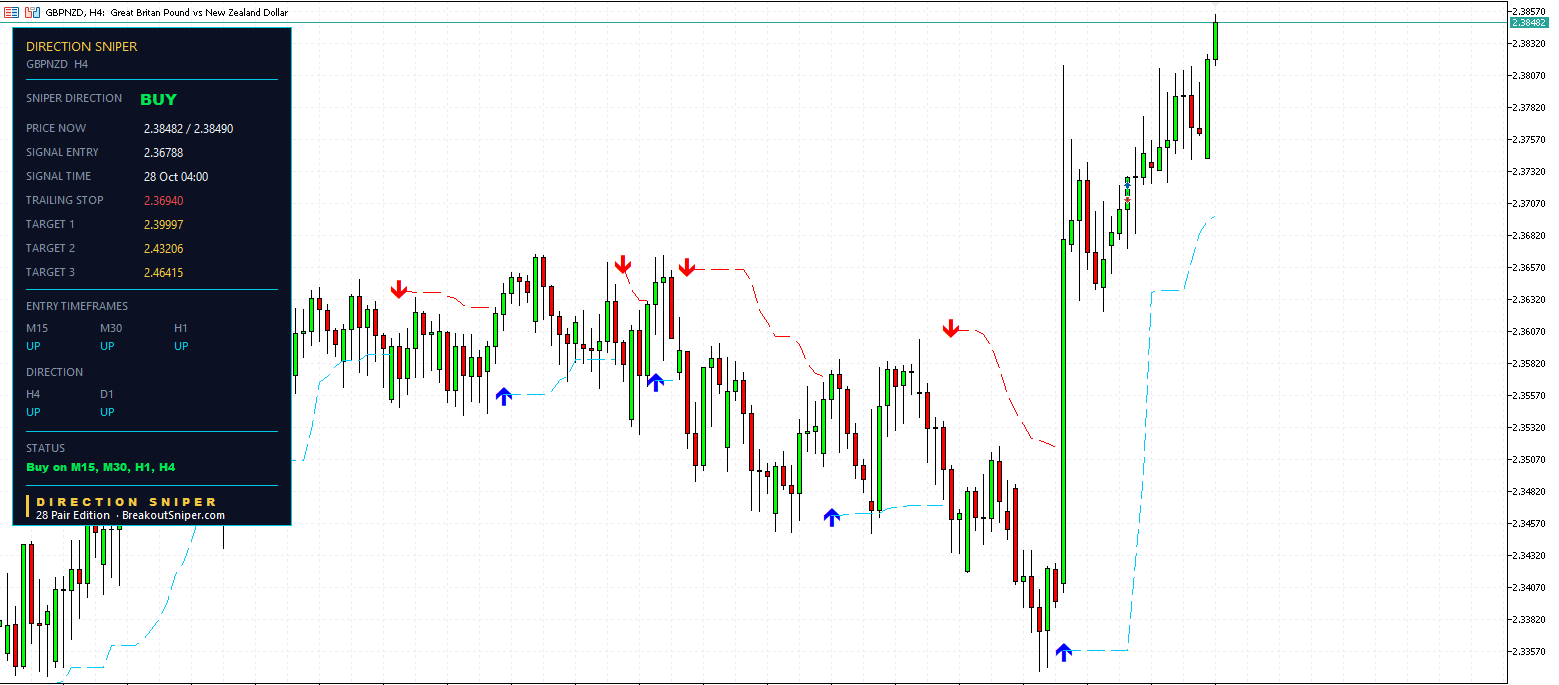
Our two example pairs show how this works. GBPNZD rising means the pound is stronger than the New Zealand dollar. NZDCHF falling means the Swiss franc is stronger than the New Zealand dollar. Two different pairs, one weak currency in common: the kiwi. That is what strong against weak looks like on real charts.
You can see the latest ranking on our Currency Strength Today page, and the full method for turning it into a trade in our guide on how to trade currency strength.
A strength ranking tells you where to look. It does not tell you which way to trade, where to enter or where your stop belongs. That is what the next two steps are for.
4. Step 2: Keep Only The Pairs Where Every Timeframe Agrees
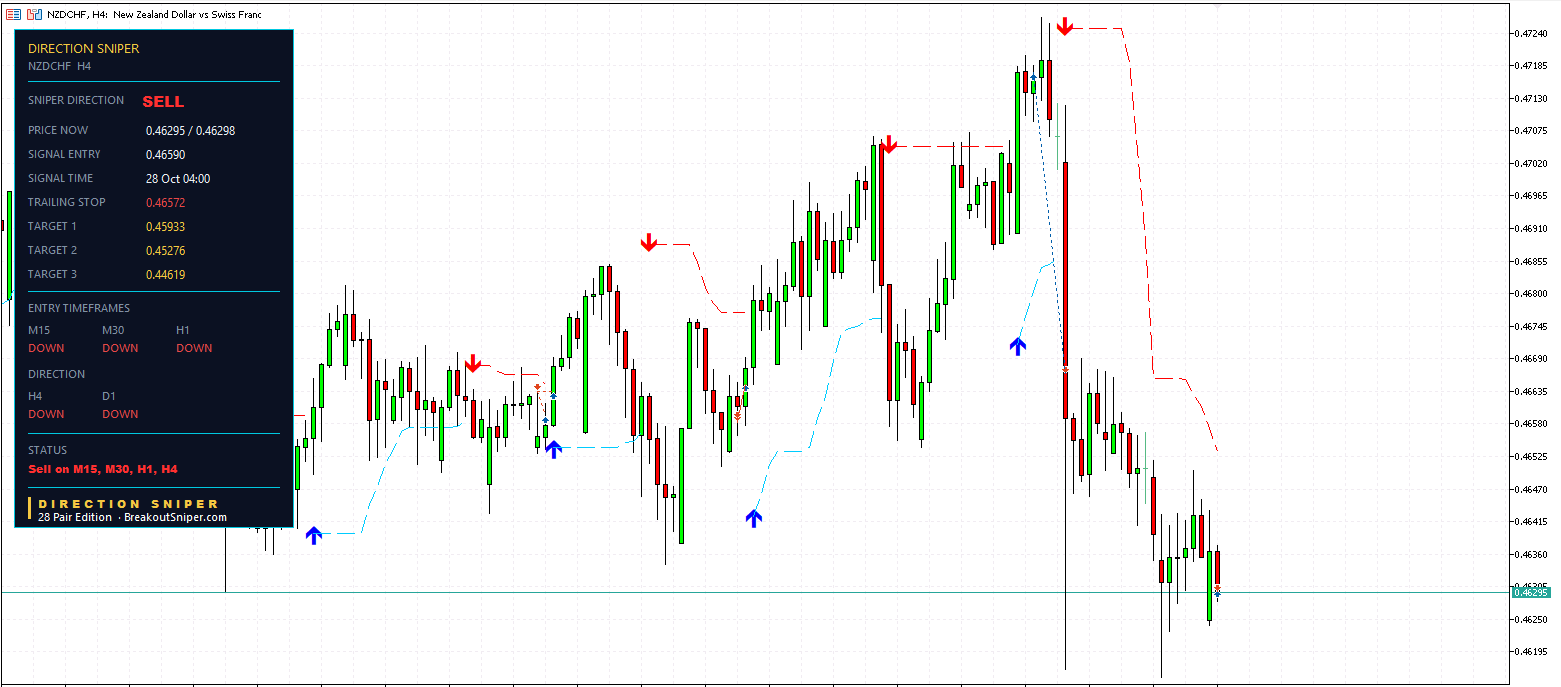
Take the shortlist from Step 1 and open each pair with the Direction Sniper panel. Keep only the pairs where the timeframes line up.
Here is NZDCHF, our sell example.
| Chart | Reads |
|---|---|
| M15 | DOWN |
| M30 | DOWN |
| H1 | DOWN |
| H4 | DOWN |
| Daily | DOWN |
The verdict reads SELL, and the status line reads Sell on M15, M30, H1, H4. Every entry chart is on the map. GBPNZD shows the mirror image: every timeframe UP, verdict BUY, status Buy on M15, M30, H1, H4.
That is the strongest reading the panel gives. The 4 hour and daily set the direction, and every faster chart agrees with it. When a strong against weak pair shows this, the strength ranking and the chart are telling the same story.
If the 4 hour and daily disagree, the panel shows NO TRADE, and the pair drops off your list, however good it looks on the ranking. We explain why in our guide to multi timeframe analysis for gold; the same rule applies to every forex pair.
5. Step 3: Check The H4 Structure
The last check is the simplest, and it uses your own eyes. Open the 4 hour chart and look at the last few weeks.
- In an uptrend, each pullback should hold above the one before it, making higher lows.
- In a downtrend, each rally should stop below the one before it, making lower highs.
- The pullbacks should look orderly, not like price is swinging the full width of the chart every day.
GBPNZD on the 4 hour is a textbook uptrend. For weeks the pair went sideways in a wide band, with arrows printing in both directions. Then one strong candle broke out of the top of that band, and since then every dip has held above the last. The trailing line steps up underneath price, and the panel’s buy ticket is now around 169 pips in its favour, with the trailing stop level already 15 pips in front of entry.
NZDCHF on the 4 hour is the downtrend version. The pair rallied to a high near 0.4724, a sell arrow printed at the top, and one long red candle gave back a large part of the rally. Since then each bounce has stopped lower than the one before. The trailing line steps down above price, and the sell ticket’s trailing stop level already sits in front of entry.
A pair that passes Steps 1 and 2 but fails this check is usually trending on paper and choppy in practice. Leave it on the watch list. A pair that passes all three, as both of these do, is one of the best trending forex pairs on the board.
6. Two Trending Pairs, Read Chart By Chart
Here is what the faster charts showed once both pairs had passed the scan. Every ticket below points in the direction of the verdict, because the panel does not print tickets against it.
The Buy: GBPNZD
| Chart | Ticket risk | Where it stands |
|---|---|---|
| H4 | 320.9 pips | Running, about 169 pips in favour, trailing stop level 15.2 pips in front of entry |
| H1 | 52.2 pips | Target 1 and Target 2 reached, then closed at the trailing stop, 52.0 pips in front of entry |
| M30 | 33.7 pips | Target 1 reached, still running |
| M15 | 27.3 pips | Target 1 and Target 2 reached, trailing stop level now in front of entry |
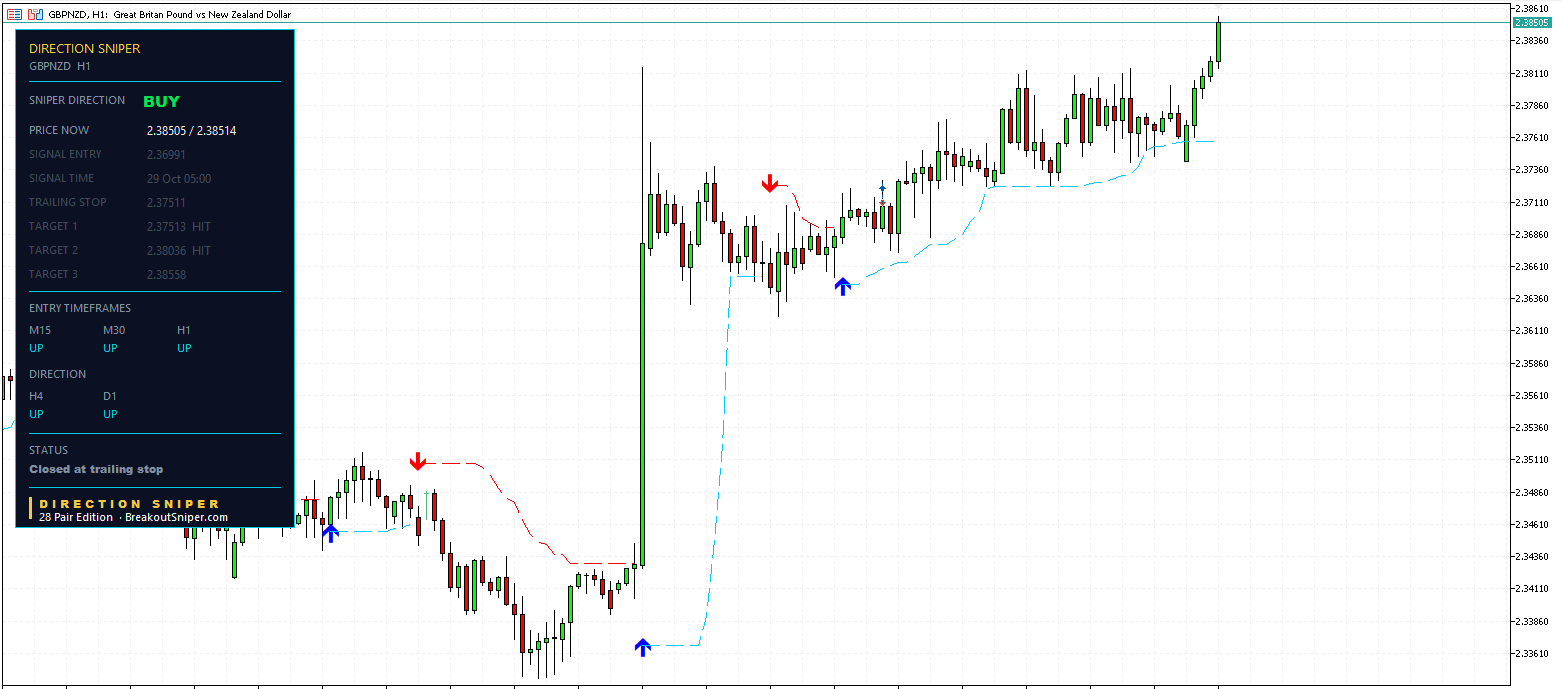
The 1 hour ticket shows the whole cycle. After a sharp rally, GBPNZD spent a while pulling back and drifting sideways. On a fast chart, that kind of pause looks like a top. The panel did not treat it as one: the 4 hour and daily stayed UP, a fresh buy ticket printed, and price went on to reach two targets. When the move finally paused, the ticket closed at its trailing stop level, which by then sat 52 pips in front of the entry.
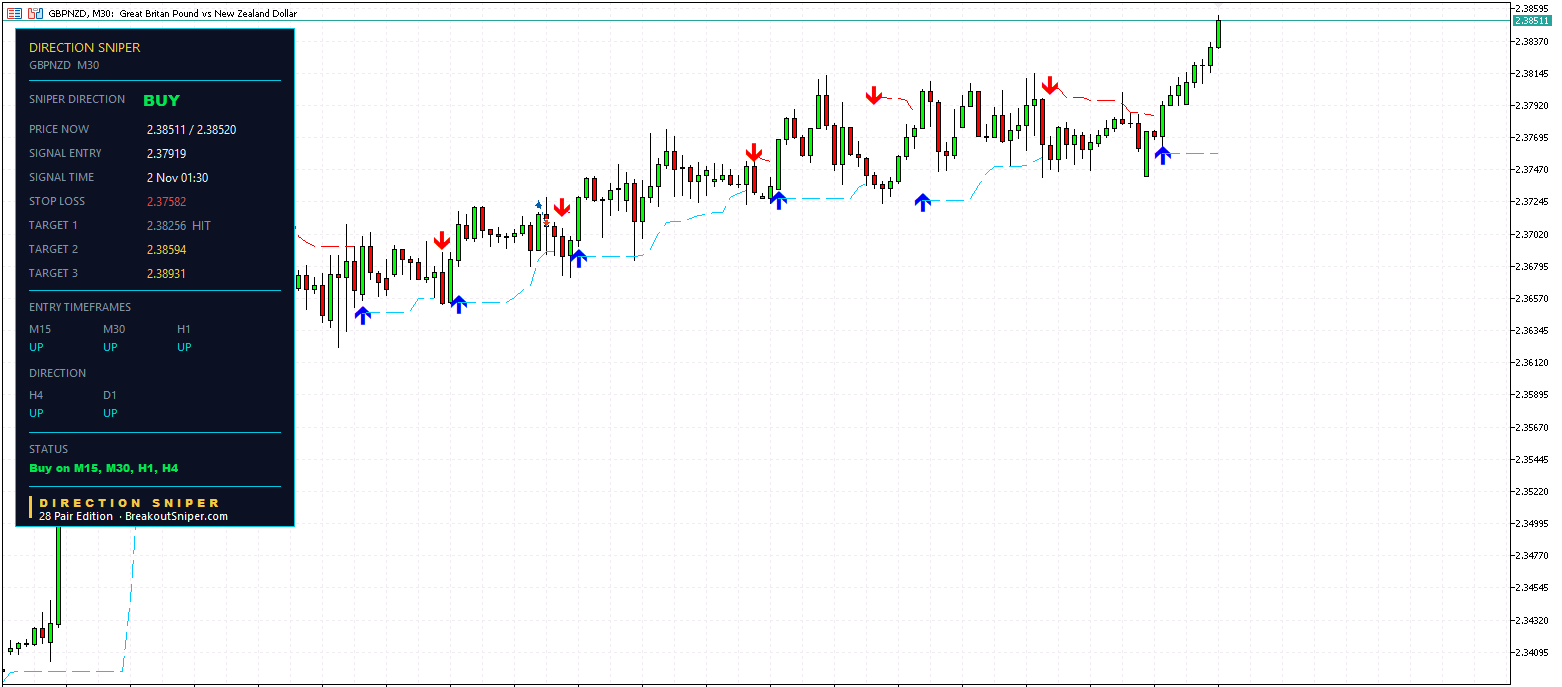
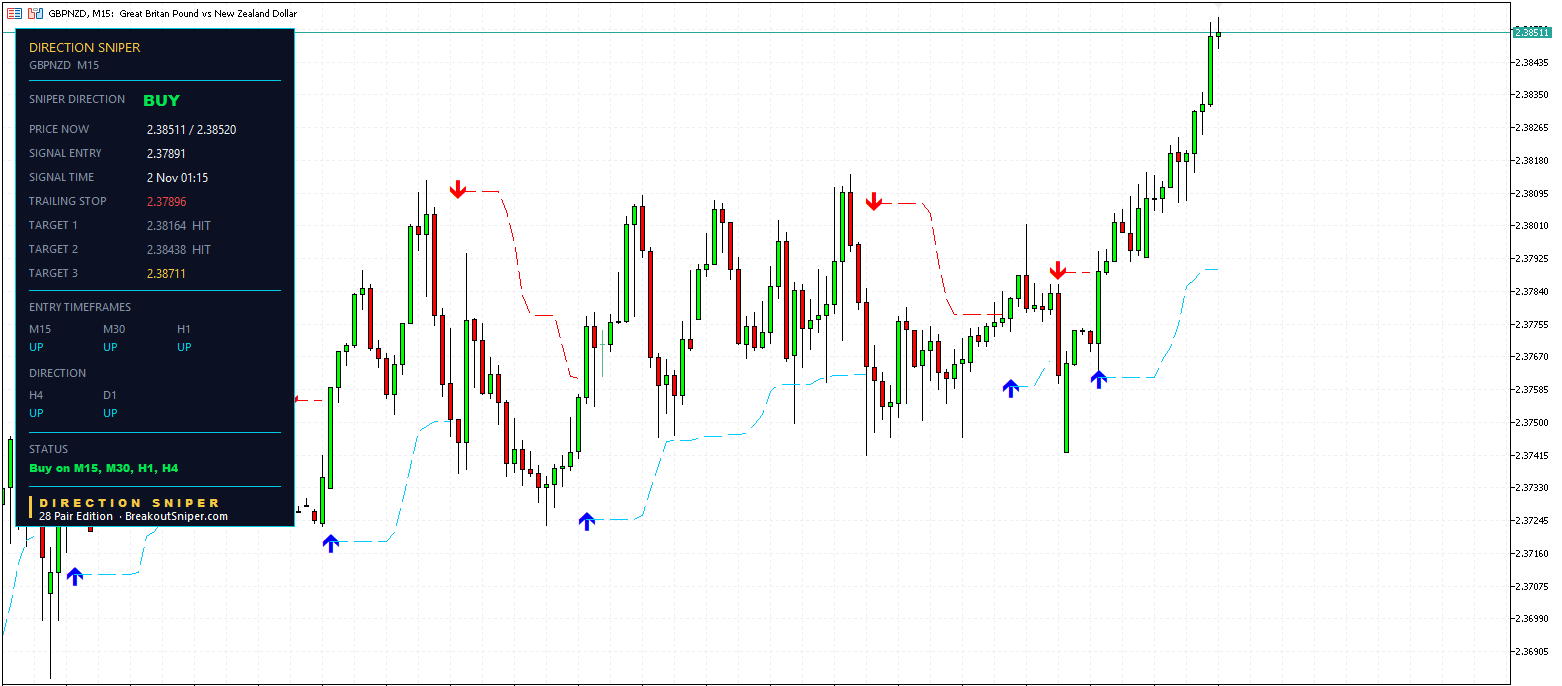
The 30 minute and 15 minute charts show what a trending pair does for a short term trader. Each pullback found buyers above the last one, and a new buy ticket printed after each pause. On the 15 minute chart, two targets were reached and the trailing stop level moved in front of entry.
The Sell: NZDCHF
| Chart | Ticket risk | Where it stands |
|---|---|---|
| H4 | 65.7 pips | Running, about 30 pips in favour, trailing stop level 1.8 pips in front of entry |
| H1 | 14.3 pips | Fresh ticket, running |
| M30 | 12.9 pips | Running, trailing stop level 7.6 pips above entry |
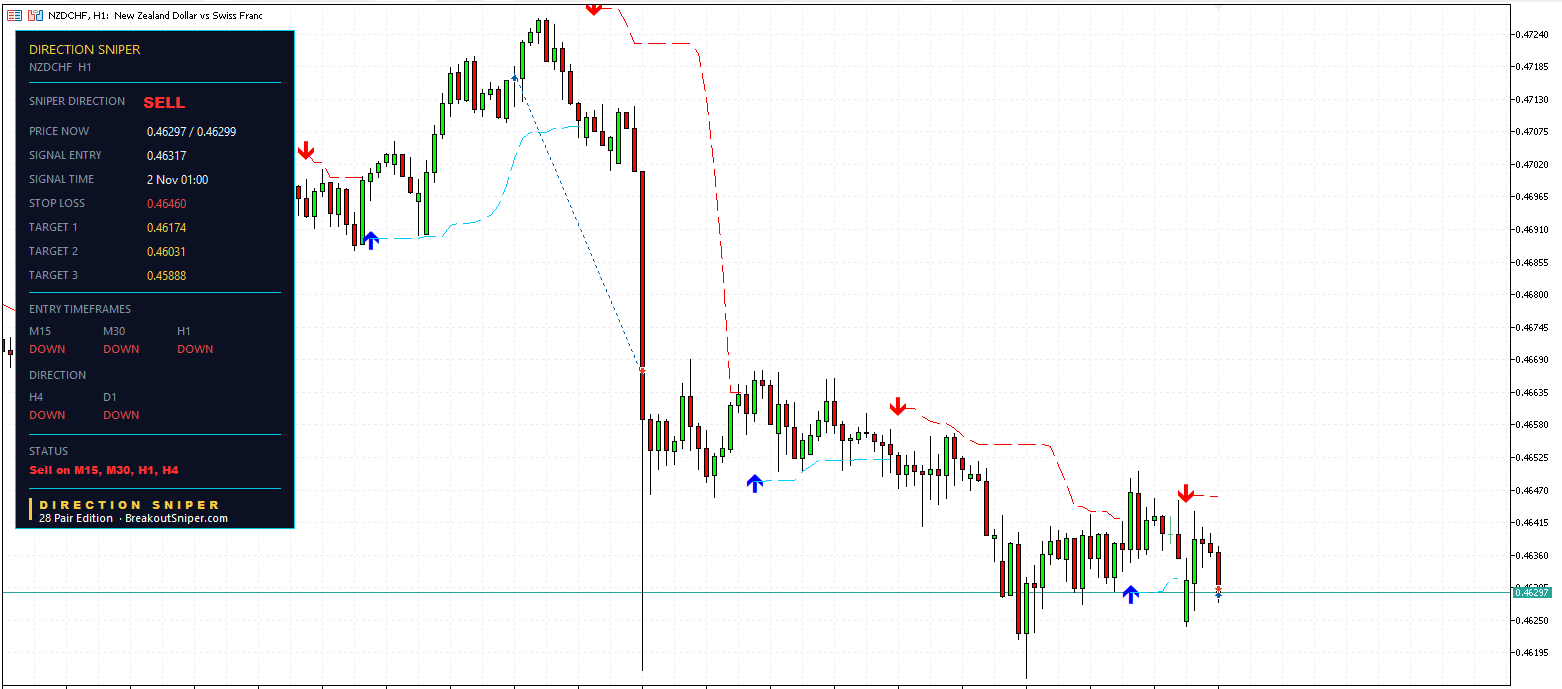
On the 1 hour chart, NZDCHF fell hard, then spent a long stretch drifting sideways with bounces in both directions. A trader watching only that chart could easily have bought one of those bounces. The 4 hour and daily still read DOWN, so the verdict stayed SELL, and the fresh 1 hour sell ticket printed as the drift rolled over.
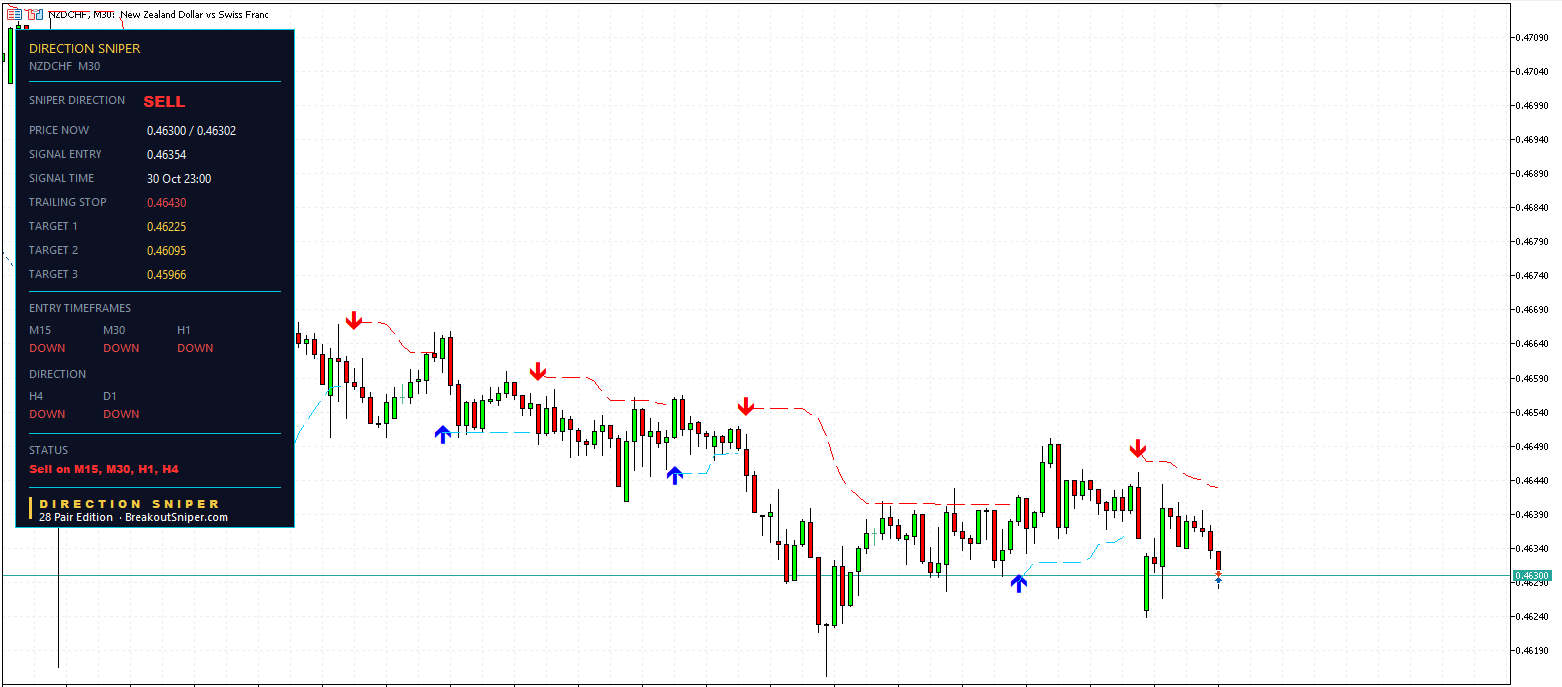
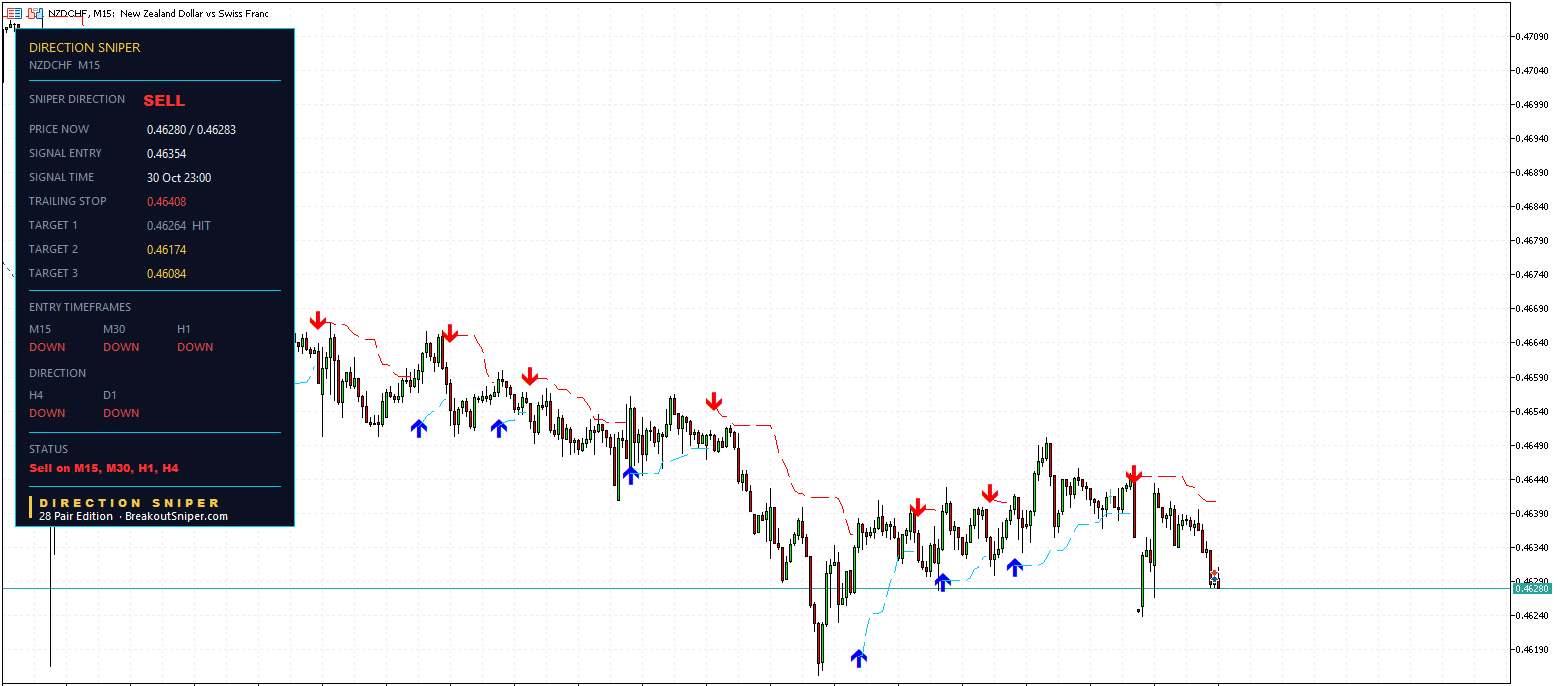
The 5 minute chart is worth a look for one reason: it shows how noisy a trending pair can be up close, with arrows in both directions every few hours. The 5 minute is not an entry chart on the panel, and this is why. The direction comes from the 4 hour and daily, and the panel still reads Sell on M15, M30, H1, H4.
That is the point of the scan. Find the pair where every chart agrees, then let the bigger charts hold the direction while the faster charts swing.
7. How To Spot A Choppy Pair, And Skip It
Knowing what to skip is half the job. A choppy pair usually shows at least one of these.
| Warning sign | What it tells you |
|---|---|
| Strong against strong, or weak against weak | Both currencies are moving together, so the pair goes nowhere |
| The panel shows NO TRADE | The 4 hour and daily disagree, so there is no direction to trade |
| Fast charts flip every few hours | The pair is ranging, not trending |
| Arrows in both directions on the H4 | Price keeps reversing before any move can run |
Look back at both 4 hour charts. Before GBPNZD broke out, it spent weeks in a band with buy and sell arrows printing one after another. Before NZDCHF turned down, it chopped higher with arrows in both directions too. The same pair can be choppy one month and trending the next. That is exactly why a fixed list of trending pairs does not work, and why the scan does.
Skipping choppy pairs is not a missed opportunity. Choppy pairs are where most traders give back what the trending pairs earned them. With Direction Sniper the decision is already made for you: no verdict, no ticket, no trade.
8. Do Not Stack The Same Trend
Here is the trap that catches traders once they find a strong trend.
Our two examples share one currency. A buy on GBPNZD and a sell on NZDCHF are both bets that the New Zealand dollar stays weak. Add a sell on NZDUSD and a buy on AUDNZD and you have four tickets on four charts, but one bet repeated four times. If the kiwi turns, all four can reach their stops on the same day.
That is why we follow two simple rules.
- Never more than 2 positions of the same kind or in the same direction. Our two examples are already that limit for the kiwi. A third NZD trade would be stacking.
- Watch about 12 pairs, not 28. Having every pair is an advantage only if you choose from it, not if you trade all of it.
And every position gets the same risk. We risk at most 2 percent per trade, usually 0.5 percent. Look at the two examples: the GBPNZD 4 hour ticket risked 320.9 pips, while the NZDCHF 1 hour ticket risked 14.3 pips. That is more than 20 times wider, so for the same dollar risk the GBPNZD lot size has to be far smaller. Pip values also differ from pair to pair. Work out the exact size in seconds with our free forex lot size calculator.
On a small account, a cent account makes sizes like that possible. For small balances we recommend a RoboForex Cent account or an XM Micro account. These are partner links, so we may receive a commission at no cost to you.
No single trade should ever make or break you. If you are worrying about every trade, your lot size is still too big.
9. The Five Minute Trending Pairs Checklist
- Which currencies are strongest and weakest today? Pair the top three against the bottom three.
- On those pairs, does every timeframe on the panel agree? If the panel says NO TRADE, skip it.
- Does the H4 show clean higher lows or lower highs? If not, watch list only.
- Am I already holding 2 positions on the same currency or direction? If yes, stop there.
- Is the lot size set from the stop, at 0.5 percent risk?
Find The Trend, Then Let The Panel Handle The Rest
Put the scan together.
The strength ranking tells you where to look. The panel tells you which way, and whether every timeframe agrees. The H4 tells you whether the trend has rhythm. Your lot size, and the limit of two positions per currency, decide how much.
That is Direction Sniper:
- Direction. One verdict from the 4 hour and the daily on every pair. GBPNZD read BUY and NZDCHF read SELL on every timeframe, so both passed the scan in seconds.
- Bounces that are not reversals. When GBPNZD paused and NZDCHF bounced, the verdict held because the bigger charts never turned, and the next tickets went with the trend.
- The stop loss. Every ticket arrives with its entry, stop and three targets marked. The panel then calculates and displays the trailing stop level as the trade develops, and you move your own stop to match it. On GBPNZD, that level moved in front of entry on three of the four charts.
The 28 Pair Edition puts this panel on all 28 pairs, MT4 or MT5, on one licence, so the scan above takes minutes instead of an evening.
Want the strongest and weakest currencies in your inbox every trading day? Join The Daily Sniper Read, free.
More guides on reading direction, managing trades and sizing positions: Trading Guides.
Best Trending Forex Pairs: Frequently Asked Questions
1What are the best trending forex pairs?+
There is no fixed list. A pair trends while one of its currencies is strong and the other is weak, so the best trending forex pairs change over time.
Pair one of the three strongest currencies against one of the three weakest, and you get about nine pairs worth watching out of 28.
2How do I find trending forex pairs?+
Run a 3 step scan. Start with the strongest and weakest currencies, keep only the pairs where every timeframe on the Direction Sniper panel agrees, then check the H4 for clean higher lows or lower highs.
A pair that passes all three checks is trending. A pair that fails one goes on the watch list.
3Is GBPJPY always a trending pair?+
No. GBPJPY trends when the pound is strong and the yen is weak. When both are moving together, it can range for weeks like any other pair.
Check the currencies first, then the chart, rather than relying on a pair’s reputation.
4Can the same pair be choppy and then trending?+
Yes. In our examples, GBPNZD spent weeks in a sideways band on the 4 hour chart with arrows in both directions, then broke out and made higher lows. NZDCHF chopped higher before turning into a downtrend with lower highs.
That is why a fixed list of trending pairs does not work. The scan checks what each pair is doing now.
5Why does the panel show NO TRADE on a pair that looks like it is trending?+
Because the 4 hour and daily charts disagree. One may still point with the trend while the other has turned, so there is no clear direction.
The pair drops off the list until the two charts agree again, however good it looks on the strength ranking.
6Should I trade every trending pair at once?+
No. Trending pairs often share one currency. A buy on GBPNZD and a sell on NZDCHF are both bets on a weak New Zealand dollar, so we never take more than 2 positions of the same kind or in the same direction.
Pick the cleanest one or two, and watch about 12 pairs rather than all 28.
7How much should I risk on each trending pair?+
We risk at most 2 percent per trade, usually 0.5 percent, on every pair. Stops differ widely: in our examples, a 4 hour GBPNZD ticket risked 320.9 pips while a 1 hour NZDCHF ticket risked 14.3 pips, so the lot sizes must be very different for the same risk.
A lot size calculator works it out in seconds. These figures are for illustration, not a recommendation about how much anyone should trade.
8How often do the trending pairs change?+
They change whenever the strongest and weakest currencies change. Some trends last for weeks, others for a few days.
That is why we publish the strongest and weakest currencies every trading day, so the scan always starts from the current board.
DIRECTION SNIPER 28 PAIR EDITION
See which of the 28 pairs are trending, in minutes.
One verdict per pair, every timeframe on one panel, and a ticket with entry, stop and three targets. MT4 or MT5, one licence.
Disclaimer: This guide explains how we look for trending forex pairs using currency strength and the Direction Sniper panel. It is educational content, not financial advice and not a trade signal service. The GBPNZD and NZDCHF examples show what the panel displayed when the screenshots were taken, and are not a forecast or a trade recommendation. Price reaching a published target level is not the same as a realised result. Pip values and lot sizes depend on the pair, the exchange rate and your broker, and are not a recommendation about how much anyone should trade. Forex trading carries risk, and you should only trade money you can afford to lose.

